MyChart
- Utilidades
- Maxim Kuznetsov
- Versión: 1.0
- Activaciones: 5
The beautiful design of the trading chart makes trading more convenient and enjoyable. MyChart neatly marks out the time and price grid. Marks up the visual labels of the graph. Displays candlesticks of the older period, spread and stop-level levels. Flexible options allow you to customize the appearance to your taste. It looks good in any color theme of the terminal.
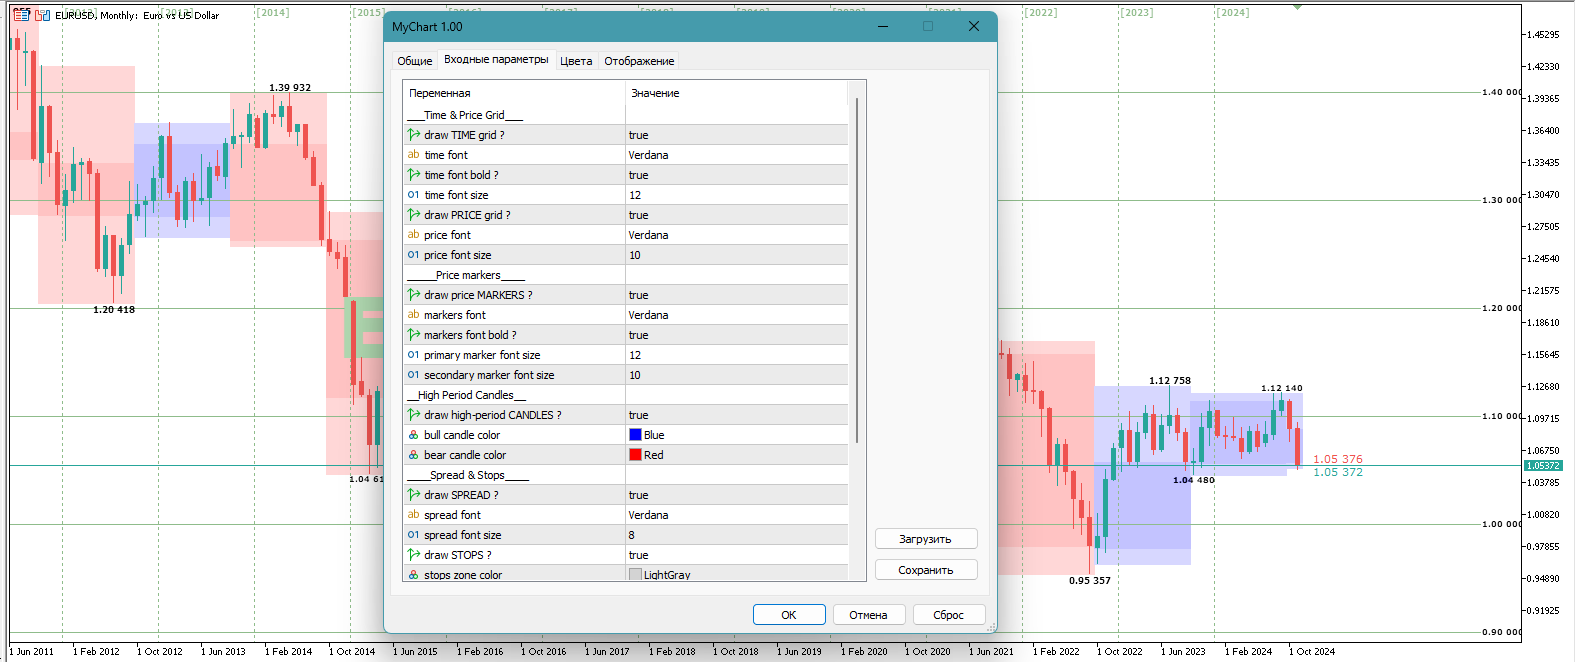
Settings
TIME & PRICE grid - the appearance of the time and price grid. You can turn the grids on/off separately. Set fonts and sizes of labels. The colors are taken from the terminal theme settings
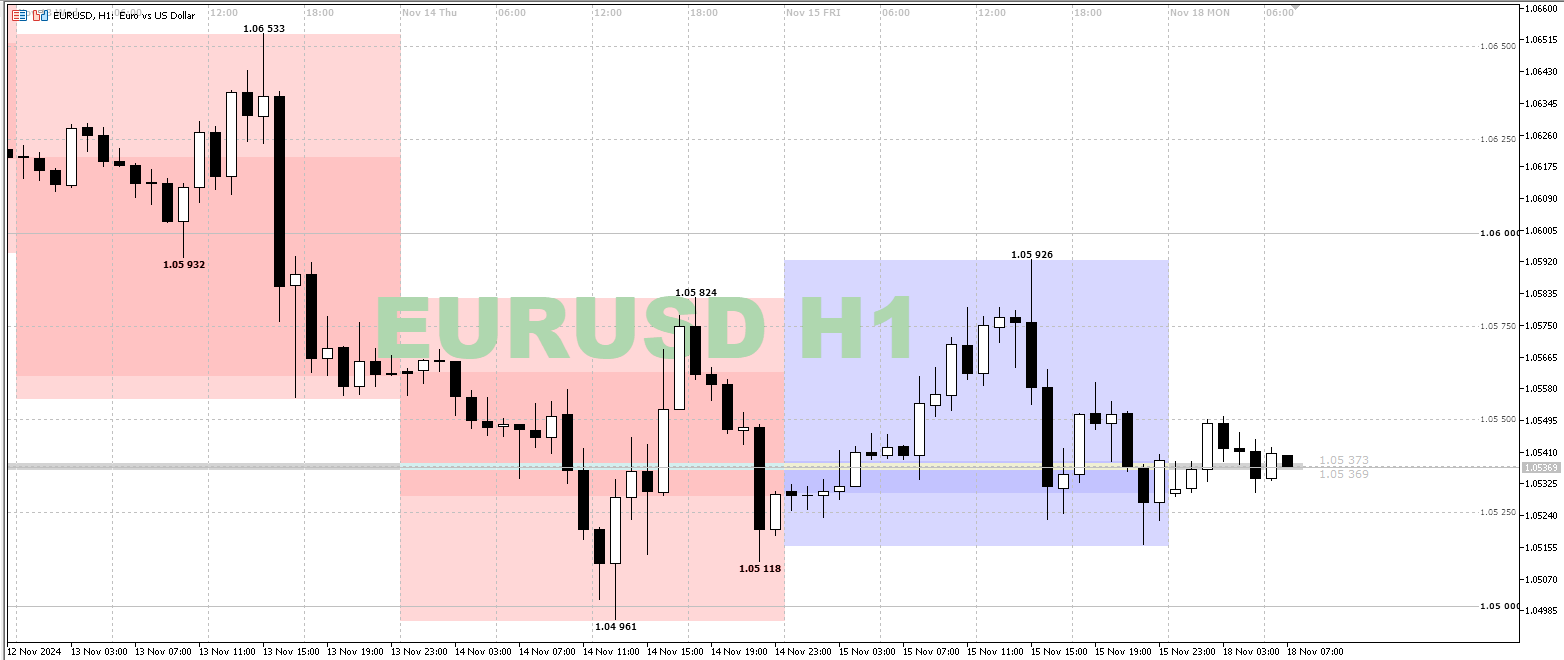
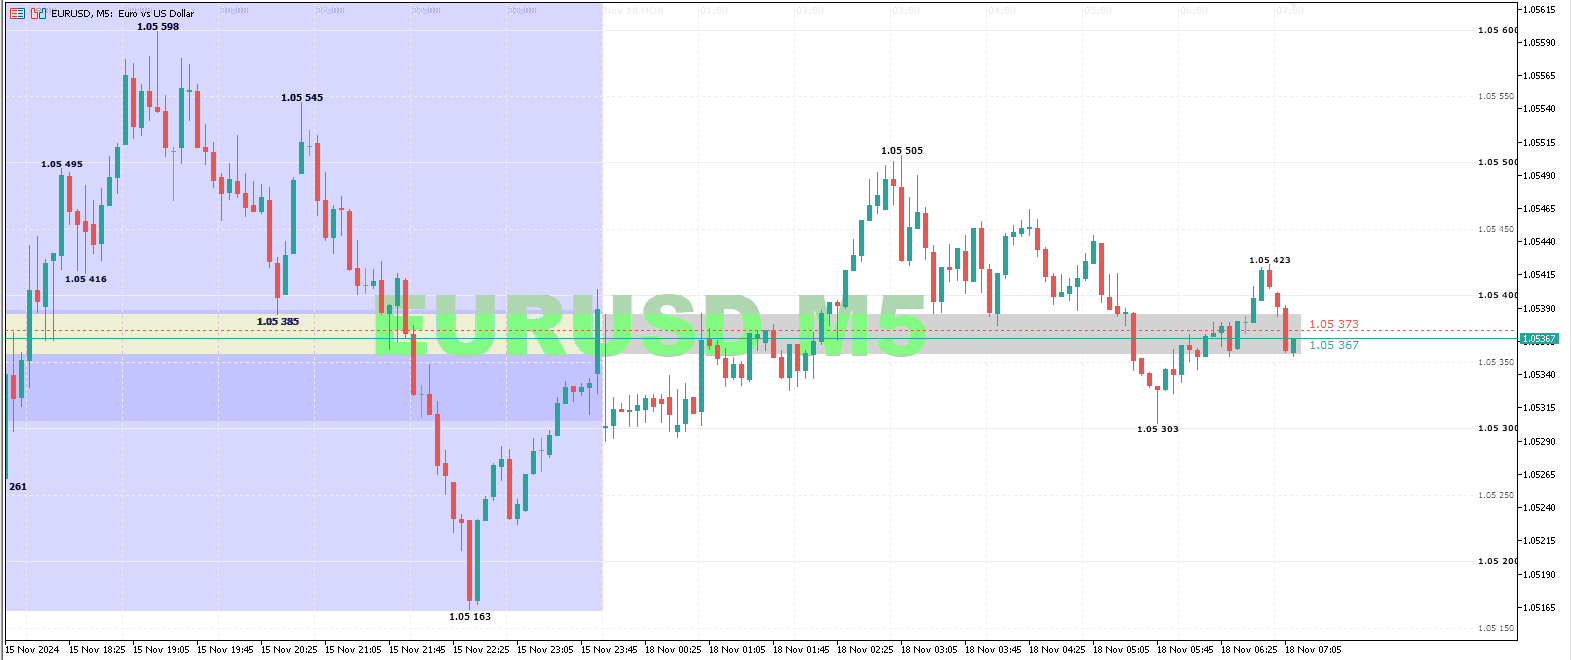
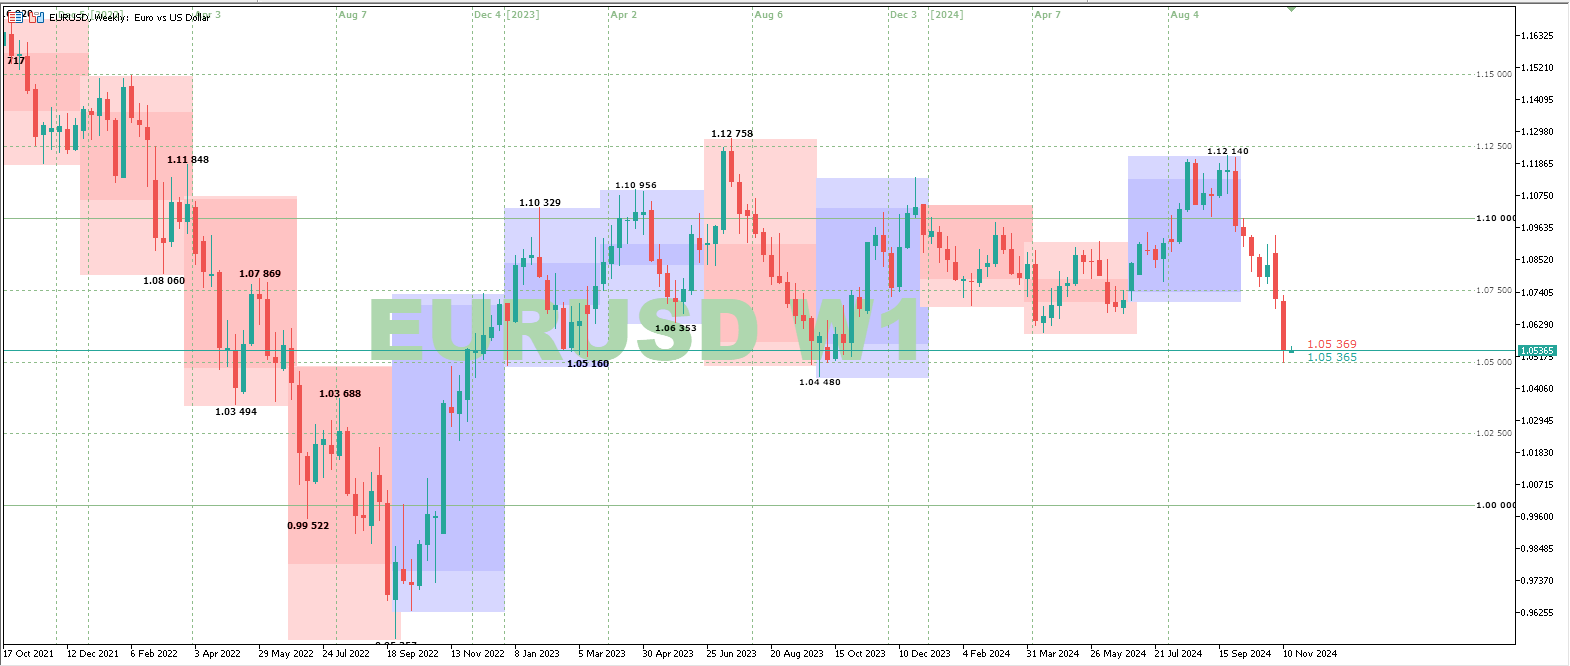
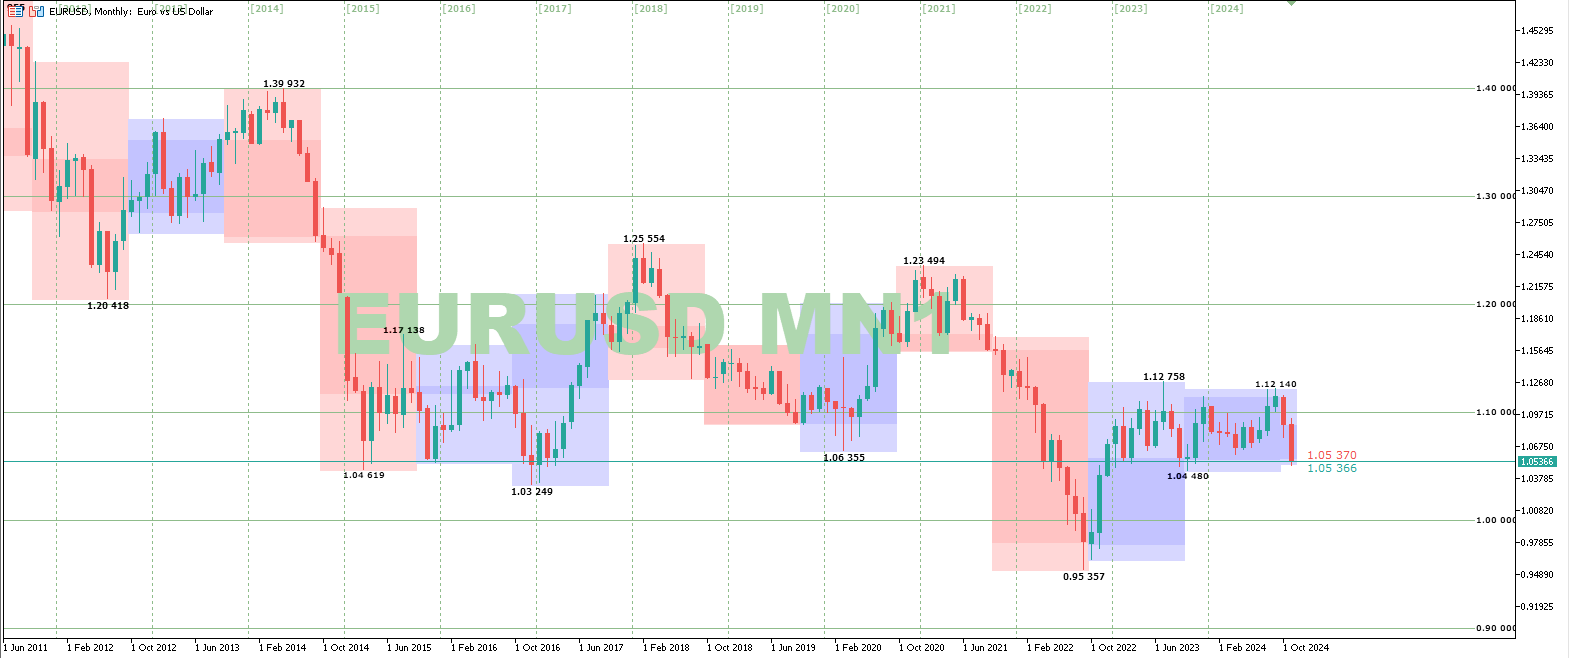
PRICE MARKERS - labels on the chart. They mark the most notable moments, the highest price, the lowest, and the ones following them. (this is not a zigzag!). You can set the font and size of the labels. The colors are taken from the terminal theme
High Period CANDLES - displays candles of the older natural period. Candlesticks are displayed as colored bars. On the lower timeframes, D1 is displayed, on H4 - a week, on D1 - a month, on W1 - a quarter, on MN1 - the US fiscal year. You can customize the colors of the candles
SPREAD & STOPS - displays the Bid,Ask and +-StopLevel levels. You can customize the font of the labels and the color of the StopLevel area. The colors of the lines and text are taken from the terminology settings.
Chart TITLE - the name of the instrument and the period on the chart. You can turn on/off and adjust the color and font
The indicator was made for itself and such a set of components and chart design are dictated by practice.
I hope you enjoy it and it will be useful