• Información general
  • Comentarios (3)
  • Discusión
  • Novedades

Volumatic VIDyA MT4

5
Special offer: ALL TOOLS, just $35 each!

New tools will be $30 for the first week or the first 3 purchases

Trading Tools Channel on MQL5: Join my MQL5 channel to update the latest news from me

Volumatic VIDYA (Variable Index Dynamic Average) es un indicador avanzado diseñado para rastrear tendencias y analizar la presión de compra-venta en cada fase de una tendencia. Utilizando el Promedio Dinámico de Índice Variable (Variable Index Dynamic Average) como técnica principal de suavizado dinámico, esta herramienta proporciona información crítica sobre las dinámicas de precios y volúmenes en niveles estructurales clave del mercado.

Ver la versión para MT5 en: Volumatic VIDyA MT5

Ver más productos en: Todos los Productos

To use iCustom for EA, please see here: Create EA (iCustom) with VOLUMATIC VIDYA

Concepto Principal

Volumatic VIDYA destaca en la identificación de tendencias mientras analiza la presión de volumen que las impulsa. La línea VIDYA se adapta dinámicamente a la fuerza de los movimientos de precios, haciéndola más receptiva y precisa que promedios móviles tradicionales como el SMA o EMA.

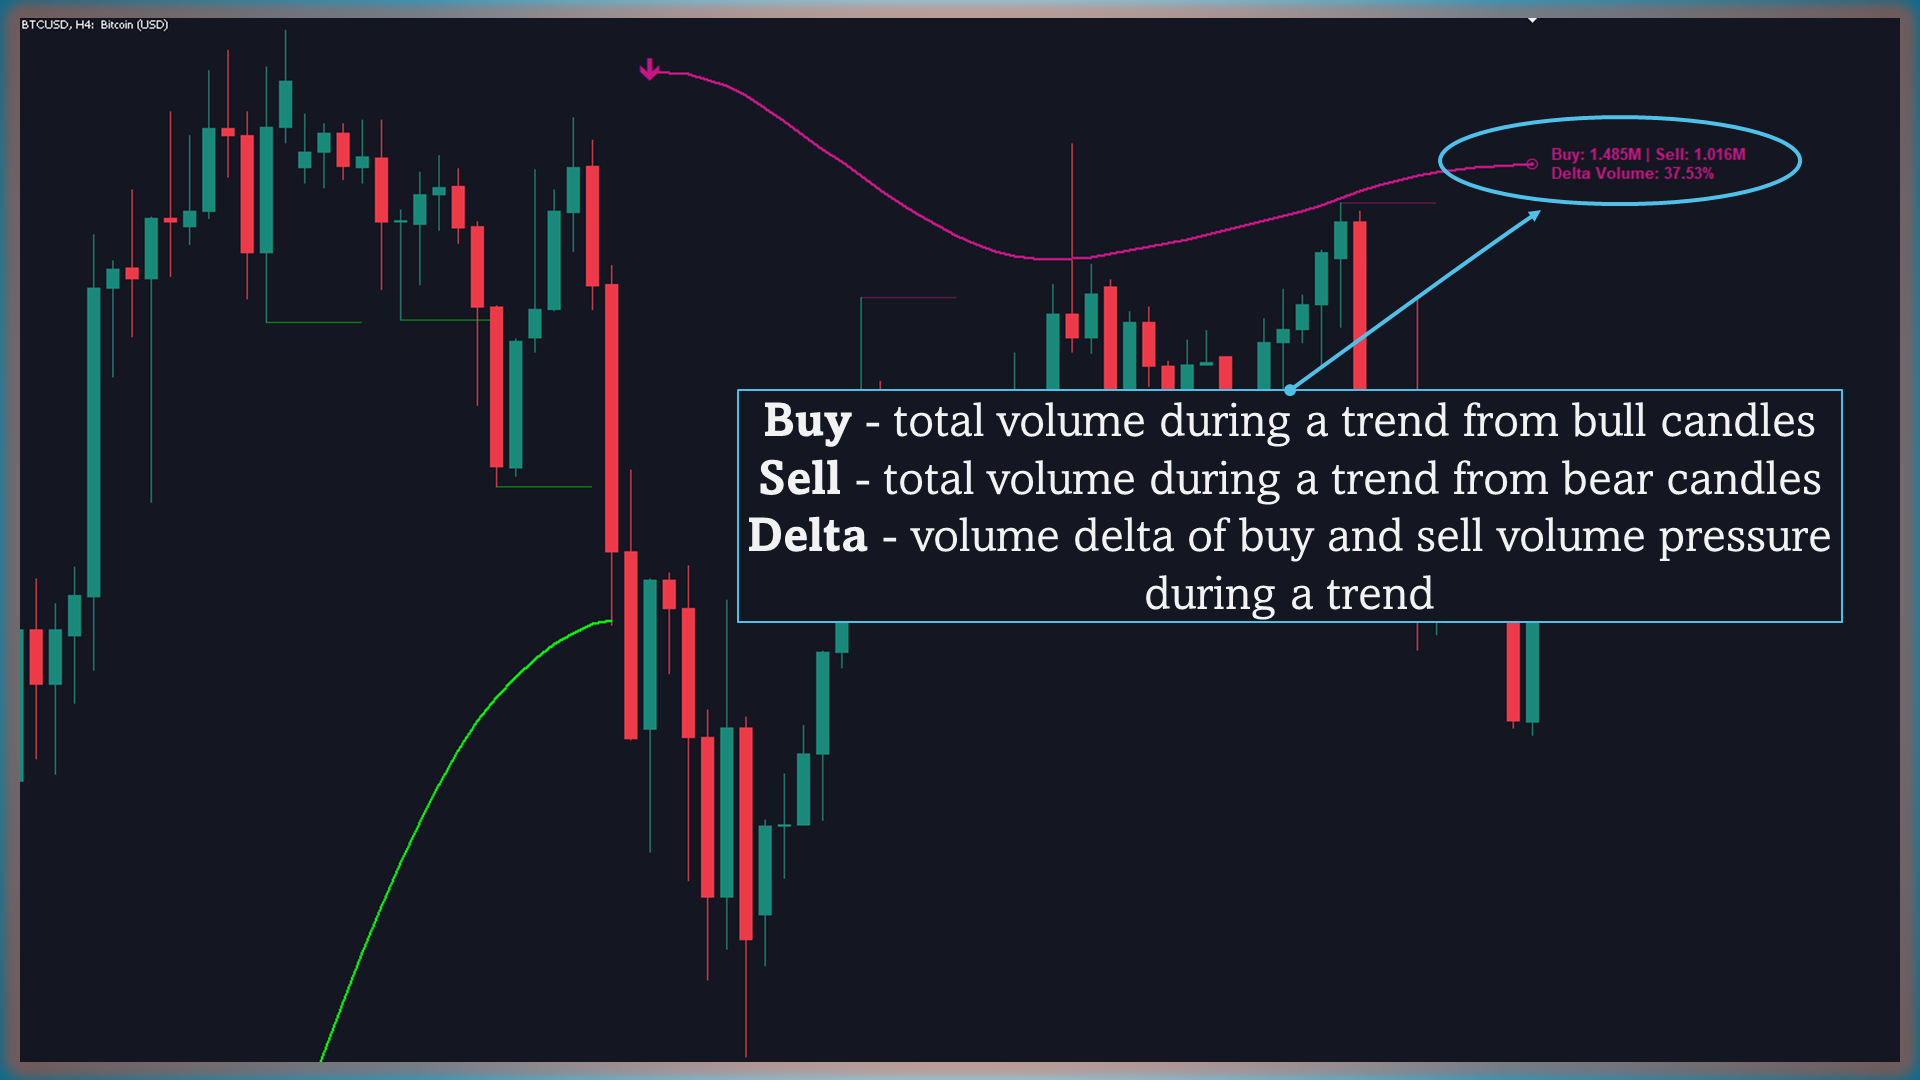
Más allá de la detección de tendencias, Volumatic VIDYA calcula y visualiza la presión de compra-venta, ofreciendo una perspectiva completa sobre la participación del mercado. Las líneas horizontales trazadas desde los pivotes estructurales del mercado, mejoradas con datos de volumen, destacan niveles clave de soporte y resistencia.

Además, la funcionalidad de alertas asegura que los traders estén informados sobre movimientos críticos del mercado, convirtiendo a Volumatic VIDYA en una herramienta de trading proactiva.

Características Principales

1. Cálculo Dinámico de VIDYA

VIDYA se ajusta dinámicamente al impulso y la volatilidad del mercado utilizando el Oscilador de Impulso de Chande (CMO). Esto le permite:

  • Responder rápidamente: Capturar cambios rápidos en el mercado con un mínimo retraso.
  • Filtrar el ruido: Proporcionar señales claras incluso durante periodos de baja volatilidad.
2. Señales de Cambio de Tendencia con Flechas

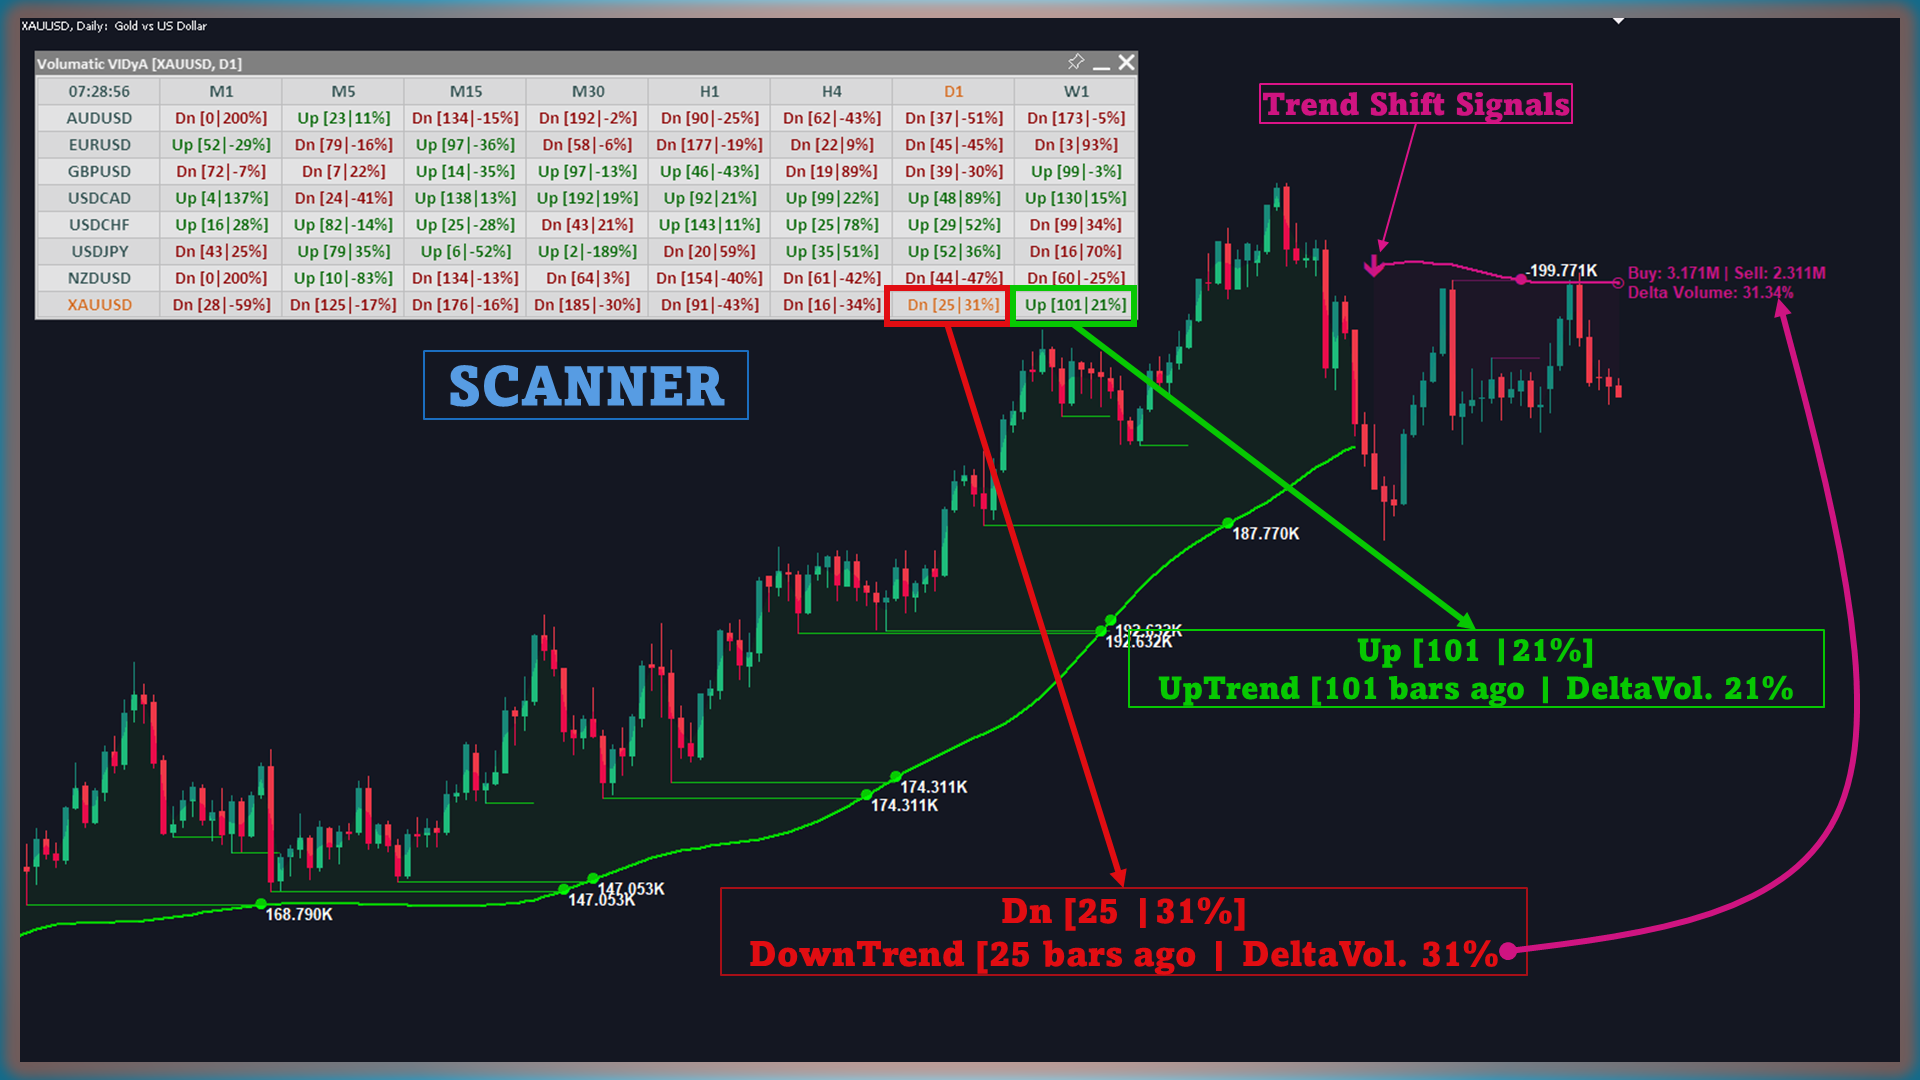
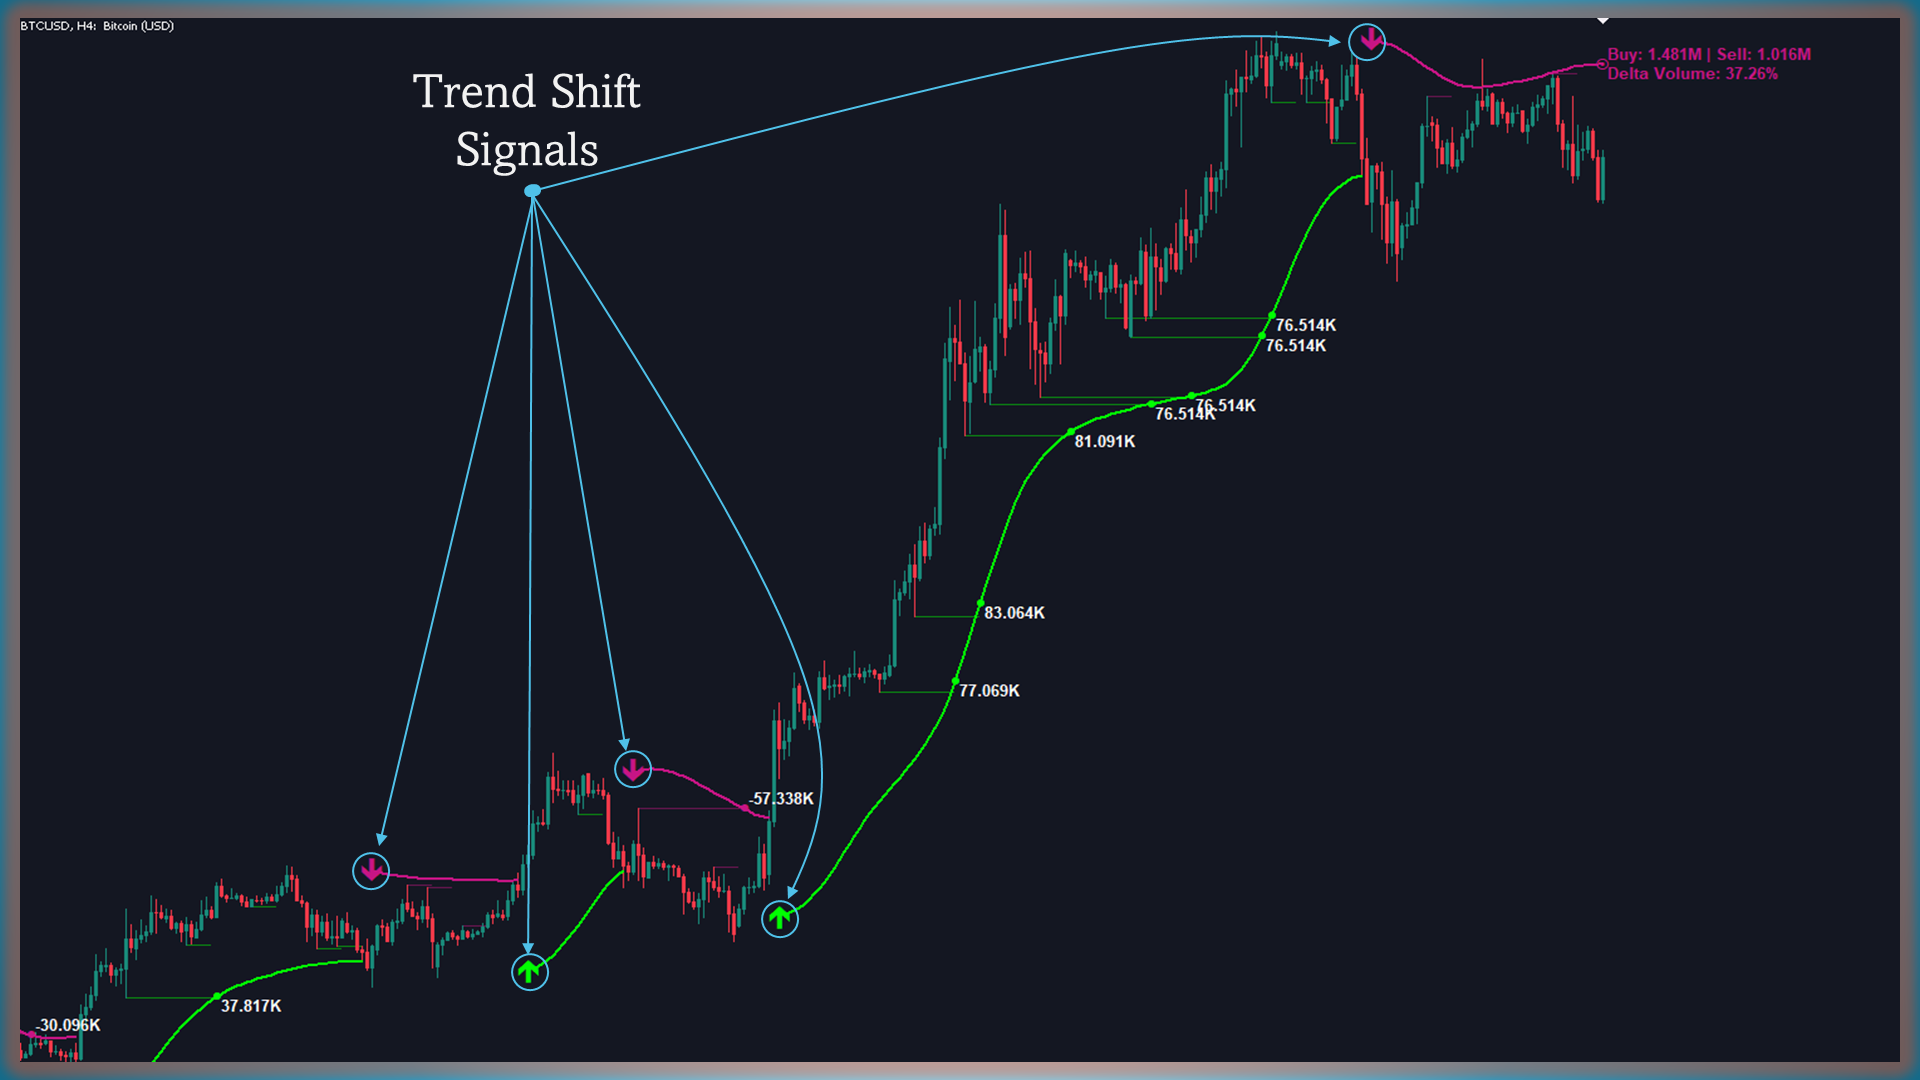
Para indicar inversiones de tendencia, Volumatic VIDYA utiliza flechas intuitivas:

  • Flechas hacia arriba: Indican posibles inversiones alcistas cuando el precio cruza por encima de la línea VIDYA.
  • Flechas hacia abajo: Señalan posibles cambios bajistas cuando el precio cae por debajo de la línea VIDYA.

Estas señales están complementadas por Alertas de Cambio de Tendencia, notificando a los traders en tiempo real cuando ocurren estos eventos. Las alertas permiten tomar medidas oportunas incluso cuando no están frente a la pantalla, ayudando a los traders a aprovechar oportunidades o mitigar riesgos.

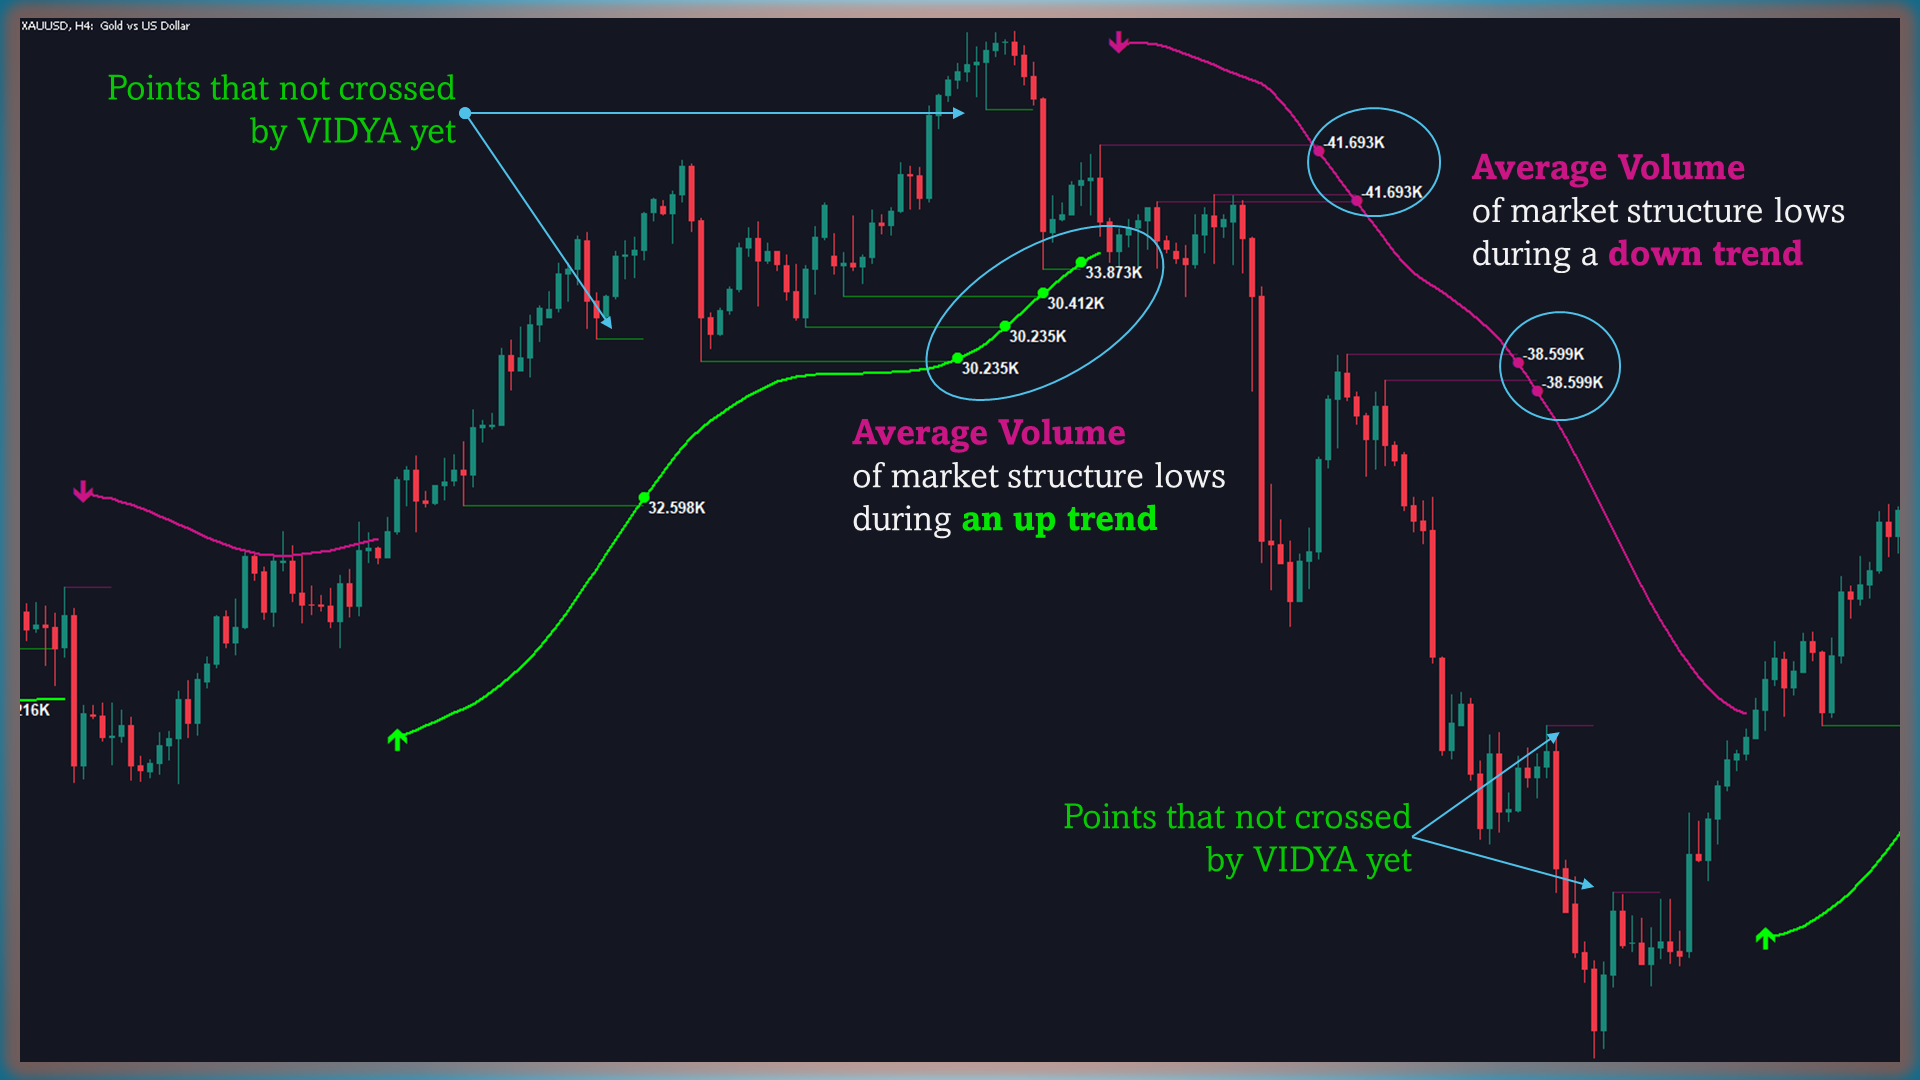
3. Líneas de Pivote Estructural del Mercado con Etiquetas de Volumen

Los niveles de soporte y resistencia se definen mediante líneas horizontales trazadas desde los pivotes estructurales del mercado:

  • Líneas de liquidez horizontal: Trazadas desde máximos y mínimos de precios, extendiéndose hasta que se rompan.
  • Etiquetas de volumen: Muestran el volumen promedio de las últimas seis velas en estos niveles para mayor claridad sobre la fortaleza del mercado.

Las alertas de Línea de Liquidez Extendida notifican a los traders cuando se rompen estos niveles críticos. Esta función es especialmente útil para:

  • Identificar posibles rupturas o retrocesos.
  • Anticipar movimientos de precios cerca de niveles de interés significativos.
  • Ajustar dinámicamente niveles de stop-loss o take-profit.
4. Alertas para Eventos Clave del Mercado

Volumatic VIDYA integra un robusto sistema de alertas para mejorar la eficiencia del trading:

  • Alertas de Cambio de Tendencia: Se activan cuando el precio cruza la línea VIDYA, marcando posibles inversiones alcistas o bajistas.
  • Alertas de Línea de Liquidez Extendida: Notifican a los traders cuando el precio rompe niveles clave de pivote, señalando posibles escenarios de ruptura o retroceso.

Estas alertas son personalizables, permitiendo notificaciones a través de correo electrónico, push o sonido, asegurando que esté informado sin necesidad de monitorear constantemente los gráficos.
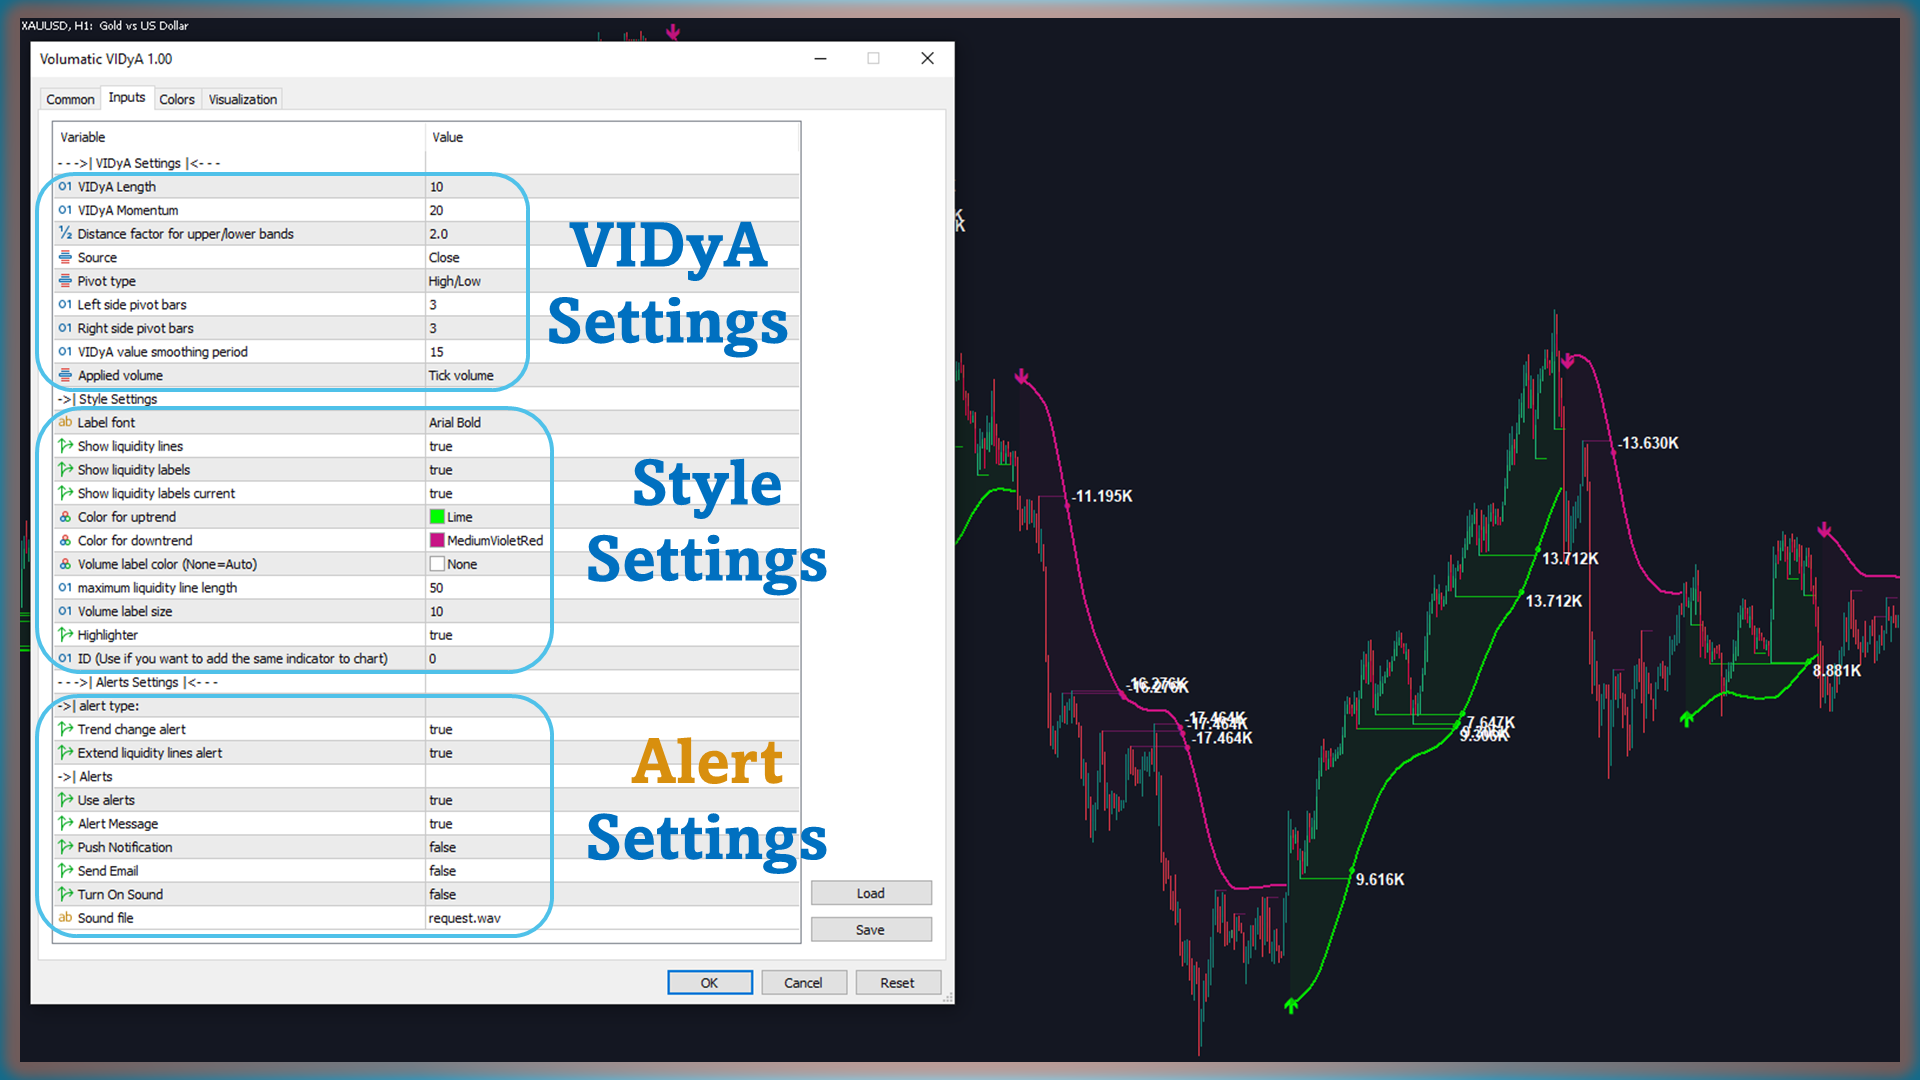
Opciones de Personalización

Volumatic VIDYA es altamente flexible, con opciones que se adaptan a diversos estilos de trading:

  • Configuraciones de VIDYA: Ajuste de longitud e impulso para una respuesta personalizada a las tendencias.
  • Sensibilidad en la detección de pivotes: Defina el número de velas utilizadas para calcular puntos de pivote.
  • Preferencias de alerta: Personalice las notificaciones para centrarse en eventos específicos del mercado, reduciendo distracciones innecesarias.
Cómo Usar Volumatic VIDYA Efectivamente
  1. Supervise tendencias: Use la línea VIDYA para seguir la dirección del mercado y alinear su estrategia.
  2. Analice la presión de volumen: Aproveche el delta de volumen para confirmar la fortaleza de la tendencia o detectar inversiones.
  3. Planee alrededor de las líneas de liquidez: Utilice los niveles de pivote y alertas asociadas para identificar zonas de ruptura o soporte.
  4. Habilite alertas: Automatice el monitoreo para ahorrar tiempo mientras permanece informado sobre cambios clave.
¿Por qué Elegir Volumatic VIDYA?

Combinando el seguimiento dinámico de tendencias, análisis de volumen y alertas proactivas, Volumatic VIDYA se destaca como una herramienta de trading integral. Ya sea que esté operando en scalping, trading de rango medio o posiciones a largo plazo, este indicador ofrece:

  • Adaptabilidad dinámica: Captura tendencias de manera efectiva en mercados volátiles.
  • Información de volumen: Agrega contexto a los movimientos de precios para una mejor toma de decisiones.
  • Alertas en tiempo real: Lo mantiene informado sobre eventos clave sin necesidad de monitoreo constante.

¡Manténgase por delante en el mercado con Volumatic VIDYA, su socio definitivo para dominar tendencias, volúmenes y trading proactivo!


Comentarios 3
jabautista
3801
jabautista 2025.03.24 19:48 
 

Solid indicator. Developer is very open suggestions and has great customer service!

Nikodem Dobrzynski
277
Nikodem Dobrzynski 2025.01.24 18:22 
 

Volumatic VIDyA is a very useful indicator that combines both trend and volume indications. When combined with other technical analysis indicators, it can be a great tool in your strategy. Niko.

XANKEEZ
469
XANKEEZ 2025.01.03 09:42 
 

VIDYA is a unique indicator that combines trend and volume analysis. for best results, use it with other indicators like RSI or ADX. the author keeps updating and making it better each time.

Productos recomendados
Special offer : ALL TOOLS , just $35 each! New tools   will be   $30   for the   first week   or the   first 3 purchases !  Trading Tools Channel on MQL5 : Join my MQL5 channel to update the latest news from me El indicador Niveles de Tendencia (Trend Levels) está meticulosamente diseñado para identificar niveles de tendencia críticos — Alto, Medio y Bajo — durante los movimientos del mercado. Con cálculos en tiempo real basados en los valores más altos, más bajos y de nivel medio a lo largo de
Oferta especial : ALL TOOLS , ¡solo $35 cada uno! New tools   will be   $30   for the   first week   or the   first 3 purchases !  Trading Tools Channel on MQL5 : Join my MQL5 channel to update the latest news from me En un entorno de trading volátil, una herramienta de análisis potente e intuitiva puede ayudarte a aprovechar las oportunidades rápidamente. Fibonacci Trend Scanner no solo integra las funciones tradicionales del indicador de Fibonacci y SuperTrend, sino que también amplía la func
SMC System MT4
Duc Hoan Nguyen
5 (1)
Special offer : ALL TOOLS , just $35 each! New tools   will be   $30   for the   first week   or the   first 3 purchases !  Trading Tools Channel on MQL5 : Join my MQL5 channel to update the latest news from me SMC es un enfoque de trading que ayuda a los traders a identificar zonas de liquidez, posiciones de órdenes institucionales y puntos clave de giro del mercado. Al aprovechar los principios de SMC, los traders pueden navegar por el mercado de manera más efectiva, encontrando entradas y sa
Special offer : ALL TOOLS , just $35 each! New tools   will be   $30   for the   first week   or the   first 3 purchases !  Trading Tools Channel on MQL5 : Join my MQL5 channel to update the latest news from me Descripción general OA SnR Power es una herramienta poderosa diseñada para ayudar a los traders a identificar y evaluar la fortaleza de los niveles de soporte y resistencia. Al incorporar factores clave como el volumen de operaciones, la frecuencia de rebote y el recuento de pruebas, es
FREE
Voenix
Lorentzos Roussos
4.58 (12)
Patrones armónicos , escáner y comerciante  Patrones incluidos: patrón ABCD patrón garley patrón de murciélago patrón de cifrado 3Patrón de unidades patrón de cisne negro Patrón de cisne blanco Patrón Quasimodo o patrón Over Under Patrón de murciélago alternativo patrón de mariposa Patrón de cangrejo profundo patrón de cangrejo patrón de tiburón Patrón FiveO patrón de cabeza y hombros patrón de triángulo ascendente Patrón uno dos tres Y 8 patrones personalizados Voenix es un escáner de patrones
Fibonacci calculator is used with Elliot Waves, it can generate remarkable results. A trader could use these levels or ratios to find high probability trades with very small stop loss. You may also use these ratios to find Elliott Waves extensions and to book profit near those levels. For Elliot Wave experts, Fibonacci calculator is a highly useful tool that can assist them in calculating Fibonacci extension and retracement levels for the market price. The indicator proves itself as a useful one
Introduction to X3 Chart Pattern Scanner X3 Cherart Pattern Scanner is the non-repainting and non-lagging indicator detecting X3 chart patterns including Harmonic pattern, Elliott Wave pattern, X3 patterns, and Japanese Candlestick patterns. Historical patterns match with signal patterns. Hence, you can readily develop the solid trading strategy in your chart. More importantly, this superb pattern scanner can detect the optimal pattern of its kind. In addition, you can switch on and off individu
Fibonacci SR Indicator Este indicador dibuja las líneas de soporte y resistencia. El producto se basa en los niveles de retroceso y expansión de Fibonacci (Fibonacci Retracement and Extension levels). El indicador toma en consideración múltiples combinaciones de los niveles de Fibonacci y dibuja las líneas de soporte/resistencia. En sus cálculos el indicador utiliza los valores de las crestas y los valles construidos por el indicador ZigZag. Si hace falta, también se puede mostrar el ZigZag en e
FREE
I just sell my products in Elif Kaya Profile , any other websites are stolen old versions, So no any new updates or support. - Lifetime update free -   Real price is 80$   - 40% Discount ( It is 49$ now ) Contact me for instruction, any questions! Related Product:  Gold Expert  ,  Professor EA - Non-repaint Introduction Flag patterns are an important tool for technical traders in the stock market. When interpreting a flag pattern, it is important to wait for the pattern to pick a direction b
Ratio market
Aleksandr Krokhalev
4.33 (15)
Volatility under control. The indicator shows the optimal depth for setting goals within the day and on the average trend. It also builds pivot zones for the estimated correction depth. As an accompaniment, the key levels of the structure are displayed for several timeframes. Classical volatility indicators ATR & ADX on fixed timeframes are used for calculation. The calculation takes into account the spread, and if the market is slightly volatile, you will see a warning about the risk. You can c
FREE
NO REPAINT ADVANCED CHART PATTERN INDICATOR By definition, a price ( chart)  pattern is a recognizable configuration of price movement that is identified using a series of  trendlines  and/or curves. When a price pattern signals a change in trend direction, it is known as a reversal pattern; a continuation pattern occurs when the trend continues in its existing direction following a brief pause. Advanced Chart Pattern Tracker is designed to find the MOST ACCURATE patterns. A special script is a
This indicators automatically draws the Support and resistances levels for you once you've dropped it on a chart.  It reduces the hustle of drawing and redrawing these levels every time you analysis prices on a chart. With it, all you have to do is dropped it on a chart, adjust the settings to your liking and let the indicator do the rest.  But wait, it gets better; the indicator is absolutely free!  Get the new and improved version here:  https://youtu.be/rTxbPOBu3nY Parameters Time-frame  -> T
FREE
Special offer : ALL TOOLS , just $35 each! New tools   will be   $30   for the   first week   or the   first 3 purchases !  Trading Tools Channel on MQL5 : Join my MQL5 channel to update the latest news from me Maximiza tu ventaja comercial con Follow Line con escáner, un indicador avanzado basado en la volatilidad diseñado para traders serios. Esta herramienta combina el poder de las Bandas de Bollinger con configuraciones personalizables, ofreciendo información precisa sobre los movimientos d
FREE
Indicador Crypto_Forex "Patrón del hombre colgado" para MT4. - El indicador "Patrón del hombre colgado" es un indicador muy potente para el trading de acción del precio: sin repintado, sin demora. - El indicador detecta patrones bajistas del hombre colgado en el gráfico: señal de flecha roja en el gráfico (ver imágenes). - Con alertas para PC, móvil y correo electrónico. - El indicador "Patrón del hombre colgado" es excelente para combinar con niveles de soporte/resistencia. // Excelentes rob
Introduction Harmonic Patterns are best used to predict potential turning point. Traditionally, Harmonic Pattern was identified manually connecting peaks and troughs points in the chart. Manual harmonic pattern detection is painfully tedious and not suitable for everyone. You are often exposed under subjective pattern identification with manual pattern detection. To avoid these limitations, Harmonic Pattern Plus was designed to automate your harmonic pattern detection process. The functionality
This indicator filters the Zigzag indicator to calculate the main support and resistance levels. Variables minimum gap between peaks : is the distance (GAP) between the peaks of the Zigzag peaks sensitivity : Minimum number of nearby peaks look back: it means that it has to test the last 50 peaks in the Zigzag object name perfix: a prefix for level’s line name on chart
FREE
Description: The indicator measures, through the zigzag indicator, the levels of trend or correction. It shows in the chart the levels of each low or high detected. KEY LINKS:   How to Install  –  Frequent Questions  -  All Products  How is this indicator useful? This indicator determines, depending on Zigzag parameter if a trend is beginning, developing, or ending This indicator determines the direction of the trend Components Levels as positive or negative numbers, depending on the direction
FREE
The Penta-O is a 6-point retracement harmonacci pattern which usually precedes big market movements. Penta-O patterns can expand and repaint quite a bit. To make things easier this indicator implements a twist: it waits for a donchian breakout in the right direction before signaling the trade. The end result is an otherwise repainting indicator with a very reliable trading signal. The donchian breakout period is entered as an input. [ Installation Guide | Update Guide | Troubleshooting | FAQ | A
Este indicador le dibujará los siguientes niveles: Línea abierta diaria: abajo está el mercado bajista, arriba está el mercado alcista. Rango diario promedio alto y bajo Altos y bajos del mercado asiático Los altos y bajos de ayer Estos niveles son fuertes niveles de soporte y resistencia a los que todos deben prestar atención. ¡Si no aprovechaste el tiempo para empezar! ¡Debes prestar atención cuando el precio se acerque a estos niveles! ¡Disfrute del comercio de forma más fácil!
FREE
Swing Reader
Francesco Rubeo
5 (1)
Read Elliott wave principle automatically. With the Swing Reader, you can easily read the Elliott Wave Principle through an automatic system. With swing, we mean a ZigZag market that is created by a breakout of its standard deviation. You can set the deviation manually, or you can let the indicator do it automatically (setting the deviation to zero). Advantages you get Never repaints. Points showing a horizontal line, in which statistically a long wave ends. Candles showing a vertical line in
Auto Andrews Pitchfork indicator MT4 The Auto Andrews Pitchfork indicator MT4 is a technical analysis utility developed for MetaTrader 4 that identifies dynamic support and resistance zones based on price swings. This tool integrates well with MACD and determines three recent pivot points to draw a trio of parallel lines forming a pitchfork shape. The central median line of the pitchfork is a crucial level—acting as either a potential reversal points or confirming a trend continuation when breac
FREE
Elliott Wave Trend was designed for the scientific wave counting. This tool focuses to get rid of the vagueness of the classic Elliott Wave Counting using the guideline from the template and pattern approach. In doing so, firstly Elliott Wave Trend offers the template for your wave counting. Secondly, it offers Wave Structural Score to assist to identify accurate wave formation. It offers both impulse wave Structural Score and corrective wave Structure Score. Structural Score is the rating to sh
Special offer : ALL TOOLS , just $35 each! New tools   will be   $30   for the   first week   or the   first 3 purchases !  Trading Tools Channel on MQL5 : Join my MQL5 channel to update the latest news from me Trendlines with Breaks Scanner es una herramienta de trading de última generación diseñada para ayudar a los traders a identificar tendencias críticas y detectar rupturas en tiempo real. Con líneas de tendencia generadas automáticamente basadas en puntos de pivote, este indicador permite
This indicator Super Channel Pro indicator.Indicator displays trend movement. Indicator calculates automatically line. Features FiltPer - displays indicator channel period. deviation - displays indicator channel deviation. deviation2 - displays indicator channel deviation. How to understand the status: If the arrow is green, trend is up. If the arrow is red, trend is down. ///////////////////////////////////////////////////////////////////////////////////////////////////////////////////////////
Liquidity Pools MT4
Duc Hoan Nguyen
5 (1)
Special offer : ALL TOOLS , just $35 each! New tools   will be   $30   for the   first week   or the   first 3 purchases !  Trading Tools Channel on MQL5 : Join my MQL5 channel to update the latest news from me El indicador Liquidity Pools es una herramienta avanzada que identifica y marca zonas de liquidez potenciales en el gráfico al analizar áreas altas y bajas con frecuentes toques de mecha, junto con el número de revisitas y el volumen negociado dentro de cada zona. Esta herramienta propor
CyberZingFx Volume Plus
Afsal Meerankutty
4.93 (15)
Advanced version of CyberZingFx Volume Plus, the ultimate MT4 indicator for traders seeking highly accurate buy and sell signals. With an additional strategy and price action dot signals that enhances its effectiveness, this indicator offers a superior trading experience for professionals and beginners alike. The CyberZingFx Volume Plus Advanced version combines the power of volume analysis and historical price data with an additional strategy, resulting in even more precise and reliable signals
Pivot levels Auto V1
Hafis Mohamed Yacine
What Is a Pivot Point? A pivot point is a technical analysis indicator, or calculations, used to determine the overall trend of the market over different time frames. The pivot point itself is simply the average of the intraday high and low, and the closing price from the previous trading day. On the subsequent day, trading above the pivot point is thought to indicate ongoing bullish sentiment, while trading below the pivot point indicates bearish sentimen How to Use Pivot Points The very ess
Auto Levels
Yaroslav Varankin
Auto Level this tool is able to determine the levels of support and resistance. search and display when the price has broken through the level and when it pushed off from it. the indicator can be useful if you use resistance support levels in your trading. or the highs and lows of the price, then it will greatly simplify your work and help you more quickly and more accurately determine the rebound or breakdown of the current trend or tendencies level. blue line bottom uptrend red line on top dow
El asesor Smart Martin automatiza una estrategia de trading basada en niveles de soporte y resistencia para EURUSD (marco temporal H1). Características principales: Entrada precisa basada en ruptura/rebote de niveles. Gestión de riesgo estricta: Stop Loss y Take Profit fijos. Filtrado de señales falsas mediante análisis de volatilidad. Detalles de la estrategia Reglas de entrada Los niveles se construyen en base al análisis técnico del precio. Reglas de salida Stop Loss: 200 puntos desde el ni
Limit Levels AM
Andriy Matviyevs'kyy
The presented indicator sets dynamic support/resistance levels on the price chart. The support/resistance levels set by the indicator are reasonable levels for setting pending orders. The middle line of the indicator (Central level) helps to identify the current trend: If the closing price is above the central line - the trend is ascending. If the closing price is below the central line - the trend is descending. The indicator is easy to use and can be useful for both beginners and professional
FREE
Los compradores de este producto también adquieren
Cycle Maestro
Stefano Frisetti
NOTE: CYCLEMAESTRO is distributed only on this website, there are no other distributors. Demo version is for reference only and is not supported. Full versione is perfectly functional and it is supported CYCLEMAESTRO , the first and only indicator of Cyclic Analysis, useful for giving signals of TRADING, BUY, SELL, STOP LOSS, ADDING. Created on the logic of Serghei Istrati and programmed by Stefano Frisetti ; CYCLEMAESTRO is not an indicator like the others, the challenge was to interpret only t
Gann Made Easy
Oleg Rodin
4.81 (120)
Gann Made Easy es un sistema de comercio de Forex profesional y fácil de usar que se basa en los mejores principios de comercio utilizando la teoría del Sr. W. D. Gann. El indicador proporciona señales precisas de COMPRA y VENTA, incluidos los niveles de Stop Loss y Take Profit. Puede comerciar incluso sobre la marcha utilizando notificaciones PUSH. ¡Por favor, póngase en contacto conmigo después de la compra! ¡Compartiré mis consejos comerciales con usted y excelentes indicadores de bonificació
Trend Screener
STE S.S.COMPANY
4.78 (93)
Indicador de tendencia, solución única e innovadora para el comercio y filtrado de tendencias con todas las funciones de tendencias importantes integradas en una sola herramienta. Es un indicador 100% sin repintar de marcos temporales y monedas múltiples que se puede usar en todos los símbolos/instrumentos: divisas, materias primas, criptomonedas, índices y acciones. OFERTA POR TIEMPO LIMITADO: El indicador de detección de soporte y resistencia está disponible por solo 50$ y de por vida. (Precio
Gold Stuff
Vasiliy Strukov
4.86 (259)
Gold Stuff: un indicador de tendencia diseñado específicamente para el oro, también se puede usar en cualquier instrumento financiero. El indicador no se vuelve a dibujar ni se retrasa. El marco de tiempo recomendado es H1. Este indicador está escrito por EA Gold Stuff Advisor, puede encontrarlo en mi perfil.  Puede obtener una copia gratuita de nuestro indicador Strong Support y Trend Scanner, por favor envíe un mensaje privado. ¡a mí! IMPORTANTE! Póngase en contacto conmigo inmediatamente de
FX Volume
Daniel Stein
4.6 (35)
FX Volume: Experimente el Verdadero Sentimiento del Mercado desde la Perspectiva de un Bróker Resumen Rápido ¿Desea llevar su estrategia de trading a otro nivel? FX Volume ofrece información en tiempo real sobre cómo los traders minoristas y los brókers están posicionados, mucho antes de que aparezcan informes retrasados como el COT. Ya sea que busque beneficios consistentes o simplemente quiera una ventaja más profunda en los mercados, FX Volume le ayuda a identificar desequilibrios important
Algo Pumping MT4
Ihor Otkydach
5 (7)
PUMPING STATION – Tu estrategia personal "todo incluido" Te presentamos PUMPING STATION, un indicador revolucionario para Forex que transformará tu forma de operar en una experiencia emocionante y eficaz. No es solo un asistente, sino un sistema de trading completo con potentes algoritmos que te ayudarán a operar de forma más estable. Al comprar este producto, recibes GRATIS: Archivos de configuración exclusivos: para una configuración automática y un rendimiento óptimo. Manual en video paso a p
Scalper Inside PRO
Alexey Minkov
4.77 (64)
!SPECIAL SALE! An exclusive indicator that utilizes an innovative algorithm to swiftly and accurately determine the market trend. The indicator automatically calculates opening, closing, and profit levels, providing detailed trading statistics. With these features, you can choose the most appropriate trading instrument for the current market conditions. Additionally, you can easily integrate your own arrow indicators into Scalper Inside Pro to quickly evaluate their statistics and profitability
TrendMaestro
Stefano Frisetti
4 (4)
note: this indicator is for METATRADER4, if you want the version for METATRADER5 this is the link:  https://www.mql5.com/it/market/product/108106 TRENDMAESTRO ver 2.4 TRENDMAESTRO recognizes a new TREND in the bud, he never makes mistakes. The certainty of identifying a new TREND is priceless. DESCRIPTION TRENDMAESTRO identifies a new TREND in the bud, this indicator examines the volatility, volumes and momentum to identify the moment in which there is an explosion of one or more of these data a
M1 Arrow
Oleg Rodin
5 (17)
Una estrategia intradía basada en dos principios fundamentales del mercado. El algoritmo se basa en el análisis de volúmenes y ondas de precios utilizando filtros adicionales. El algoritmo inteligente del indicador da una señal solo cuando dos factores de mercado se combinan en uno. El indicador calcula ondas de cierto rango en el gráfico M1 utilizando los datos del marco de tiempo más alto. Y para confirmar la onda, el indicador utiliza el análisis por volumen. Este indicador es un sistema come
Stratos Pali
Michela Russo
5 (3)
Stratos Pali Indicator   is a revolutionary tool designed to enhance your trading strategy by accurately identifying market trends. This sophisticated indicator uses a unique algorithm to generate a complete histogram, which records when the trend is Long or Short. When a trend reversal occurs, an arrow appears, indicating the new direction of the trend. Important Information Revealed Leave a review and contact me via mql5 message to receive My Top 5 set files for Stratos Pali at no cost! Dow
System Trend Pro
Aleksandr Makarov
5 (2)
Special offer! https://www.mql5.com/ru/users/bossik2810 System Trend Pro - This is the best trend trading indicator!!! The indicator no repaint!!!  The indicator has   MTF   mode, which adds confidence to trading on the trend (   no repaint   ). How to trade? Everything is very simple, we wait for the first signal (big arrow), then wait for the second signal (small arrow) and enter the market in the direction of the arrow. (See screens 1 and 2.) Exit on the opposite signal or take 20-30 pips,
Currency Strength Exotics
Bernhard Schweigert
4.88 (32)
¡ACTUALMENTE 20% DE DESCUENTO ! ¡La mejor solución para cualquier operador novato o experto! Este indicador está especializado en mostrar la fuerza de la divisa para cualquier símbolo como Pares Exóticos, Materias Primas, Índices o Futuros. Es el primero de su clase, cualquier símbolo se puede añadir a la 9 ª línea para mostrar la verdadera fuerza de la moneda de Oro, Plata, Petróleo, DAX, US30, MXN, TRY, CNH etc. Se trata de una herramienta de trading única, de alta calidad y asequible porqu
¡Actualmente 20% OFF ! ¡La mejor solución para cualquier novato o trader experto! Este software funciona con 28 pares de divisas. Se basa en 2 de nuestros principales indicadores (Advanced Currency Strength 28 y Advanced Currency Impulse). Proporciona una gran visión general de todo el mercado de divisas. Muestra los valores de Advanced Currency Strength, la velocidad de movimiento de las divisas y las señales para 28 pares de divisas en todos los (9) marcos temporales. Imagine cómo mejorará
GOLD Impulse with Alert
Bernhard Schweigert
4.6 (10)
Este indicador es una super combinación de nuestros 2 productos Advanced Currency IMPULSE with ALERT  +   Currency Strength Exotics . ¡Funciona para todos los marcos de tiempo y muestra gráficamente el impulso de fuerza o debilidad para las 8 divisas principales más un Símbolo! Este Indicador está especializado en mostrar la aceleración de la fuerza de la divisa para cualquier símbolo como Oro, Pares Exóticos, Materias Primas, Índices o Futuros. Es el primero de su clase, cualquier símbolo p
Easy Breakout
Mohamed Hassan
5 (12)
After your purchase, feel free to contact me for more details on how to receive a bonus indicator called VFI, which pairs perfectly with Easy Breakout for enhanced confluence!   Easy Breakout is a powerful price action trading system built on one of the most popular and widely trusted strategies among traders: the Breakout strategy ! This indicator delivers crystal-clear Buy and Sell signals based on breakouts from key support and resistance zones. Unlike typical breakout indicators, it levera
Trend Arrow Super
Aleksandr Makarov
5 (2)
Special offer! https://www.mql5.com/ru/users/bossik2810 Trend Arrow Super The indicator not repaint or change its data. A professional, yet very easy to use Forex system. The indicator gives accurate BUY\SELL signals. Trend Arrow Super is very easy to use, you just need to attach it to the chart and follow simple trading recommendations. Buy signal: Arrow + Histogram in green color, enter immediately on the market to buy. Sell signal: Arrow + Histogram of red color, enter immediately on the m
StalkeR Arrow
Abdulkarim Karazon
5 (3)
StalkeR Arrow es un indicador de flecha que proporciona señales de compra y venta en la barra abierta/intrabarra, este indicador se basa en patrones de acción del precio y fractales. este indicador proporciona tp y sl para cada señal de compra y venta, tp y sl están en forma de líneas encima y debajo de cada señal, se extienden hasta que se forma una nueva señal Este indicador tiene un panel de backtesting que brinda estadísticas de ganancias/pérdidas de las señales históricas. Este indicador
Golden Trend Indicator
Noha Mohamed Fathy Younes Badr
5 (10)
Golden Trend indicator  is The best indicator for predicting trend movement this indicator never lags and never repaints and never back paints    and give  arrow buy and sell    before the candle appear  and it will help you and  will make your trading decisions clearer its work on all currencies and  gold and crypto and all time frame This unique  indicator uses very secret algorithms to catch the  trends, so you can trade using this indicator and see the trend clear on charts  manual guide and
Dynamic Forex28 Navigator
Bernhard Schweigert
5 (5)
Dynamic Forex28 Navigator: la herramienta de trading de Forex de última generación. ACTUALMENTE CON UN 49 % DE DESCUENTO. Dynamic Forex28 Navigator es la evolución de nuestros indicadores populares de larga data, que combina el poder de tres en uno: Indicador avanzado Currency Strength28 (695 reseñas) + Indicador avanzado Currency IMPULSE con ALERT (520 reseñas) + Señales combinadas CS28 (bonificación). Detalles sobre el indicador https://www.mql5.com/en/blogs/post/758844 ¿Qué ofrece el indi
FX Power MT4 NG
Daniel Stein
4.94 (18)
FX Power: Analiza la Fuerza de las Divisas para Decisiones de Trading Más Inteligentes Descripción General FX Power es tu herramienta esencial para comprender la fuerza real de las principales divisas y el oro en cualquier condición de mercado. Al identificar divisas fuertes para comprar y débiles para vender, FX Power simplifica las decisiones de trading y descubre oportunidades de alta probabilidad. Ya sea que quieras seguir las tendencias o anticipar reversiones utilizando valores extremos
TPSproTREND PrO
Roman Podpora
4.68 (25)
VERSION MT5        —        ИНСТРУКЦИЯ RUS           —        INSTRUCTIONS  ENG Funciones principales: Señales de entrada precisas ¡SIN RENDERIZACIÓN! Si aparece una señal, ¡sigue siendo relevante! Esta es una diferencia importante con respecto a los indicadores de redibujo, que pueden proporcionar una señal y luego cambiarla, lo que puede provocar una pérdida de fondos depositados. Ahora puedes ingresar al mercado con mayor probabilidad y precisión. También existe la función de colorear las ve
Currency Strength Wizard es un indicador muy poderoso que le proporciona una solución todo en uno para operar con éxito. El indicador calcula el poder de este o aquel par de divisas utilizando los datos de todas las monedas en múltiples marcos de tiempo. Estos datos se representan en forma de índice de moneda fácil de usar y líneas eléctricas de moneda que puede usar para ver el poder de esta o aquella moneda. Todo lo que necesita es adjuntar el indicador al gráfico que desea operar y el indicad
Advanced Supply Demand
Bernhard Schweigert
4.91 (294)
¡Actualmente con 33% de descuento! ¡La mejor solución para cualquier tráder principiante o experto! Este indicador es una herramienta comercial única, de alta calidad y asequible, porque incorpora una serie de características patentadas y una nueva fórmula. Con esta actualización, podrá mostrar zonas de doble marco temporal. No solo podrá mostrar un marco temporal más alto, sino también mostrar ambos, el marco temporal del gráfico MÁS el marco temporal más alto: MOSTRANDO ZONAS ANIDADAS. A todos
TPSpro RFI Levels
Roman Podpora
4.85 (27)
Zonas de reversión / Volúmenes máximos / Zonas activas de un jugador importante =       SISTEMA TS TPSPRO INSTRUCCIONES RUS       /       INSTRUCCIONES       ESP       /       Version MT5 Cada comprador de este indicador recibe adicionalmente GRATIS: 6 meses de acceso a señales comerciales del servicio RFI SIGNALS: puntos de entrada listos para usar según el algoritmo TPSproSYSTEM. Materiales de formación con actualizaciones periódicas: sumérgete en la estrategia y haz crecer tu nivel profesio
Scalper Vault
Oleg Rodin
5 (30)
Scalper Vault es un sistema profesional de reventa que le brinda todo lo que necesita para una reventa exitosa. Este indicador es un sistema comercial completo que puede ser utilizado por operadores de divisas y opciones binarias. El marco de tiempo recomendado es M5. El sistema le proporciona señales de flecha precisas en la dirección de la tendencia. También le proporciona señales superiores e inferiores y niveles de mercado de Gann. Los indicadores proporcionan todo tipo de alertas, incluidas
Hit Rate Top Bottom Signal
Martin Alejandro Bamonte
Hit Rate Top Bottom Signal Hit Rate Top Bottom Signal ofrece un enfoque totalmente innovador. Es ideal para quienes buscan evaluar de antemano cómo funciona la señal con un TP-SL específico, y en qué PARES/TF tiene mejores desempeños. La estrategia Hit Rate Top Bottom Signal es una herramienta fundamental para cualquier trader y tipo de trading porque no solo emite señales precisas sin repintar , indicando claramente cuándo operar y en qué dirección, sino que además lleva un registro detallado
Introduciendo       Indicador Quantum Trend Sniper   , el innovador indicador MQL5 que está transformando la forma en que identificas y negocias los cambios de tendencia. Desarrollado por un equipo de comerciantes experimentados con experiencia comercial de más de 13 años,       Indicador de francotirador de tendencia cuántica       está diseñado para impulsar su viaje comercial a nuevas alturas con su forma innovadora de identificar cambios de tendencia con una precisión extremadamente alta. *
Reversal Master
Alexey Minkov
4.92 (13)
!SPECIAL SALE! The Reversal Master is an indicator for determining the current direction of price movement and reversal points. The indicator will be useful for those who want to see the current market situation better. The indicator can be used as an add-on for ready-made trading systems, or as an independent tool, or to develop your own trading systems. The Reversal Master indicator, to determine the reversal points,  analyzes a lot of conditions since the combined analysis gives a more accura
IQ FX Gann Levels a precision trading indicator based on W.D. Gann’s square root methods. It plots real-time, non-repainting support and resistance levels to help traders confidently spot intraday and scalping opportunities with high accuracy. William Delbert Gann (W.D. Gann) was an exceptional market analyst, whose trading technique was based on a complex blend of mathematics, geometry, astrology, and ancient mathematics which proved to be extremely accurate. Download the Metatrader 5 Version M
- Real price is 80$ - 40% Discount (It is 49$ now) - Lifetime update free Contact me for instruction, add group and any questions! Related Products:  Bitcoin Expert , Gold Expert - Non-repaint - I just sell my products in Elif Kaya profile, any other websites are stolen old versions, So no any new updates or support. Introduction The breakout and retest strategy is traded support and resistance levels. it involves price breaking through a previous level.  The break and retest strategy is design
Otros productos de este autor
Special offer : ALL TOOLS , just $35 each! New tools   will be   $30   for the   first week   or the   first 3 purchases !  Trading Tools Channel on MQL5 : Join my MQL5 channel to update the latest news from me Comencemos con las características destacadas: El EA está equipado con un FILTRO DE NOTICIAS y un FILTRO RSI. Riesgo bajo (algunos pares de divisas tienen un DrawDown de <10%, incluso 5%). Este EA no utiliza ninguna función de martingala o cuadrícula. El EA puede mostrar zonas visuales p
Special offer : ALL TOOLS , just $35 each! New tools   will be   $30   for the   first week   or the   first 3 purchases !  Trading Tools Channel on MQL5 : Join my MQL5 channel to update the latest news from me ¡Descubre el poder del concepto de Inversion Fair Value Gap (IFVG) de ICT con el Inversion Fair Value Gaps Indicator ! Esta herramienta de última generación lleva los Fair Value Gaps (FVG) al siguiente nivel al identificar y mostrar zonas de FVG invertidas, que son áreas clave de soporte
Special offer : ALL TOOLS , just $35 each! New tools   will be   $30   for the   first week   or the   first 3 purchases !  Trading Tools Channel on MQL5 : Join my MQL5 channel to update the latest news from me El indicador Supertrend Fakeout es una versión mejorada del clásico indicador Supertrend , diseñado para ofrecer señales de tendencia más fiables. Al incorporar características avanzadas como Fakeout Index Limit y Fakeout ATR Mult , este indicador ayuda a filtrar las falsas inversiones d
FREE
Special offer : ALL TOOLS , just $35 each! New tools   will be   $30   for the   first week   or the   first 3 purchases !  Trading Tools Channel on MQL5 : Join my MQL5 channel to update the latest news from me ¡Descubre el poder del concepto de Inversion Fair Value Gap (IFVG) de ICT con el Inversion Fair Value Gaps Indicator ! Esta herramienta de última generación lleva los Fair Value Gaps (FVG) al siguiente nivel al identificar y mostrar zonas de FVG invertidas, que son áreas clave de soporte
Special offer : ALL TOOLS , just $35 each! New tools   will be   $30   for the   first week   or the   first 3 purchases !  Trading Tools Channel on MQL5 : Join my MQL5 channel to update the latest news from me El Indicador de Patrón de Reversión de Tres Barras ofrece una herramienta poderosa para los traders, identificando y destacando automáticamente patrones de reversión de tres barras directamente en el gráfico de precios. Este indicador es un recurso valioso para detectar posibles reversio
Special offer : ALL TOOLS , just $35 each! New tools   will be   $30   for the   first week   or the   first 3 purchases !  Trading Tools Channel on MQL5 : Join my MQL5 channel to update the latest news from me I. Introducción Market Structure Trend Targets Scanner es una herramienta poderosa para analizar tendencias del mercado, identificar puntos de ruptura y gestionar riesgos mediante un stop loss dinámico. Al rastrear máximos y mínimos anteriores para detectar rupturas, esta herramienta ay
Special offer : ALL TOOLS , just $35 each! New tools   will be   $30   for the   first week   or the   first 3 purchases !  Trading Tools Channel on MQL5 : Join my MQL5 channel to update the latest news from me Presentamos SuperTrend ATR Multiplier with Scanner for MT5 – una herramienta versátil y poderosa diseñada para ayudarte a estar siempre un paso adelante de las tendencias del mercado, con funciones personalizables y alertas en tiempo real. Siguiendo la lógica confiable de SuperTrend de K
FREE
SMC System MT4
Duc Hoan Nguyen
5 (1)
Special offer : ALL TOOLS , just $35 each! New tools   will be   $30   for the   first week   or the   first 3 purchases !  Trading Tools Channel on MQL5 : Join my MQL5 channel to update the latest news from me SMC es un enfoque de trading que ayuda a los traders a identificar zonas de liquidez, posiciones de órdenes institucionales y puntos clave de giro del mercado. Al aprovechar los principios de SMC, los traders pueden navegar por el mercado de manera más efectiva, encontrando entradas y sa
Volumatic VIDyA MT5
Duc Hoan Nguyen
5 (2)
Special offer : ALL TOOLS , just $35 each! New tools   will be   $30   for the   first week   or the   first 3 purchases !  Trading Tools Channel on MQL5 : Join my MQL5 channel to update the latest news from me Volumatic VIDYA (Variable Index Dynamic Average) es un indicador avanzado diseñado para rastrear tendencias y analizar la presión de compra-venta en cada fase de una tendencia. Utilizando el Promedio Dinámico de Índice Variable (Variable Index Dynamic Average) como técnica principal de s
Special offer : ALL TOOLS , just $35 each! New tools   will be   $30   for the   first week   or the   first 3 purchases !  Trading Tools Channel on MQL5 : Join my MQL5 channel to update the latest news from me Maximiza tu ventaja comercial con Follow Line MT5 con escáner, un indicador avanzado basado en la volatilidad diseñado para traders serios. Esta herramienta combina el poder de las Bandas de Bollinger con configuraciones personalizables, ofreciendo información precisa sobre los movimient
FREE
Special offer : ALL TOOLS , just $35 each! New tools   will be   $30   for the   first week   or the   first 3 purchases !  Trading Tools Channel on MQL5 : Join my MQL5 channel to update the latest news from me I. Introducción Market Structure Trend Targets Scanner es una herramienta poderosa para analizar tendencias del mercado, identificar puntos de ruptura y gestionar riesgos mediante un stop loss dinámico. Al rastrear máximos y mínimos anteriores para detectar rupturas, esta herramienta ay
Special offer : ALL TOOLS , just $35 each! New tools   will be   $30   for the   first week   or the   first 3 purchases !  Trading Tools Channel on MQL5 : Join my MQL5 channel to update the latest news from me El indicador Volumetric Order Blocks Multi Timeframe es una herramienta poderosa diseñada para traders que buscan una comprensión más profunda del comportamiento del mercado al identificar áreas clave de precios donde los principales participantes del mercado acumulan órdenes. Estas área
Special offer : ALL TOOLS , just $35 each! New tools   will be   $30   for the   first week   or the   first 3 purchases !  Trading Tools Channel on MQL5 : Join my MQL5 channel to update the latest news from me SMC es un enfoque de trading que ayuda a los traders a identificar zonas de liquidez, posiciones de órdenes institucionales y puntos clave de giro del mercado. Al aprovechar los principios de SMC, los traders pueden navegar por el mercado de manera más efectiva, encontrando entradas y sa
Special offer : ALL TOOLS , just $35 each! New tools   will be   $30   for the   first week   or the   first 3 purchases !  Trading Tools Channel on MQL5 : Join my MQL5 channel to update the latest news from me El indicador Volumetric Order Blocks Multi Timeframe es una herramienta poderosa diseñada para traders que buscan una comprensión más profunda del comportamiento del mercado al identificar áreas clave de precios donde los principales participantes del mercado acumulan órdenes. Estas área
Oferta especial : ALL TOOLS , ¡solo $35 cada uno! New tools   will be   $30   for the   first week   or the   first 3 purchases !  Trading Tools Channel on MQL5 : Join my MQL5 channel to update the latest news from me En un entorno de trading volátil, una herramienta de análisis potente e intuitiva puede ayudarte a aprovechar las oportunidades rápidamente. Fibonacci Trend Scanner no solo integra las funciones tradicionales del indicador de Fibonacci y SuperTrend, sino que también amplía la func
Special offer : ALL TOOLS , just $35 each! New tools   will be   $30   for the   first week   or the   first 3 purchases !  Trading Tools Channel on MQL5 : Join my MQL5 channel to update the latest news from me Kalman Trend Levels es un indicador avanzado de seguimiento de tendencias que utiliza la tecnología de filtro de Kalman de vanguardia para proporcionar a los traders potentes señales analíticas. Diseñado para ser preciso y adaptable, esta herramienta no solo identifica zonas críticas de
Special offer : ALL TOOLS , just $35 each! New tools   will be   $30   for the   first week   or the   first 3 purchases !  Trading Tools Channel on MQL5 : Join my MQL5 channel to update the latest news from me En el siempre cambiante panorama del comercio financiero, identificar y analizar con precisión los niveles de soporte y resistencia es esencial para tomar decisiones de inversión informadas. SnR Retest and Break Multi-Timeframe es un indicador de soporte y resistencia diseñado para mejor
Special offer : ALL TOOLS , just $35 each! New tools   will be   $30   for the   first week   or the   first 3 purchases !  Trading Tools Channel on MQL5 : Join my MQL5 channel to update the latest news from me Presentamos el revolucionario RSI Kernel Optimized with Scanner, una herramienta de vanguardia que redefine el análisis tradicional de RSI al integrar el poderoso algoritmo de Estimación de Densidad de Núcleo (KDE). Este avanzado indicador no solo proporciona información en tiempo real s
Special offer : ALL TOOLS , just $35 each! New tools   will be   $30   for the   first week   or the   first 3 purchases !  Trading Tools Channel on MQL5 : Join my MQL5 channel to update the latest news from me El Indicador de Patrón de Reversión de Tres Barras ofrece una herramienta poderosa para los traders, identificando y destacando automáticamente patrones de reversión de tres barras directamente en el gráfico de precios. Este indicador es un recurso valioso para detectar posibles reversio
Special offer : ALL TOOLS , just $35 each! New tools   will be   $30   for the   first week   or the   first 3 purchases !  Trading Tools Channel on MQL5 : Join my MQL5 channel to update the latest news from me El indicador Liquidity Pools es una herramienta avanzada que identifica y marca zonas de liquidez potenciales en el gráfico al analizar áreas altas y bajas con frecuentes toques de mecha, junto con el número de revisitas y el volumen negociado dentro de cada zona. Esta herramienta propor
Supertrend Fakeout MT4
Duc Hoan Nguyen
4.5 (2)
Special offer : ALL TOOLS , just $35 each! New tools   will be   $30   for the   first week   or the   first 3 purchases !  Trading Tools Channel on MQL5 : Join my MQL5 channel to update the latest news from me El indicador Supertrend Fakeout es una versión mejorada del clásico indicador Supertrend , diseñado para ofrecer señales de tendencia más fiables. Al incorporar características avanzadas como Fakeout Index Limit y Fakeout ATR Mult , este indicador ayuda a filtrar las falsas inversiones d
FREE
Special offer : ALL TOOLS , just $35 each! New tools   will be   $30   for the   first week   or the   first 3 purchases !  Trading Tools Channel on MQL5 : Join my MQL5 channel to update the latest news from me El Fibonacci Confluence Toolkit Multi-Timeframe es una herramienta avanzada de análisis técnico diseñada para traders profesionales, que ayuda a identificar zonas potenciales de reversión de precios al combinar señales y patrones clave del mercado. Con capacidades de visualización de múl
Special offer : ALL TOOLS , just $35 each! New tools   will be   $30   for the   first week   or the   first 3 purchases !  Trading Tools Channel on MQL5 : Join my MQL5 channel to update the latest news from me Descripción general OA SnR Power es una herramienta poderosa diseñada para ayudar a los traders a identificar y evaluar la fortaleza de los niveles de soporte y resistencia. Al incorporar factores clave como el volumen de operaciones, la frecuencia de rebote y el recuento de pruebas, es
FREE
Special offer : ALL TOOLS , just $35 each! New tools   will be   $30   for the   first week   or the   first 3 purchases !  Trading Tools Channel on MQL5 : Join my MQL5 channel to update the latest news from me El indicador Zero Lag MA Trend Levels MT5 con escáner combina la media móvil de cero retraso (ZLMA) con una media móvil exponencial estándar (EMA), brindando a los traders una visión completa del impulso del mercado y los niveles clave de precios. Además, las funciones de escáner y alert
Special offer : ALL TOOLS , just $35 each! New tools   will be   $30   for the   first week   or the   first 3 purchases !  Trading Tools Channel on MQL5 : Join my MQL5 channel to update the latest news from me El Fibonacci Confluence Toolkit Multi-Timeframe es una herramienta avanzada de análisis técnico diseñada para traders profesionales, que ayuda a identificar zonas potenciales de reversión de precios al combinar señales y patrones clave del mercado. Con capacidades de visualización de múl
Special offer : ALL TOOLS , just $35 each! New tools   will be   $30   for the   first week   or the   first 3 purchases !  Trading Tools Channel on MQL5 : Join my MQL5 channel to update the latest news from me En el volátil panorama de la negociación financiera actual, identificar con precisión los niveles de soporte y resistencia es fundamental para que los traders tomen decisiones informadas. Predictive Ranges Scanner Multi-TF es una herramienta avanzada diseñada para ayudar a los traders a
Special offer : ALL TOOLS , just $35 each! New tools   will be   $30   for the   first week   or the   first 3 purchases !  Trading Tools Channel on MQL5 : Join my MQL5 channel to update the latest news from me Descubre el poder de la IA con el SuperTrend AI Clustering MT5 con escáner , una herramienta revolucionaria para MetaTrader 5 (MT5). Este indicador redefine el análisis del mercado combinando el agrupamiento K-means con el popular indicador SuperTrend, brindando a los traders una ventaja
Special offer : ALL TOOLS , just $35 each! New tools   will be   $30   for the   first week   or the   first 3 purchases !  Trading Tools Channel on MQL5 : Join my MQL5 channel to update the latest news from me Presentamos el revolucionario RSI Kernel Optimized with Scanner para MT5, una herramienta de vanguardia que redefine el análisis tradicional de RSI al integrar el poderoso algoritmo de Estimación de Densidad de Núcleo (KDE). Este avanzado indicador no solo proporciona información en tiem
Special offer : ALL TOOLS , just $35 each! New tools   will be   $30   for the   first week   or the   first 3 purchases !  Trading Tools Channel on MQL5 : Join my MQL5 channel to update the latest news from me Trendlines with Breaks Scanner es una herramienta de trading de última generación diseñada para ayudar a los traders a identificar tendencias críticas y detectar rupturas en tiempo real. Con líneas de tendencia generadas automáticamente basadas en puntos de pivote, este indicador permite
Special offer : ALL TOOLS , just $35 each! New tools   will be   $30   for the   first week   or the   first 3 purchases !  Trading Tools Channel on MQL5 : Join my MQL5 channel to update the latest news from me Descubra el poder del aprendizaje automático avanzado con el Machine Learning Adaptive SuperTrend , un indicador de vanguardia diseñado para adaptarse sin problemas a las condiciones cambiantes del mercado. Al integrar la agrupación en clústeres de k-medias con la metodología SuperTrend,
Filtro:
jabautista
3801
jabautista 2025.03.24 19:48 
 

Solid indicator. Developer is very open suggestions and has great customer service!

Nikodem Dobrzynski
277
Nikodem Dobrzynski 2025.01.24 18:22 
 

Volumatic VIDyA is a very useful indicator that combines both trend and volume indications. When combined with other technical analysis indicators, it can be a great tool in your strategy. Niko.

XANKEEZ
469
XANKEEZ 2025.01.03 09:42 
 

VIDYA is a unique indicator that combines trend and volume analysis. for best results, use it with other indicators like RSI or ADX. the author keeps updating and making it better each time.

Duc Hoan Nguyen
28162
Respuesta del desarrollador Duc Hoan Nguyen 2025.01.03 15:30
Thank you for your review!
Glad to hear the indicator is working well for you when combined with others.
Appreciate your recognition of the updates, and wishing you continued success!
Respuesta al comentario
Versión 2.11 2025.02.27
Optimized dashboard algorithm
Versión 2.1 2025.01.17
Add input parameter to show/hide smoothed line
Versión 2.0 2024.12.31
- Optimized the algorithm to make the indicator a little faster.
- Improved user experience with the dashboard.
- Added the feature to hide/show indicator on the current chart.
Versión 1.10 2024.12.18
Added SCANNER to the indicator, helping users easily track trends and delta volume of multiple currency pairs and multiple time frames