ADX Signal AM
- Indicadores
- Andriy Matviyevs'kyy
- Versión: 27.0
- Actualizado: 15 septiembre 2024
- Activaciones: 10
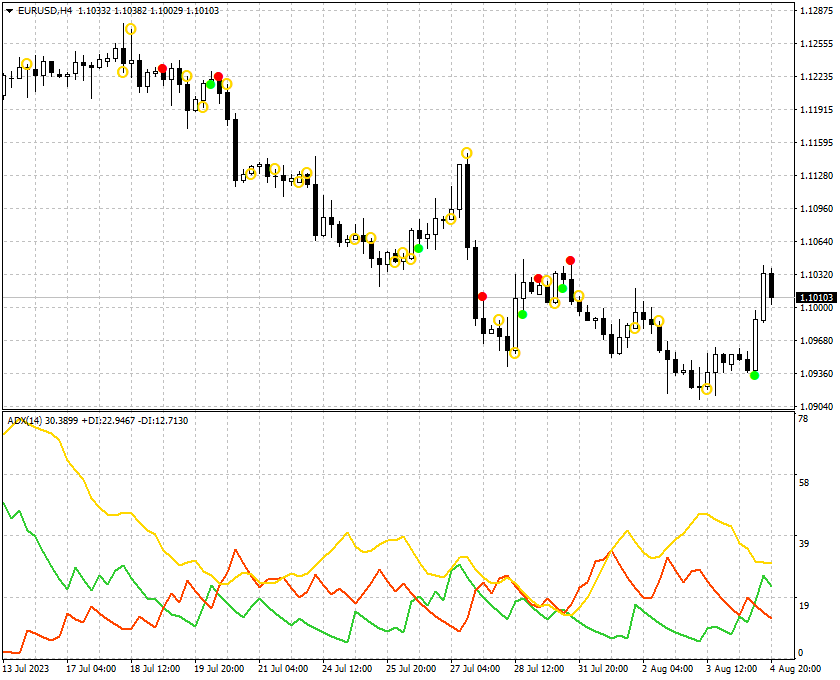
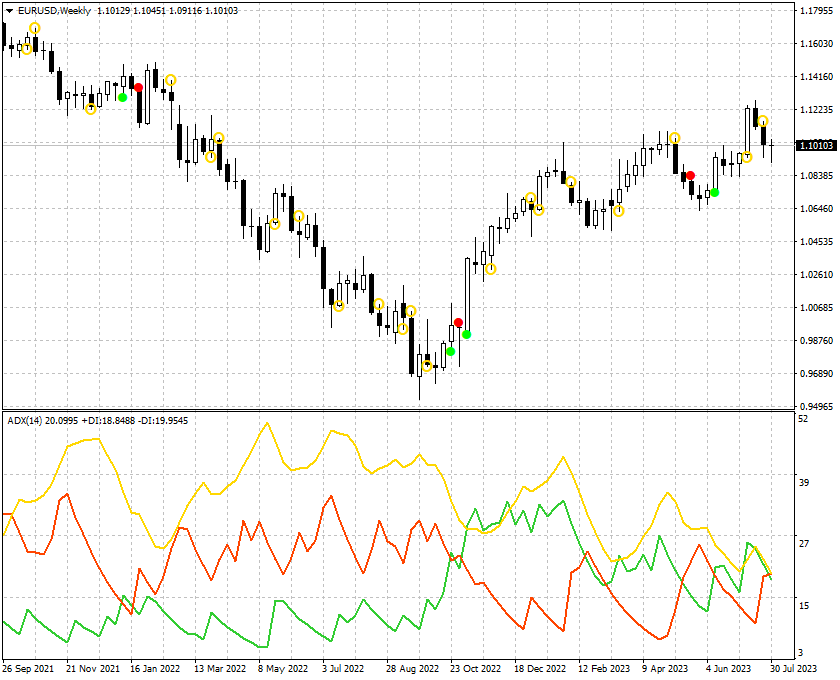
The indicator is an interpretation of the Average Directional Movement Index (ADX) allowing you to determine if there is a price trend.
It was developed by Welles Wilder and described in his book "New concepts in technical trading systems".
The indicator shows signals on the price chart when +DI и -DI intersect and when an ADX value rises or falls relative to the +DI и -DI positional relationship.
The indicator's buy signals work just like a support level, while the sell signals work like a resistance level.
Usage principles:
When a signal of +DI and -DI intersection appears, it is recommended to place a buy or sell pending order for the asset at the high (taking spread into account) or at the low of the bar, on which the signal appeared.
If an ADX fall signal appears when there is an open position, it is recommended to place a pending order to close the position at the high (taking spread into account) or at the low of the bar, on which the signal appeared.
It can also be useful to use the ADX rise/fall signal in the direction of a long-term trend to open a position.
Parameters:
- ADX_Period - ADX indicator period;
- ADX_Price - ADX calculation price;
- intersection_of_the_DMIp_DMIm - +DI and -DI intersection signals;
- height_ADX - ADX rise signals;
- falling_ADX - ADX fall signals;
- Alerts - show a dialog box containing user data;
- Send_Mail - sends an email using an address specified on the Email tab of the options window;
- Send_Notification - sends push notifications to the mobile terminals, whose MetaQuotes IDs are specified in the "Notifications" tab.
This indicator does not redraw and backpaint.


El usuario no ha dejado ningún comentario para su valoración