Ratio Indicator
- Indicadores
- Rafael Gazzinelli
- Versión: 1.2
- Actualizado: 2 noviembre 2024
Ratio Indicator - User Guide
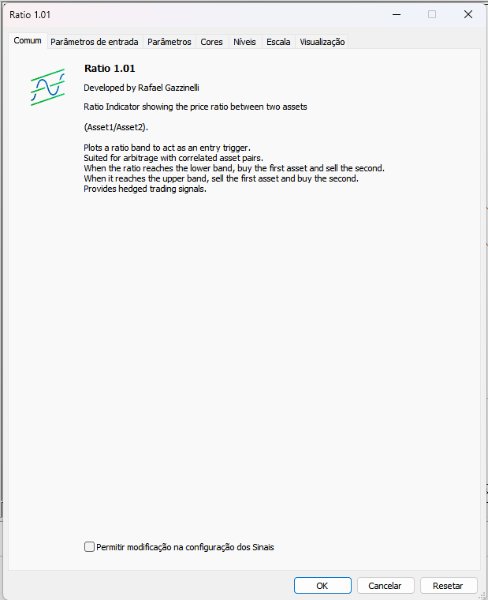
This Ratio indicator allows you to monitor and trade the price relationship between two selected assets. It calculates the ratio of the prices of two assets, known as Asset1 and Asset2 (for example, " GBPUSD" and "EURUSD"), and plots a moving average of the ratio, along with Bollinger Bands. These bands are used to identify ideal entry and exit points, especially in correlated assets, enabling an arbitrage approach.
How the Indicator Works
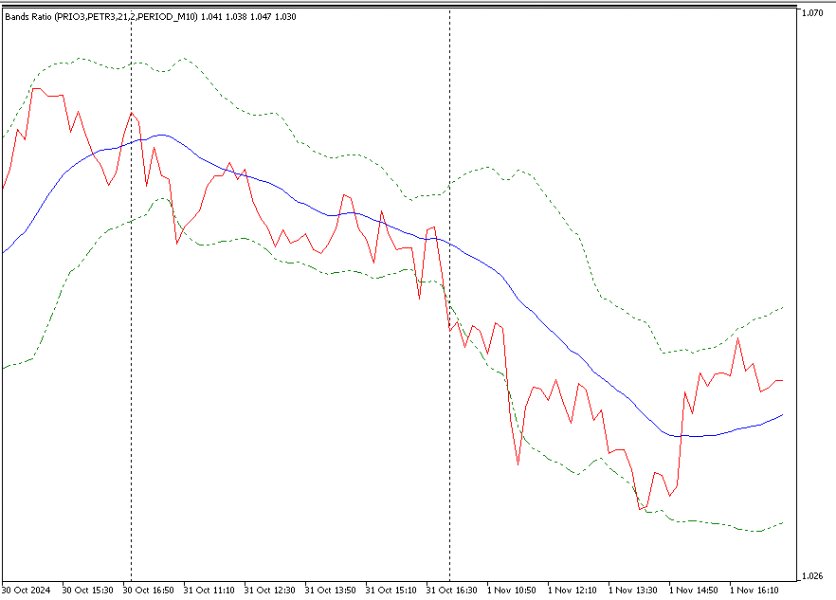
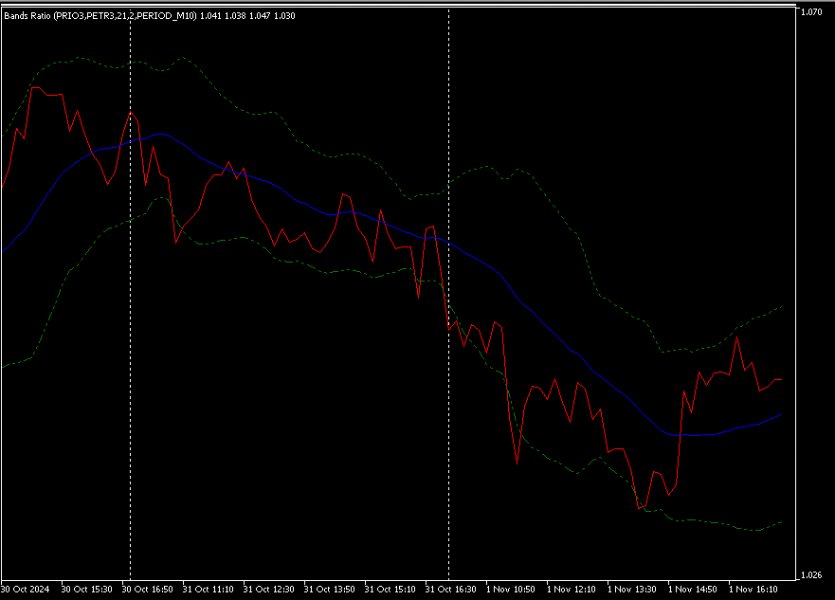
- Bollinger Bands on the Ratio: The indicator uses a moving average of the ratio Asset1/Asset2 with Bollinger Bands surrounding it.
- Lower Band: When the ratio reaches the lower band, it indicates that Asset1 is cheap relative to Asset2 . The strategy suggests buying Asset1 and selling Asset2.
- Upper Band: When the ratio reaches the upper band, it indicates that Asset1 is expensive relative to Asset2 . The strategy suggests selling Asset1 and buying Asset2.
This approach allows you to take advantage of fluctuations in the relationship between assets to execute hedged operations (buying one asset and selling another) in correlated pairs.
Explanation of Configurable Parameters
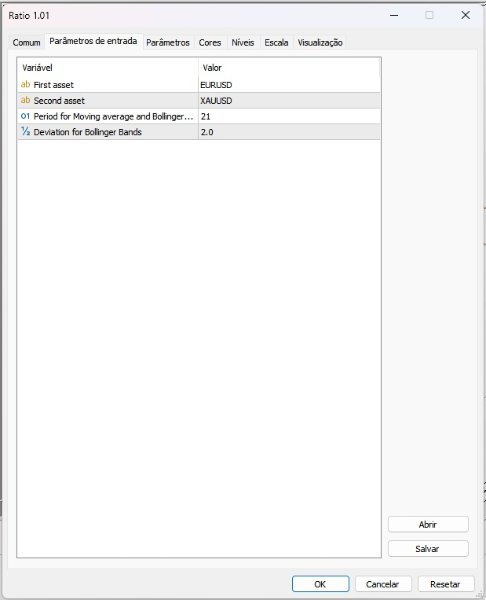
- Symbol1 and Symbol2 :
- These parameters define the assets for which the ratio will be calculated. For example:
- Symbol1 = " GBPUSD" : Defines the first asset, which will be bought or sold based on the position of the ratio relative to the bands.
- Symbol2 = "EURUSD" : Defines the second asset, which serves as a reference for calculating the ratio.
- Important: The assets should have a positive correlation for the arbitrage strategy to work well. This means their prices generally move in the same direction, making the ratio analysis more reliable.
- period :
- This parameter sets the period for the moving average and Bollinger Bands.
- Default Value: 21 , which represents the number of periods considered in the calculation.
- Adjusting the Period: Shorter periods make the indicator more sensitive, capturing faster movements, while longer periods make it less sensitive, focusing on long-term trends.
- deviation :
- Defines the standard deviation of the Bollinger Bands around the moving average of the ratio.
- Default Value: 2.0 , which is a common value for defining Bollinger Bands and represents a range that covers approximately 95% of expected movements of the ratio (assuming a normal distribution).
- Adjusting the Deviation: A higher value widens the bands, generating fewer entry/exit signals, while a lower value narrows them, increasing the frequency of buy and sell signals.
This indicator is particularly useful for traders who want to operate with correlated pairs and capture variations in price relationships. It is a powerful tool for arbitrage and hedge strategies, identifying deviations from a long-term average and taking advantage of these opportunities with protected trades.


















very good!Thank you