Supporti e Resistenze
- Indicadores
- Diego Bonifacio
- Versión: 2.0
- Actualizado: 7 marzo 2025
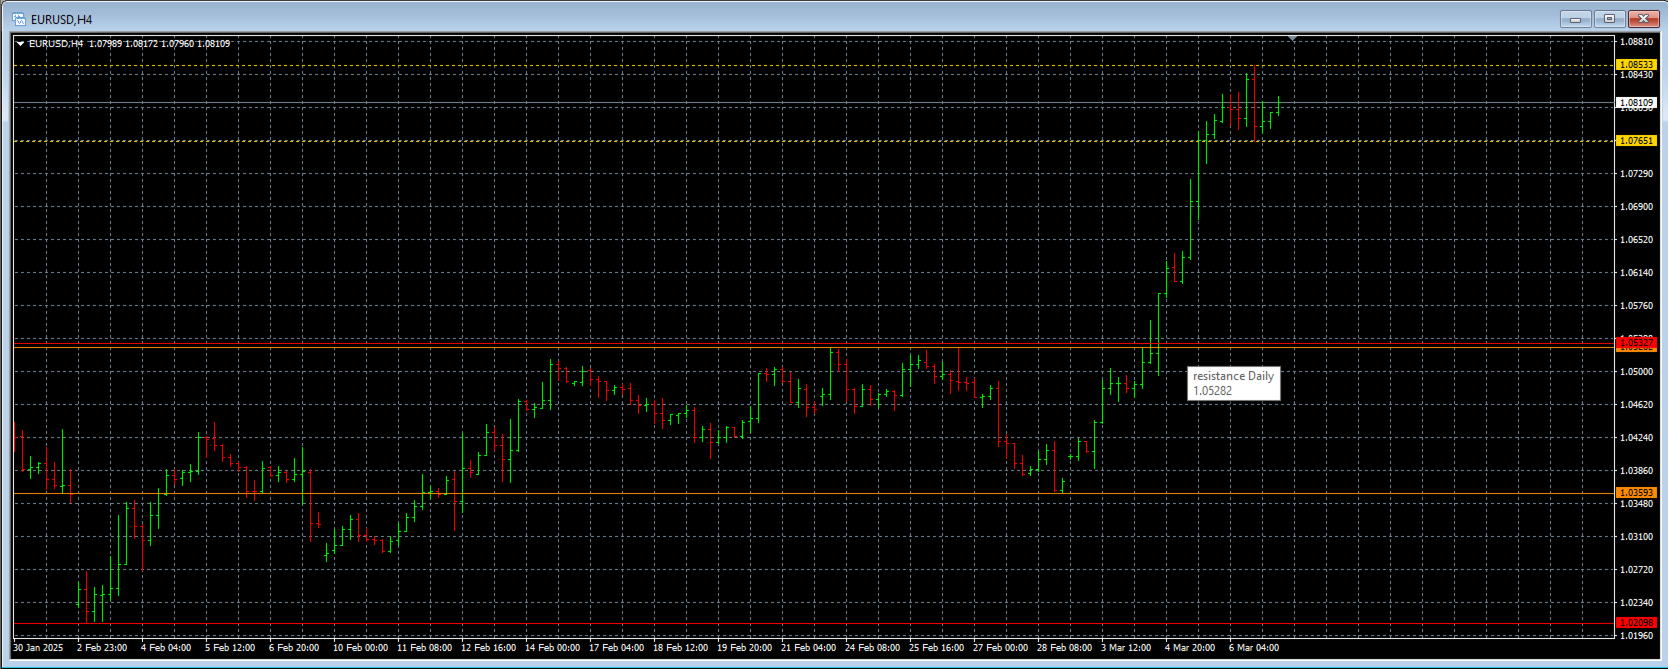
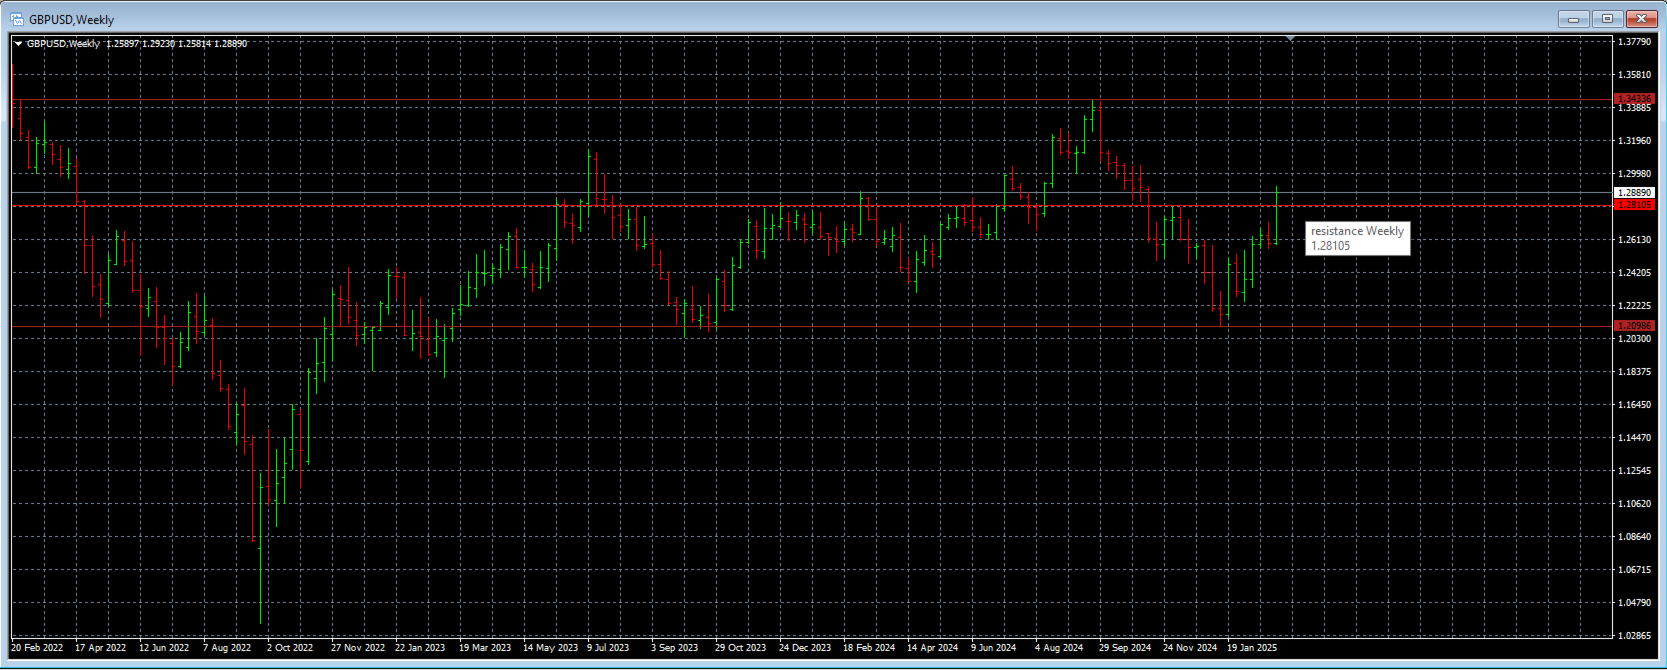
This indicator for MT4 automatically draws support and resistance levels based on fractals, highlighting key areas of the market where the price could reverse or slow down. Fractals are graphical structures that identify significant highs and lows, thus forming a dynamic system of support and resistance levels. The indicator allows you to visualize these levels directly on the chart, facilitating technical analysis and identifying potential entry or exit points in the market. It is an ideal tool for traders who are looking to exploit price movements in relation to fractal patterns and improve the accuracy of their trading strategies.
The supports and resistances identified on the chart are calculated on the H1, H4, Daily, Weekly, Monthly timeframes.
By hovering the cursor over the lines a label will identify the reference timeframe.
From the inputs it is possible to change the colors and style of the lines.