• Información general
  • Comentarios
  • Discusión
  • Novedades

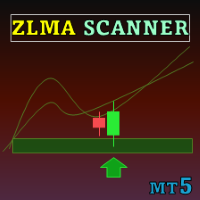
Zero Lag MA Trend Levels MT4 with Scanner

Special offer: ALL TOOLS, just $35 each!

New tools will be $30 for the first week or the first 3 purchases

Trading Tools Channel on MQL5: Join my MQL5 channel to update the latest news from me

El indicador Zero Lag MA Trend Levels con escáner combina la media móvil de cero retraso (ZLMA) con una media móvil exponencial estándar (EMA), brindando a los traders una visión completa del impulso del mercado y los niveles clave de precios. Además, las funciones de escáner y alertas permiten a los traders rastrear fácilmente señales en múltiples pares y marcos de tiempo, mejorando la capacidad de detectar oportunidades de trading.

See more MT5 version at:  Zero Lag MA Trend Levels MT5 with Scanner

See more products at: https://www.mql5.com/en/users/ndhsfy/seller

CARACTERÍSTICAS CLAVE Y CÓMO UTILIZARLO

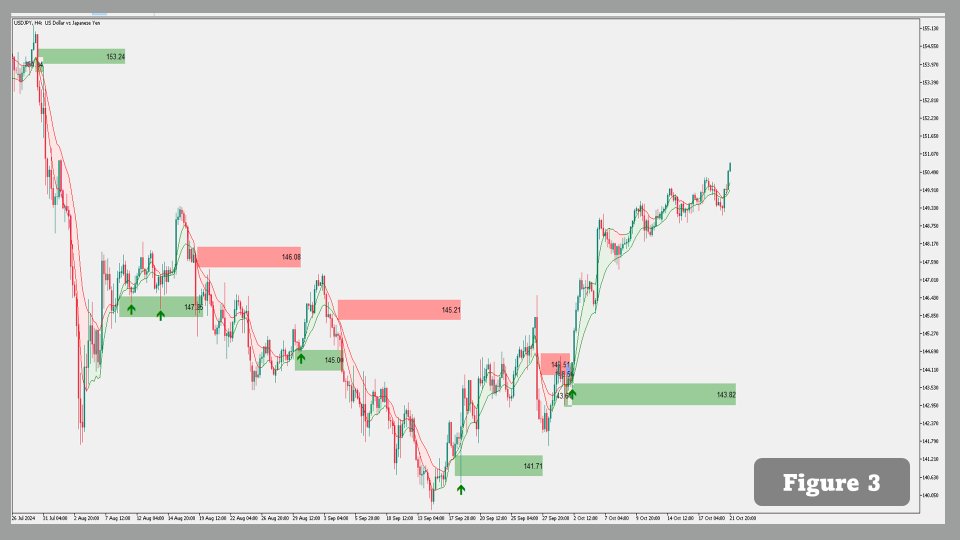
Media móvil de cero retraso (ZLMA) con nube EMA
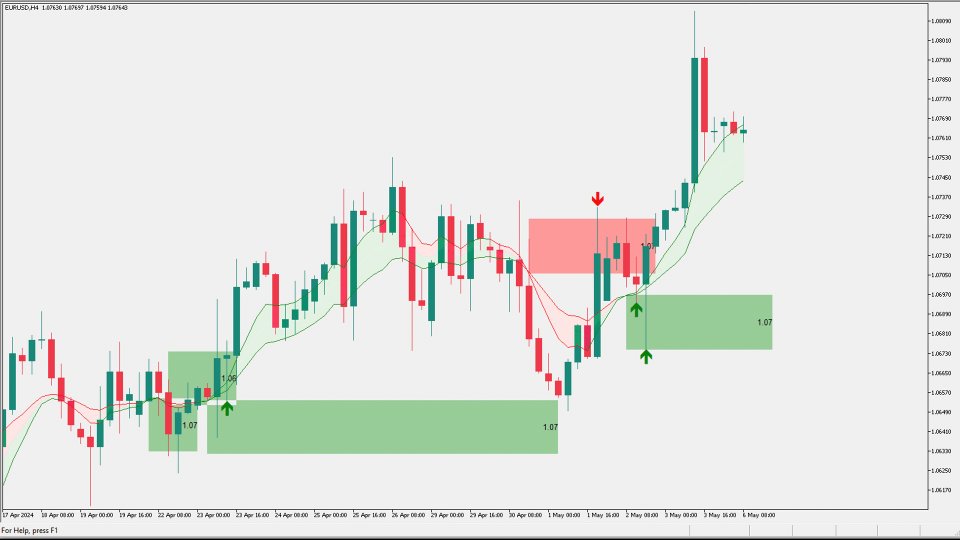
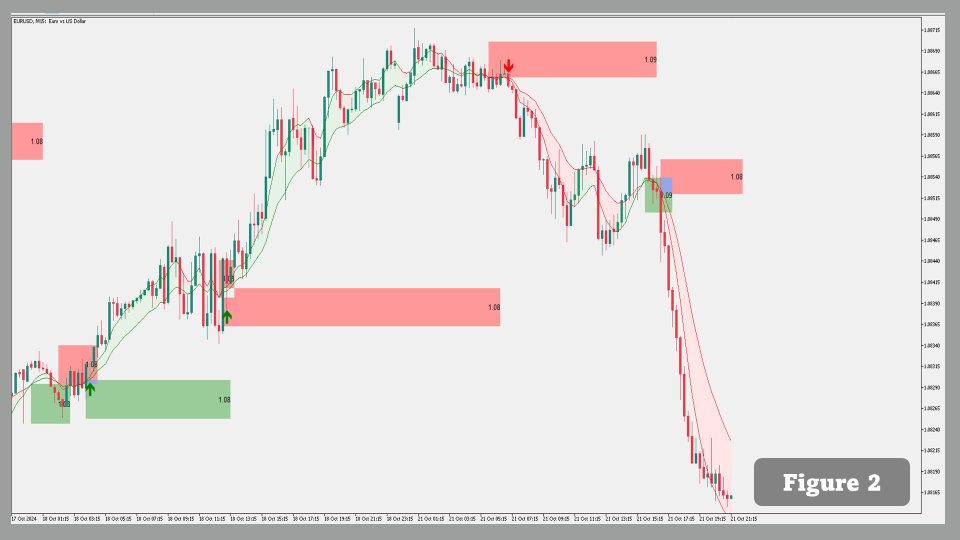
El indicador muestra una nube que cambia de color entre la ZLMA y la EMA según la dirección de la tendencia. El verde indica una tendencia alcista, mientras que el rojo señala una tendencia bajista.

Cómo utilizarlo: Monitorea los cambios de color en la nube para detectar posibles cambios en la tendencia o el impulso.

Cajas de cambio de tendencia y niveles
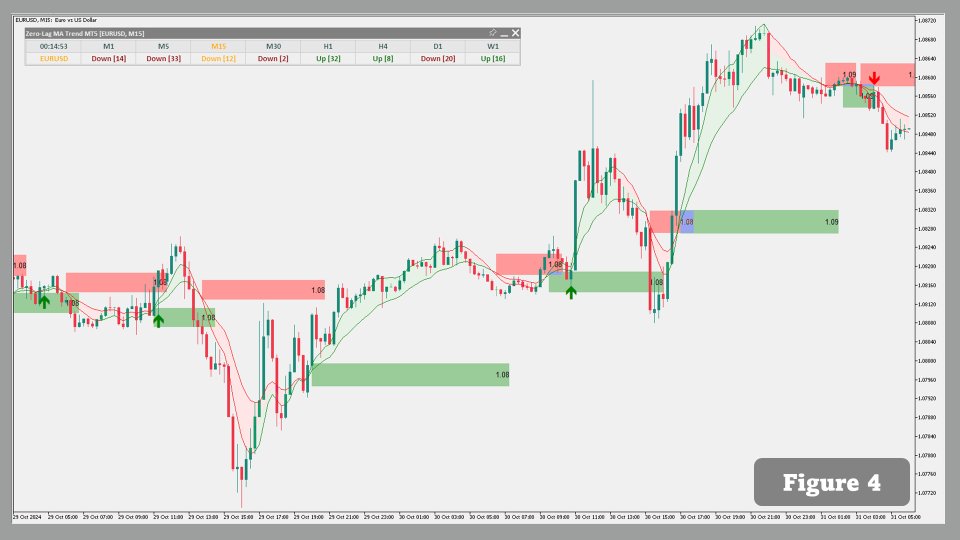
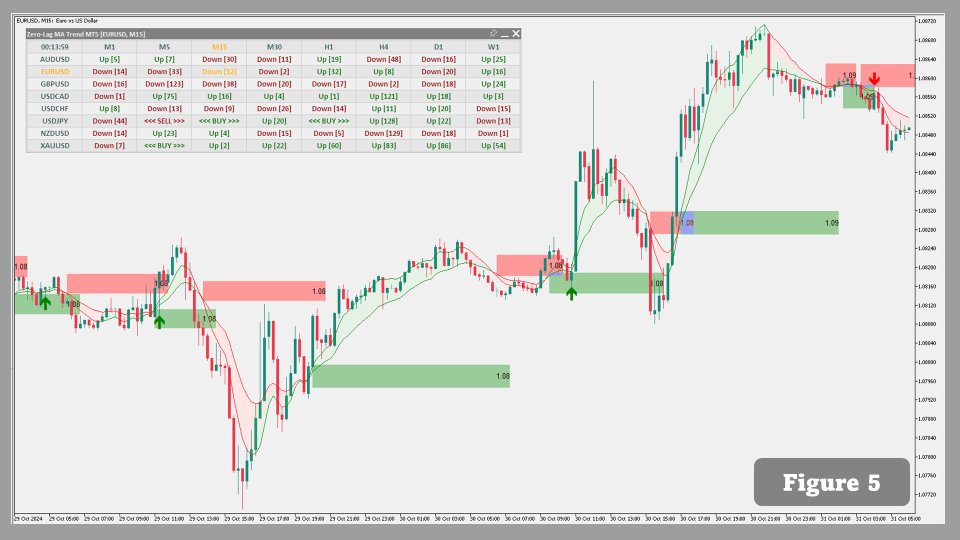
Cada vez que la EMA y la ZLMA se cruzan, el indicador dibuja una caja alrededor del nivel de precios donde ocurre el cambio de tendencia, marcando zonas importantes de soporte y resistencia.

Cómo utilizarlo: Usa estas cajas como puntos potenciales de entrada o salida cuando el precio vuelva a visitar estos niveles.

Detección de retesteo con flechas
Cuando el precio retestea una caja de nivel de tendencia previamente trazada, el indicador marca esto con una flecha: flechas hacia arriba para retesteos alcistas y flechas hacia abajo para retesteos bajistas.

Cómo utilizarlo: Estas flechas ayudan a los traders a identificar puntos potenciales de continuación o reversión, confirmando decisiones de trading en niveles de precios críticos.

Codificación de colores dinámica
La ZLMA y la EMA cambian de color según la tendencia actual, lo que facilita una evaluación rápida del impulso del mercado y la dirección de la tendencia.

Escáner y alertas
La función de escáner permite a los traders escanear múltiples pares y marcos de tiempo en busca de señales de flechas cuando el precio retestea las zonas de tendencia. Las alertas se activan cuando aparece una nueva señal, asegurando que los traders no se pierdan una oportunidad clave.

Nota importante sobre el repintado:
El indicador solo repinta la vela anterior. Si el precio toca la zona y rebota en la vela anterior, la señal aparecerá. Sin embargo, si la vela actual vuelve a la zona, la señal desaparecerá. Si la vela actual cierra fuera de la zona, la señal permanecerá sin cambios, proporcionando una confirmación confiable.

ENTRADAS DEL USUARIO

  • Longitud: Define el período para los cálculos de medias móviles.
  • Período ATR: El período del rango verdadero promedio (ATR) utilizado para calcular los niveles de tendencia.
  • Precio aplicado: Elige qué precio (cierre, apertura, etc.) aplicar a los cálculos.
  • Otras opciones de visualización: Personaliza colores, muestra u oculta las cajas de niveles de tendencia y las flechas de retesteo.

CONCLUSIÓN
El indicador Zero Lag MA Trend Levels con escáner proporciona una herramienta poderosa para la detección de tendencias y la gestión de operaciones. Con las funciones de escáner y alertas, los traders pueden monitorear señales en múltiples mercados, asegurando que estén al tanto de configuraciones comerciales importantes. Al identificar niveles de tendencia y retesteos, este indicador ofrece una solución altamente efectiva para traders que buscan señales de trading precisas y oportunas.
    Productos recomendados
    UPD1 Fibo Levels
    Vitaliy Kuznetsov
    5 (2)
    El indicador analiza el número especificado de velas y traza los niveles de Fibonacci en función del máximo-mínimo. Dado que los niveles se están reorganizando, estamos interesados ​​en el lado derecho del rango. El precio ima a los niveles y reacciona al tacto. Utilice esta herramienta para encontrar un punto de entrada de tendencia después de una corrección. Si a la izquierda vemos que los niveles han subido perfectamente, entonces podemos suponer que hemos encontrado el final del movimiento e
    FREE
    BeST_ Classic Pivot Points is an MT4 Indicator that is based on the widely known and definitely classic Pivot Point of a market prices activity. A pivot point is calculated as an average of significant prices (high,low,close) from the performance of a market in the prior trading period. If the market in the following period trades above the pivot point it is usually evaluated as a bullish sentiment, whereas trading below the pivot point is seen as bearish. A pivot point and the associated suppo
    FREE
    Pivot Points MT4
    KEENBASE SOFTWARE SOLUTIONS
    KT Pivot Points automatically plots the daily, weekly, and monthly pivot levels on a chart with the precise calculation based on the latest data. Pivot points is a widely used indicator in technical analysis, particularly in the Forex market. Features Send alerts when the price touches the pivot level.  It offers complete customization for each kind of pivot level.   Shows daily, weekly, and monthly pivot levels without any fuss. It uses minimum CPU resources for faster calculation. Compatible
    The SFT Fibo Smart Pivot indicator is a powerful trading tool based on the Fibonacci Golden Ratio, designed to identify key support and resistance levels in the forex market. This indicator has the ability to pinpoint significant price levels that can serve as entry and exit points for trades. It enables traders to analyze the market more effectively and make well-informed decisions. The indicator uses the Fibonacci Golden Ratio to accurately determine support and resistance levels. These levels
    FREE
    This indicator is stand alone version from  MP Pivot Levels  (All in one) containing Woodie Pivots. Woodie’s pivot points are made up of multiple key levels, calculated from past price points, in order to frame trades in a simplistic manner. The key levels include the ‘pivot’ itself, and multiple support and resistance levels (usually up to three each). Traders use these levels as a guide for future price movements when setting up trades. The pivot : (Previous high + previous low + 2 x previous
    FREE
    VaviStar is an indicator based on trend retracements determined by ZigZag segments. It is theorized, and statistics confirm, that stocks react to certain retracement levels. Many use Fibonacci retracement levels (23.6%, 38.2%, 61.8%). It is assumed that once the price goes beyond the 61.8% retracement, we can already speak of a trend reversal. This indicator allows you to comfortably chart a segment of the ZigZag with the relative operating levels chosen. With a reversal mindset , you can use it
    The Market Structures Pro indicator finds and displays 5 (five) patterns of the Smart Money Concepts (SMC) system on the chart, namely: Break Of Structures (BoS)       Change of character (CHoCH) Equal Highs & Lows Premium, Equilibrium and Discount zones with Fibo grid High-high, Low-low, High-low and Low-high extremes Patterns are displayed for two modes - Swing and Internal and are easily distinguished by color on the chart. Internal mode features higher contrast colors, finer lines, and smal
    Pivot levels Auto V1
    Hafis Mohamed Yacine
    What Is a Pivot Point? A pivot point is a technical analysis indicator, or calculations, used to determine the overall trend of the market over different time frames. The pivot point itself is simply the average of the intraday high and low, and the closing price from the previous trading day. On the subsequent day, trading above the pivot point is thought to indicate ongoing bullish sentiment, while trading below the pivot point indicates bearish sentimen How to Use Pivot Points The very ess
    The   Pivot Point indicator   automatically calculates and displays the pivot point line and support and resistance levels. Pivot can be calculated according to the Classic, Floor, Fibonacci, Woodie, Camarilla or DeMark formula. It is also possible to select the period for calculating the indicator. A trader can choose from daily, weekly, monthly, or user-defined periods. Types of pivots Classic Floor Fibonacci Woodie Camarilla DeMark Main features The indicator shows the current and historic
    FREE
    FiboZag
    Andriy Sydoruk
    Indicator FiboZag - transfer the indicator to the chart and the Fibonacci levels will be built automatically on the last ZigZag turn. The main advantage lies in the correct construction of Fibonacci levels and markup of price levels. Simple, visual and effective use. The indicator is not redrawn and does not lag. Works on all currency pairs and on all timeframes.
    Wa Candle Timer MT4
    Wachinou Lionnel Pyrrhus Sovi Guidi
    5 (1)
    Wa Candle Timer MT4 Wa Candle Timer MT4   es un indicador potente y fácil de usar, diseñado para mostrar el tiempo restante hasta que se forme la próxima vela en tu gráfico de MT4. Esta herramienta ayuda a los traders a estar al tanto del cierre de las velas, lo que permite una mejor ejecución de operaciones y toma de decisiones. Características Principales: Muestra un temporizador de cuenta regresiva para la vela actual. Cambia de color cuando queda menos del 5% del tiempo de la vela.
    FREE
    AC Pivot Panel – Your Ultimate Pivot Trading Tool The   AC Pivot Panel   is a powerful yet user-friendly pivot point indicator designed to help traders identify key support and resistance levels with ease. Whether you’re a beginner or an experienced trader, this indicator simplifies pivot trading and enhances your decision-making process. Key Features : Interactive Selection Panel : Easily adjust pivot settings directly on the chart with a compact and intuitive panel. Multiple Pivot Methods : C
    FREE
    ClickDrag dibuja líneas y mueve objetos en el gráfico fácilmente. Haga clic y luego arrastre para empezar a dibujar una línea de tendencia. Moviendo el ratón horizontalmente se dibuja una línea de precio. Moviendo el ratón verticalmente se dibuja una línea de fecha. Las líneas y objetos existentes pueden moverse haciendo clic y arrastrando. Muestra el precio y la diferencia de tiempo entre el punto inicial y el punto final. Después de iniciar Haga clic y arrastre, Agite hacia la izquie
    FREE
    Parabolic Predictor
    Thushara Dissanayake
    El   Predictor Parabólico   es un poderoso indicador técnico diseñado para identificar tendencias precisas y filtrar las señales Parabólicas tradicionales para predecir los niveles de entrada y salida del mercado. Con sus técnicas avanzadas, este indicador ofrece una visualización precisa de la dirección de la tendencia, los niveles de entrada óptimos y los niveles de obtención de beneficios directamente en el gráfico. Además, cuenta con un sistema de alerta rápido que envía notificaciones a tra
    Possible Price reversals levels - based on  Fibonacci + Support +  Resistance Levels Auto levels drawn based on input index (Bars Count )  ---->>> Price Over 50% Fibo line ---> UP TREND ---> BUY when price drop near Support Lines  ---->>> Price Down 50% Fibo line ---> DOWN TREND ---> SELL when price goes up  near Resistance Lines  --->>> The more close price levels ----> the more possibility for price reversals --->>> are you a scalper --> try it on M1 charts with big index like 5000 bars  or
    This indicator is based on Mr. Mark Fisher's ACD strategy, based on the book "The Logical Trader." - OR lines - A lines - C lines - Daily pivot range - N days pivot range - Customizable trading session - Drawing OR with the desired time Drawing levels A and C based on daily ATR or constant number - Possibility to display daily and last day pivots in color zone - Displaying the status of daily PMAs (layer 4) in the corner of the chart - Show the order of daily pivot placement with multi-day pi
    FREE
    Day Points Indicadtor that shows the points considered important for X days. (Open,Close, High, Low) Used a lot by those who do day trade. These points can be used for decision making by a trader. You will choose the amount of days ago for it to show. Settings High/Low/Close/Open Show - True/False. Days - Number of days that will show on the chart. Color - Line Color. Style - Line Style.
    Description: The indicator measures, through the zigzag indicator, the levels of trend or correction. It shows in the chart the levels of each low or high detected. KEY LINKS:   How to Install  –  Frequent Questions  -  All Products  How is this indicator useful? This indicator determines, depending on Zigzag parameter if a trend is beginning, developing, or ending This indicator determines the direction of the trend Components Levels as positive or negative numbers, depending on the direction
    FREE
    The indicator draws trend lines based on Thomas Demark algorithm. It draws lines from different timeframes on one chart. The timeframes can be higher than or equal to the timeframe of the chart, on which the indicator is used. The indicator considers breakthrough qualifiers (if the conditions are met, an additional symbol appears in the place of the breakthrough) and draws approximate targets (target line above/below the current prices) according to Demark algorithm. Recommended timeframes for t
    NO REPAINT ADVANCED CHART PATTERN INDICATOR By definition, a price ( chart)  pattern is a recognizable configuration of price movement that is identified using a series of  trendlines  and/or curves. When a price pattern signals a change in trend direction, it is known as a reversal pattern; a continuation pattern occurs when the trend continues in its existing direction following a brief pause. Advanced Chart Pattern Tracker is designed to find the MOST ACCURATE patterns. A special script is a
    This indicator draws lines at the open, close, high and low price of the last chart candle from the set timeframe. In addition, a label shows whether it was an up or down candle. The standard settings follow the original idea of ​​getting the price data from the daily timeframe for day trading/scalping, but since this indicator is fully customizable, you can also set a different timeframe. Based on the drawn price lines, you can then also display Fibonacci levels. This function can also be
    SR indicator
    Alexander Chertnik
    SR is a support and resistance indicator, it shows major highs and lows by different colors. The color of a level is changing if the last high or low are touching it. After the closing of a bar above or below level, it will delete it. extern inputs: loop for candles / colors / drawing time *This indicator signal is not perfect and have to be used with other market analysis and confirmations.
    FREE
    Free automatic Fibonacci is an indicator that automatically plots a Fibonacci retracement based on the number of bars you select on the BarsToScan setting in the indicator. The Fibonacci is automatically updated in real time as new highest and lowest values appears amongst the selected bars. You can select which level values to be displayed in the indicator settings. You can also select the color of the levels thus enabling the trader to be able to attach the indicator several times with differe
    FREE
    Este indicador de marco de tiempo múltiple y símbolo múltiple identifica formaciones superiores / inferiores dobles o triples o una ruptura del escote siguiente (superior / inferior confirmada). Ofrece filtros RSI, pin bar, envolvente, pinzas, estrella matutina / vespertina, así como opciones de filtro de divergencia MACD, Awesome (AO) o RSI que permiten filtrar solo las configuraciones más fuertes.       El indicador también se puede utilizar en modo de gráfico único. Lea más sobre esta opción
    MP Demark Pivot Levels
    Pierre Ksachikian
    4.5 (2)
    This indicator is stand alone version from  MP Pivot Levels  (All in one) containing Demark's Pivots. Calculations:     PP = X / 4     R1 = X / 2 - LOWprev     S1 = X / 2 - HIGHprev Uses: When the pair currency price may change the direction of movement. Possible constraints of support and resistance that creates plateaus for the currency pair prices. Tendency identification by comparing the present prices according to current day's pivot point and also the prior day's pivot points. ____________
    FREE
    Holy Trend PRO
    Bianca Seara
    5 (1)
    About Holy Trend was developed to identify trend and strength. VIDEO (information and tips) [HERE] Features Identifies trend Identifies strength of trend Identifies lines of support and resistance Easy to analyze Fast signals All timeframes Not repaint (when candle close) No settings required Can be used in Renko charts Can be used with indicator Holy Renko PRO Alerts, email and push notifications Advantages Sensitive identifier of trend able to identify the long, short movements and correc
    The indicator plots flexible support and resistance levels (dots). A special phase of movement is used for construction. Levels are formed dynamically, that is, each new candle can continue the level or complete it. The level can provide resistance or support to the price even where it is no longer there. Also, support and resistance levels can change roles. The importance of levels is affected by: the amount of time the level is formed and the number of touches. The significance of these lev
    This is just a simple indicator that show Alert when the Current candle Close Above the Trendline. Previous candle do not affect the Alert.  The indicator is tied to the Trendline so if the Trendline is accidentally deleted, the Alert will not work. The indicator will draw another Trendline if the current Trendline is deleted.  Removing the indicator will removed the Trendline. There are 4 type of Alert to set: Popup Alert, Signal Alert, Push Notification, Comment.
    FREE
    BeST_Fibonacci Retracement Lines is an MT4 Indicator that by default is based on common  Fibonacci levels but it can also draw any 3 desired levels of Retracement or Support of a trending move. It can be used to identify pullback points but also additionally as a kind of a Trailing Stop . BeST_Fibonacci Retracement Lines indicator: • by default draws 38.2%, 50% and 61.8% Retracement Levels of the current price move defined using the Highest High (HH) and Lowest Low (LL) of a desired Look Back Pe
    American Hunters
    Mehmet Ozhan Hastaoglu
    This indicator guides you like a hunter. Tacheprofit and StopLoss levels. See the difference in the experiment. Works in all periods. Works at all rates. You can win with this system. The crossing of the mean and the re-test were done according to the rule. You can see the transactions by moving backwards on the strategy test screen. The whole system is automatically calculated.
    Los compradores de este producto también adquieren
    Gann Made Easy
    Oleg Rodin
    4.8 (116)
    Gann Made Easy es un sistema de comercio de Forex profesional y fácil de usar que se basa en los mejores principios de comercio utilizando la teoría del Sr. W. D. Gann. El indicador proporciona señales precisas de COMPRA y VENTA, incluidos los niveles de Stop Loss y Take Profit. Puede comerciar incluso sobre la marcha utilizando notificaciones PUSH. ¡Por favor, póngase en contacto conmigo después de la compra! ¡Compartiré mis consejos comerciales con usted y excelentes indicadores de bonificació
    Gold Stuff
    Vasiliy Strukov
    4.86 (253)
    Gold Stuff: un indicador de tendencia diseñado específicamente para el oro, también se puede usar en cualquier instrumento financiero. El indicador no se vuelve a dibujar ni se retrasa. El marco de tiempo recomendado es H1. Este indicador está escrito por EA Gold Stuff Advisor, puede encontrarlo en mi perfil.  Puede obtener una copia gratuita de nuestro indicador Strong Support y Trend Scanner, por favor envíe un mensaje privado. ¡a mí! IMPORTANTE! Póngase en contacto conmigo inmediatamente de
    M1 Arrow
    Oleg Rodin
    5 (17)
    Una estrategia intradía basada en dos principios fundamentales del mercado. El algoritmo se basa en el análisis de volúmenes y ondas de precios utilizando filtros adicionales. El algoritmo inteligente del indicador da una señal solo cuando dos factores de mercado se combinan en uno. El indicador calcula ondas de cierto rango en el gráfico M1 utilizando los datos del marco de tiempo más alto. Y para confirmar la onda, el indicador utiliza el análisis por volumen. Este indicador es un sistema come
    Dynamic Forex28 Navigator
    Bernhard Schweigert
    5 (5)
    Dynamic Forex28 Navigator: la herramienta de trading de Forex de última generación. ACTUALMENTE CON UN 49 % DE DESCUENTO. Dynamic Forex28 Navigator es la evolución de nuestros indicadores populares de larga data, que combina el poder de tres en uno: Indicador avanzado Currency Strength28 (695 reseñas) + Indicador avanzado Currency IMPULSE con ALERT (520 reseñas) + Señales combinadas CS28 (bonificación). Detalles sobre el indicador https://www.mql5.com/en/blogs/post/758844 ¿Qué ofrece el indi
    Te presento un excelente indicador técnico: Grabber, que funciona como una estrategia de trading "todo incluido" lista para usar. En un solo código se integran potentes herramientas de análisis técnico del mercado, señales de trading (flechas), funciones de alertas y notificaciones push. Cada comprador de este indicador recibe además de forma gratuita: Grabber Utility: una herramienta para la gestión automática de órdenes abiertas Video manual paso a paso: cómo instalar, configurar y operar con
    ¡Actualmente 20% OFF ! ¡La mejor solución para cualquier novato o trader experto! Este software funciona con 28 pares de divisas. Se basa en 2 de nuestros principales indicadores (Advanced Currency Strength 28 y Advanced Currency Impulse). Proporciona una gran visión general de todo el mercado de divisas. Muestra los valores de Advanced Currency Strength, la velocidad de movimiento de las divisas y las señales para 28 pares de divisas en todos los (9) marcos temporales. Imagine cómo mejorará
    Scalper Inside PRO
    Alexey Minkov
    4.76 (63)
    !SPECIAL SALE! An exclusive indicator that utilizes an innovative algorithm to swiftly and accurately determine the market trend. The indicator automatically calculates opening, closing, and profit levels, providing detailed trading statistics. With these features, you can choose the most appropriate trading instrument for the current market conditions. Additionally, you can easily integrate your own arrow indicators into Scalper Inside Pro to quickly evaluate their statistics and profitability
    Easy Breakout
    Mohamed Hassan
    5 (10)
    After your purchase, feel free to contact me for more details on how to receive a bonus indicator called VFI, which pairs perfectly with Easy Breakout for enhanced confluence!   Easy Breakout is a powerful price action trading system built on one of the most popular and widely trusted strategies among traders: the Breakout strategy ! This indicator delivers crystal-clear Buy and Sell signals based on breakouts from key support and resistance zones. Unlike typical breakout indicators, it levera
    Scalper Vault
    Oleg Rodin
    5 (29)
    Scalper Vault es un sistema profesional de reventa que le brinda todo lo que necesita para una reventa exitosa. Este indicador es un sistema comercial completo que puede ser utilizado por operadores de divisas y opciones binarias. El marco de tiempo recomendado es M5. El sistema le proporciona señales de flecha precisas en la dirección de la tendencia. También le proporciona señales superiores e inferiores y niveles de mercado de Gann. Los indicadores proporcionan todo tipo de alertas, incluidas
    Apollo Secret Trend es un indicador de tendencia profesional que se puede utilizar para encontrar tendencias en cualquier par y período de tiempo. El indicador puede convertirse fácilmente en su principal indicador comercial que puede usar para detectar tendencias del mercado sin importar qué par o marco de tiempo prefiera operar. Al usar un parámetro especial en el indicador, puede adaptar las señales a su estilo comercial personal. El indicador proporciona todo tipo de alertas, incluidas las n
    Enigmera
    Ivan Stefanov
    5 (7)
    ENIGMERA: El núcleo del mercado Importante: La demostración de MQL5.com se ejecuta en el Strategy Tester y puede no reflejar completamente la funcionalidad de Enigmera. Consulta la descripción, las capturas de pantalla y el video para más detalles. ¡No dudes en contactarme si tienes alguna pregunta! El código del indicador ha sido completamente reescrito. La versión 3.0 añade nuevas funcionalidades y elimina errores acumulados desde el inicio del indicador. Introducción Este indicador y sistem
    Trend Screener
    STE S.S.COMPANY
    4.78 (93)
    Indicador de tendencia, solución única e innovadora para el comercio y filtrado de tendencias con todas las funciones de tendencias importantes integradas en una sola herramienta. Es un indicador 100% sin repintar de marcos temporales y monedas múltiples que se puede usar en todos los símbolos/instrumentos: divisas, materias primas, criptomonedas, índices y acciones. OFERTA POR TIEMPO LIMITADO: El indicador de detección de soporte y resistencia está disponible por solo 50$ y de por vida. (Precio
    FX Volume
    Daniel Stein
    4.59 (34)
    FX Volume: Experimente el Verdadero Sentimiento del Mercado desde la Perspectiva de un Bróker Resumen Rápido ¿Desea llevar su estrategia de trading a otro nivel? FX Volume ofrece información en tiempo real sobre cómo los traders minoristas y los brókers están posicionados, mucho antes de que aparezcan informes retrasados como el COT. Ya sea que busque beneficios consistentes o simplemente quiera una ventaja más profunda en los mercados, FX Volume le ayuda a identificar desequilibrios important
    Lux Trend
    Mohamed Hassan
    5 (3)
    After purchase, please contact me to get your trading tips + more information for a great bonus!   Lux Trend is a professional strategy based on using Higher Highs and Lower Highs to identify and draw Trendline Breakouts! Lux Trend  utilizes two Moving Averages to confirm the overall trend direction before scanning the market for high-quality breakout opportunities, ensuring more accurate and reliable trade signals. This is a proven trading system used by real traders worldwide, demonstrating
    TPSproTREND PrO
    Roman Podpora
    4.68 (25)
    VERSION MT5        —        ИНСТРУКЦИЯ RUS           —        INSTRUCTIONS  ENG Funciones principales: Señales de entrada precisas ¡SIN RENDERIZACIÓN! Si aparece una señal, ¡sigue siendo relevante! Esta es una diferencia importante con respecto a los indicadores de redibujo, que pueden proporcionar una señal y luego cambiarla, lo que puede provocar una pérdida de fondos depositados. Ahora puedes ingresar al mercado con mayor probabilidad y precisión. También existe la función de colorear las ve
    FX Power MT4 NG
    Daniel Stein
    4.94 (18)
    FX Power: Analiza la Fuerza de las Divisas para Decisiones de Trading Más Inteligentes Descripción General FX Power es tu herramienta esencial para comprender la fuerza real de las principales divisas y el oro en cualquier condición de mercado. Al identificar divisas fuertes para comprar y débiles para vender, FX Power simplifica las decisiones de trading y descubre oportunidades de alta probabilidad. Ya sea que quieras seguir las tendencias o anticipar reversiones utilizando valores extremos
    Golden Trend Indicator
    Noha Mohamed Fathy Younes Badr
    4.9 (10)
    Golden Trend indicator  is The best indicator for predicting trend movement this indicator never lags and never repaints and never back paints    and give  arrow buy and sell    before the candle appear  and it will help you and  will make your trading decisions clearer its work on all currencies and  gold and crypto and all time frame This unique  indicator uses very secret algorithms to catch the  trends, so you can trade using this indicator and see the trend clear on charts  manual guide and
    Algo Pumping MT4
    Ihor Otkydach
    5 (4)
    PUMPING STATION – Tu estrategia personal "todo incluido" Te presentamos PUMPING STATION, un indicador revolucionario para Forex que transformará tu forma de operar en una experiencia emocionante y eficaz. No es solo un asistente, sino un sistema de trading completo con potentes algoritmos que te ayudarán a operar de forma más estable. Al comprar este producto, recibes GRATIS: Archivos de configuración exclusivos: para una configuración automática y un rendimiento óptimo. Manual en video paso a p
    - Real price is 80$ - 40% Discount (It is 49$ now) - Lifetime update free Contact me for instruction, add group and any questions! Related Products:  Bitcoin Expert , Gold Expert - Non-repaint - I just sell my products in Elif Kaya profile, any other websites are stolen old versions, So no any new updates or support. Introduction The breakout and retest strategy is traded support and resistance levels. it involves price breaking through a previous level.  The break and retest strategy is design
    TPSpro RFI Levels
    Roman Podpora
    4.85 (27)
    El indicador que redefinió el trading, se convirtió en el punto de referencia para el análisis de gráficos y estableció nuevos estándares en el trading. Zonas de reversión /   Zonas de volumen máximo   /   Zonas activas de un jugador grande     INSTRUCCIONES RUS         INSTRUCCIONES   ENG   /   Recomendamos utilizar con el indicador -   TPSpro TREND PRO Cada comprador de este indicador recibe adicionalmente GRATIS: 6 meses de acceso a señales comerciales del servicio RFI SIGNALS: puntos
    Volatility Trend System - un sistema de comercio que da señales para las entradas. El sistema de volatilidad da señales lineales y puntuales en la dirección de la tendencia, así como señales para salir de ella, sin redibujar ni demoras. El indicador de tendencia monitorea la dirección de la tendencia a mediano plazo, muestra la dirección y su cambio. El indicador de señal se basa en cambios en la volatilidad y muestra entradas en el mercado. El indicador está equipado con varios tipos de alert
    Gold Venamax MT4
    Sergei Linskii
    2 (1)
    Gold Venamax : este es el mejor indicador técnico de acciones. El algoritmo del indicador analiza el movimiento del precio de un activo y refleja la volatilidad y las posibles zonas de entrada. Características del indicador: Este es un súper indicador con Magia y dos bloques de flechas de tendencia para un comercio cómodo y rentable. El botón rojo para cambiar de bloque se muestra en el gráfico. La magia se establece en la configuración del indicador, por lo que puede instalar el indicador en
    Introduction to X3 Chart Pattern Scanner X3 Cherart Pattern Scanner is the non-repainting and non-lagging indicator detecting X3 chart patterns including Harmonic pattern, Elliott Wave pattern, X3 patterns, and Japanese Candlestick patterns. Historical patterns match with signal patterns. Hence, you can readily develop the solid trading strategy in your chart. More importantly, this superb pattern scanner can detect the optimal pattern of its kind. In addition, you can switch on and off individu
    [ MT5 Version ]  [ Kill Zones ]  [ SMT Divergences ] How to trade using Order Blocks:  Click here User Interface Performance:  During testing in the strategy tester, the UI may experience lag. Rest assured, this issue is specific to the testing environment and does not affect the indicator's performance in live trading. Elevate your trading strategy with the  Order Blocks ICT Multi TF  indicator, a cutting-edge tool designed to enhance your trading decisions through advanced order block analys
    Tendencia del oro : se trata de un buen indicador técnico bursátil. El algoritmo del indicador analiza el movimiento del precio de un activo y refleja la volatilidad y las posibles zonas de entrada. Las mejores señales del indicador: - Para VENTA = histograma rojo + puntero rojo CORTO + flecha amarilla de señal en la misma dirección. - Para COMPRA = histograma azul + puntero azul LARGO + flecha de señal aqua en la misma dirección. Ventajas del indicador: 1. El indicador produce señales co
    Una implementación personal de Order Blocks, una estrategia de negociación de posiciones simple pero efectiva. El operador debe ingresar al mercado o buscar operaciones en la dirección del último bloque de orden, si el rango de precios no se ha roto en la dirección opuesta a la ruptura. Los bloques abiertos no se dibujan para mayor claridad. [ Guía de instalación | Guía de actualización | Solución de problemas | FAQ | Todos los productos ] Un bloque abierto alcista es la primera barra alcista d
    Volume Break Oscillator es un indicador que combina el movimiento de precios con las tendencias de volumen en forma de oscilador. Quería integrar el análisis de volumen en mis estrategias, pero siempre me han decepcionado la mayoría de los indicadores de volumen, como OBV, Money Flow Index, A/D, pero también Volume Weighted Macd y muchos otros. Por lo tanto, escribí este indicador para mí mismo, estoy satisfecho con su utilidad y, por lo tanto, decidí publicarlo en el mercado. Características
    Candle Probability Scalper
    Martin Alejandro Bamonte
    Guía de Uso del Candle Probability Scalper Este indicador hace que el scalping sea facil y 100% intuitivo. Candle Probability Scalper te mostrará de un vistazo los datos de los porcentajes de fuerza de compradores y vendedores en TIEMPO REAL , y en la vela actual. Los porcentajes se actualizan en cada tick, con lo que segundo a segundo sabrás lo que están haciendo la mayoría de compradores y vendedores, sin ningún tipo de retrasos, esto te ayudará inmensamente a determinar o confirmar cual es la
    El sistema PRO Renko es un sistema de trading de alta precisión especialmente diseñado para operar gráficos RENKO. Se trata de un sistema universal que se puede aplicar a diversos instrumentos de negociación. El sistema neutraliza eficazmente el llamado ruido de mercado, lo que le brinda acceso a señales de reversión precisas. El indicador es muy fácil de usar y solo tiene un parámetro responsable de la generación de señales. Puede adaptar fácilmente la herramienta a cualquier instrumento come
    ACTUALMENTE 31% DE DESCUENTO Este indicador es una herramienta de transacción única, de alta calidad y asequible porque hemos incorporado una serie de características propias y una fórmula secreta. Con solo un gráfico, da Alertas para los 28 pares de divisas. ¡Imagina cómo mejorarás porque puedes identificar el punto de activación exacto de una nueva tendencia u oportunidad de crecimiento! Basado en nuevos algoritmos subyacentes , hace que sea aún más fácil identificar y confirmar operaciones po
    Otros productos de este autor
    Special offer : ALL TOOLS , just $35 each! New tools   will be   $30   for the   first week   or the   first 3 purchases !  Trading Tools Channel on MQL5 : Join my MQL5 channel to update the latest news from me Comencemos con las características destacadas: El EA está equipado con un FILTRO DE NOTICIAS y un FILTRO RSI. Riesgo bajo (algunos pares de divisas tienen un DrawDown de <10%, incluso 5%). Este EA no utiliza ninguna función de martingala o cuadrícula. El EA puede mostrar zonas visuales p
    Volumatic VIDyA MT5
    Duc Hoan Nguyen
    5 (2)
    Special offer : ALL TOOLS , just $35 each! New tools   will be   $30   for the   first week   or the   first 3 purchases !  Trading Tools Channel on MQL5 : Join my MQL5 channel to update the latest news from me Volumatic VIDYA (Variable Index Dynamic Average) es un indicador avanzado diseñado para rastrear tendencias y analizar la presión de compra-venta en cada fase de una tendencia. Utilizando el Promedio Dinámico de Índice Variable (Variable Index Dynamic Average) como técnica principal de s
    Volumatic VIDyA MT4
    Duc Hoan Nguyen
    5 (3)
    Special offer : ALL TOOLS , just $35 each! New tools   will be   $30   for the   first week   or the   first 3 purchases !  Trading Tools Channel on MQL5 : Join my MQL5 channel to update the latest news from me Volumatic VIDYA (Variable Index Dynamic Average) es un indicador avanzado diseñado para rastrear tendencias y analizar la presión de compra-venta en cada fase de una tendencia. Utilizando el Promedio Dinámico de Índice Variable (Variable Index Dynamic Average) como técnica principal de s
    Special offer : ALL TOOLS , just $35 each! New tools   will be   $30   for the   first week   or the   first 3 purchases !  Trading Tools Channel on MQL5 : Join my MQL5 channel to update the latest news from me El indicador Volumetric Order Blocks Multi Timeframe es una herramienta poderosa diseñada para traders que buscan una comprensión más profunda del comportamiento del mercado al identificar áreas clave de precios donde los principales participantes del mercado acumulan órdenes. Estas área
    Special offer : ALL TOOLS , just $35 each! New tools   will be   $30   for the   first week   or the   first 3 purchases !  Trading Tools Channel on MQL5 : Join my MQL5 channel to update the latest news from me El Indicador de Patrón de Reversión de Tres Barras ofrece una herramienta poderosa para los traders, identificando y destacando automáticamente patrones de reversión de tres barras directamente en el gráfico de precios. Este indicador es un recurso valioso para detectar posibles reversio
    Special offer : ALL TOOLS , just $35 each! New tools   will be   $30   for the   first week   or the   first 3 purchases !  Trading Tools Channel on MQL5 : Join my MQL5 channel to update the latest news from me El indicador Zero Lag MA Trend Levels MT5 con escáner combina la media móvil de cero retraso (ZLMA) con una media móvil exponencial estándar (EMA), brindando a los traders una visión completa del impulso del mercado y los niveles clave de precios. Además, las funciones de escáner y alert
    Special offer : ALL TOOLS , just $35 each! New tools   will be   $30   for the   first week   or the   first 3 purchases !  Trading Tools Channel on MQL5 : Join my MQL5 channel to update the latest news from me ¡Descubre el poder del concepto de Inversion Fair Value Gap (IFVG) de ICT con el Inversion Fair Value Gaps Indicator ! Esta herramienta de última generación lleva los Fair Value Gaps (FVG) al siguiente nivel al identificar y mostrar zonas de FVG invertidas, que son áreas clave de soporte
    Special offer : ALL TOOLS , just $35 each! New tools   will be   $30   for the   first week   or the   first 3 purchases !  Trading Tools Channel on MQL5 : Join my MQL5 channel to update the latest news from me El indicador Supertrend Fakeout es una versión mejorada del clásico indicador Supertrend , diseñado para ofrecer señales de tendencia más fiables. Al incorporar características avanzadas como Fakeout Index Limit y Fakeout ATR Mult , este indicador ayuda a filtrar las falsas inversiones d
    FREE
    Special offer : ALL TOOLS , just $35 each! New tools   will be   $30   for the   first week   or the   first 3 purchases !  Trading Tools Channel on MQL5 : Join my MQL5 channel to update the latest news from me El indicador Volumetric Order Blocks Multi Timeframe es una herramienta poderosa diseñada para traders que buscan una comprensión más profunda del comportamiento del mercado al identificar áreas clave de precios donde los principales participantes del mercado acumulan órdenes. Estas área
    Special offer : ALL TOOLS , just $35 each! New tools   will be   $30   for the   first week   or the   first 3 purchases !  Trading Tools Channel on MQL5 : Join my MQL5 channel to update the latest news from me El Fibonacci Confluence Toolkit Multi-Timeframe es una herramienta avanzada de análisis técnico diseñada para traders profesionales, que ayuda a identificar zonas potenciales de reversión de precios al combinar señales y patrones clave del mercado. Con capacidades de visualización de múl
    Special offer : ALL TOOLS , just $35 each! New tools   will be   $30   for the   first week   or the   first 3 purchases !  Trading Tools Channel on MQL5 : Join my MQL5 channel to update the latest news from me En el volátil panorama de la negociación financiera actual, identificar con precisión los niveles de soporte y resistencia es fundamental para que los traders tomen decisiones informadas. Predictive Ranges Scanner Multi-TF es una herramienta avanzada diseñada para ayudar a los traders a
    Special offer : ALL TOOLS , just $35 each! New tools   will be   $30   for the   first week   or the   first 3 purchases !  Trading Tools Channel on MQL5 : Join my MQL5 channel to update the latest news from me El Indicador de Patrón de Reversión de Tres Barras ofrece una herramienta poderosa para los traders, identificando y destacando automáticamente patrones de reversión de tres barras directamente en el gráfico de precios. Este indicador es un recurso valioso para detectar posibles reversio
    Special offer : ALL TOOLS , just $35 each! New tools   will be   $30   for the   first week   or the   first 3 purchases !  Trading Tools Channel on MQL5 : Join my MQL5 channel to update the latest news from me Presentamos el revolucionario RSI Kernel Optimized with Scanner, una herramienta de vanguardia que redefine el análisis tradicional de RSI al integrar el poderoso algoritmo de Estimación de Densidad de Núcleo (KDE). Este avanzado indicador no solo proporciona información en tiempo real s
    Special offer : ALL TOOLS , just $35 each! New tools   will be   $30   for the   first week   or the   first 3 purchases !  Trading Tools Channel on MQL5 : Join my MQL5 channel to update the latest news from me Presentamos SuperTrend ATR Multiplier with Scanner for MT5 – una herramienta versátil y poderosa diseñada para ayudarte a estar siempre un paso adelante de las tendencias del mercado, con funciones personalizables y alertas en tiempo real. Siguiendo la lógica confiable de SuperTrend de K
    FREE
    Special offer : ALL TOOLS , just $35 each! New tools   will be   $30   for the   first week   or the   first 3 purchases !  Trading Tools Channel on MQL5 : Join my MQL5 channel to update the latest news from me Trendlines with Breaks Scanner es una herramienta de trading de última generación diseñada para ayudar a los traders a identificar tendencias críticas y detectar rupturas en tiempo real. Con líneas de tendencia generadas automáticamente basadas en puntos de pivote, este indicador permite
    Oferta especial : ALL TOOLS , ¡solo $35 cada uno! New tools   will be   $30   for the   first week   or the   first 3 purchases !  Trading Tools Channel on MQL5 : Join my MQL5 channel to update the latest news from me En un entorno de trading volátil, una herramienta de análisis potente e intuitiva puede ayudarte a aprovechar las oportunidades rápidamente. Fibonacci Trend Scanner no solo integra las funciones tradicionales del indicador de Fibonacci y SuperTrend, sino que también amplía la func
    Special offer : ALL TOOLS , just $35 each! New tools   will be   $30   for the   first week   or the   first 3 purchases !  Trading Tools Channel on MQL5 : Join my MQL5 channel to update the latest news from me I. Introducción Market Structure Trend Targets Scanner es una herramienta poderosa para analizar tendencias del mercado, identificar puntos de ruptura y gestionar riesgos mediante un stop loss dinámico. Al rastrear máximos y mínimos anteriores para detectar rupturas, esta herramienta ay
    Special offer : ALL TOOLS , just $35 each! New tools   will be   $30   for the   first week   or the   first 3 purchases !  Trading Tools Channel on MQL5 : Join my MQL5 channel to update the latest news from me El indicador Liquidity Pools es una herramienta avanzada que identifica y marca zonas de liquidez potenciales en el gráfico al analizar áreas altas y bajas con frecuentes toques de mecha, junto con el número de revisitas y el volumen negociado dentro de cada zona. Esta herramienta propor
    SMC System MT4
    Duc Hoan Nguyen
    5 (1)
    Special offer : ALL TOOLS , just $35 each! New tools   will be   $30   for the   first week   or the   first 3 purchases !  Trading Tools Channel on MQL5 : Join my MQL5 channel to update the latest news from me SMC es un enfoque de trading que ayuda a los traders a identificar zonas de liquidez, posiciones de órdenes institucionales y puntos clave de giro del mercado. Al aprovechar los principios de SMC, los traders pueden navegar por el mercado de manera más efectiva, encontrando entradas y sa
    Special offer : ALL TOOLS , just $35 each! New tools   will be   $30   for the   first week   or the   first 3 purchases !  Trading Tools Channel on MQL5 : Join my MQL5 channel to update the latest news from me Descubre el poder de la IA con el SuperTrend AI Clustering con escáner , una herramienta revolucionaria para MetaTrader4 (MT4). Este indicador redefine el análisis del mercado combinando el agrupamiento K-means con el popular indicador SuperTrend, brindando a los traders una ventaja para
    Special offer : ALL TOOLS , just $35 each! New tools   will be   $30   for the   first week   or the   first 3 purchases !  Trading Tools Channel on MQL5 : Join my MQL5 channel to update the latest news from me Maximiza tu ventaja comercial con Follow Line MT5 con escáner, un indicador avanzado basado en la volatilidad diseñado para traders serios. Esta herramienta combina el poder de las Bandas de Bollinger con configuraciones personalizables, ofreciendo información precisa sobre los movimient
    FREE
    Special offer : ALL TOOLS , just $35 each! New tools   will be   $30   for the   first week   or the   first 3 purchases !  Trading Tools Channel on MQL5 : Join my MQL5 channel to update the latest news from me ¡Descubre el poder del concepto de Inversion Fair Value Gap (IFVG) de ICT con el Inversion Fair Value Gaps Indicator ! Esta herramienta de última generación lleva los Fair Value Gaps (FVG) al siguiente nivel al identificar y mostrar zonas de FVG invertidas, que son áreas clave de soporte
    Special offer : ALL TOOLS , just $35 each! New tools   will be   $30   for the   first week   or the   first 3 purchases !  Trading Tools Channel on MQL5 : Join my MQL5 channel to update the latest news from me Descubra el poder del aprendizaje automático avanzado con el Machine Learning Adaptive SuperTrend , un indicador de vanguardia diseñado para adaptarse sin problemas a las condiciones cambiantes del mercado. Al integrar la agrupación en clústeres de k-medias con la metodología SuperTrend,
    Liquidity Pools MT4
    Duc Hoan Nguyen
    5 (1)
    Special offer : ALL TOOLS , just $35 each! New tools   will be   $30   for the   first week   or the   first 3 purchases !  Trading Tools Channel on MQL5 : Join my MQL5 channel to update the latest news from me El indicador Liquidity Pools es una herramienta avanzada que identifica y marca zonas de liquidez potenciales en el gráfico al analizar áreas altas y bajas con frecuentes toques de mecha, junto con el número de revisitas y el volumen negociado dentro de cada zona. Esta herramienta propor
    Oferta especial : ALL TOOLS , ¡solo $35 cada uno! New tools   will be   $30   for the   first week   or the   first 3 purchases !  Trading Tools Channel on MQL5 : Join my MQL5 channel to update the latest news from me Volume Zones Internal Visualizer Multi-Timeframe – la solución definitiva para obtener una vista detallada de la actividad de volumen en marcos de tiempo inferiores mientras operas en un gráfico de marco de tiempo superior. Si buscas una herramienta de análisis de volumen potente
    Special offer : ALL TOOLS , just $35 each! New tools   will be   $30   for the   first week   or the   first 3 purchases !  Trading Tools Channel on MQL5 : Join my MQL5 channel to update the latest news from me El Fibonacci Confluence Toolkit Multi-Timeframe es una herramienta avanzada de análisis técnico diseñada para traders profesionales, que ayuda a identificar zonas potenciales de reversión de precios al combinar señales y patrones clave del mercado. Con capacidades de visualización de múl
    Special offer : ALL TOOLS , just $35 each! New tools   will be   $30   for the   first week   or the   first 3 purchases !  Trading Tools Channel on MQL5 : Join my MQL5 channel to update the latest news from me Supply Demand Retest and Break Multi Timeframe , esta herramienta traza zonas de oferta y demanda basadas en velas de fuerte momentum, permitiéndole identificar estas zonas en múltiples marcos de tiempo utilizando la función   timeframe selector   . Con etiquetas de retest y break, junto
    Special offer : ALL TOOLS , just $35 each! New tools   will be   $30   for the   first week   or the   first 3 purchases !  Trading Tools Channel on MQL5 : Join my MQL5 channel to update the latest news from me Descripción general OA SnR Power es una herramienta poderosa diseñada para ayudar a los traders a identificar y evaluar la fortaleza de los niveles de soporte y resistencia. Al incorporar factores clave como el volumen de operaciones, la frecuencia de rebote y el recuento de pruebas, es
    FREE
    Supertrend Fakeout MT4
    Duc Hoan Nguyen
    4.5 (2)
    Special offer : ALL TOOLS , just $35 each! New tools   will be   $30   for the   first week   or the   first 3 purchases !  Trading Tools Channel on MQL5 : Join my MQL5 channel to update the latest news from me El indicador Supertrend Fakeout es una versión mejorada del clásico indicador Supertrend , diseñado para ofrecer señales de tendencia más fiables. Al incorporar características avanzadas como Fakeout Index Limit y Fakeout ATR Mult , este indicador ayuda a filtrar las falsas inversiones d
    FREE
    Special offer : ALL TOOLS , just $35 each! New tools   will be   $30   for the   first week   or the   first 3 purchases !  Trading Tools Channel on MQL5 : Join my MQL5 channel to update the latest news from me SMC es un enfoque de trading que ayuda a los traders a identificar zonas de liquidez, posiciones de órdenes institucionales y puntos clave de giro del mercado. Al aprovechar los principios de SMC, los traders pueden navegar por el mercado de manera más efectiva, encontrando entradas y sa
    Filtro:
    No hay comentarios
    Respuesta al comentario
    Versión 2.10 2025.02.27
    Optimized dashboard algorithm
    Versión 2.0 2024.12.31
    - Optimize the algorithm to make the indicator a little faster
    - Improve user experience with dashboard
    - Add the feature to Hide/Show indicators on the current chart
    Versión 1.13 2024.11.28
    Add Filling Transparency ratio (%) and Trend Levels Transparency ratio (%) parameters.
    Color will match chart background.
    Versión 1.10 2024.11.01
    Fixed a minor bug related to Alerts