• Información general
  • Comentarios (4)
  • Discusión (3)
  • Novedades

RSI Kernel Optimized MT4 with Scanner

5
Special offer: ALL TOOLS, just $35 each!

New tools will be $30 for the first week or the first 3 purchases

Trading Tools Channel on MQL5: Join my MQL5 channel to update the latest news from me

Presentamos el revolucionario RSI Kernel Optimized with Scanner, una herramienta de vanguardia que redefine el análisis tradicional de RSI al integrar el poderoso algoritmo de Estimación de Densidad de Núcleo (KDE). Este avanzado indicador no solo proporciona información en tiempo real sobre las tendencias del mercado, sino que también incluye un panel de control para escanear múltiples pares de divisas y marcos de tiempo simultáneamente. Veamos por qué esta herramienta es una adición esencial a tu arsenal de trading.

See more MT5 version at: RSI Kernel Optimized with Scanner for MT5

See more products at: https://www.mql5.com/en/users/ndhsfy/seller.

See more information about the indicator at: Enhancing RSI Analysis with Kernel Optimization

See instructions for using the indicator for EA (iCustom) here (with code available): Create EA with RSI Kernel Optimized indicator (iCustom)

Características clave:

  • Detección de pivotes innovadora: Utilizando el algoritmo KDE, este indicador estima la probabilidad de que una vela forme un punto de pivote, ofreciendo a los traders una perspectiva única sobre los cambios de tendencia.
  • Sin re-pintado: Las señales proporcionadas por este indicador se confirman una vez que la vela se cierra, lo que significa que la señal no cambiará después, permitiéndote comenzar tu estrategia con confianza en la apertura de la próxima vela.
  • Algoritmo KDE personalizable: Los traders tienen control total sobre los parámetros de KDE, incluyendo el ancho de banda y las funciones de núcleo, lo que garantiza que el indicador se adapte a diversas condiciones de mercado.
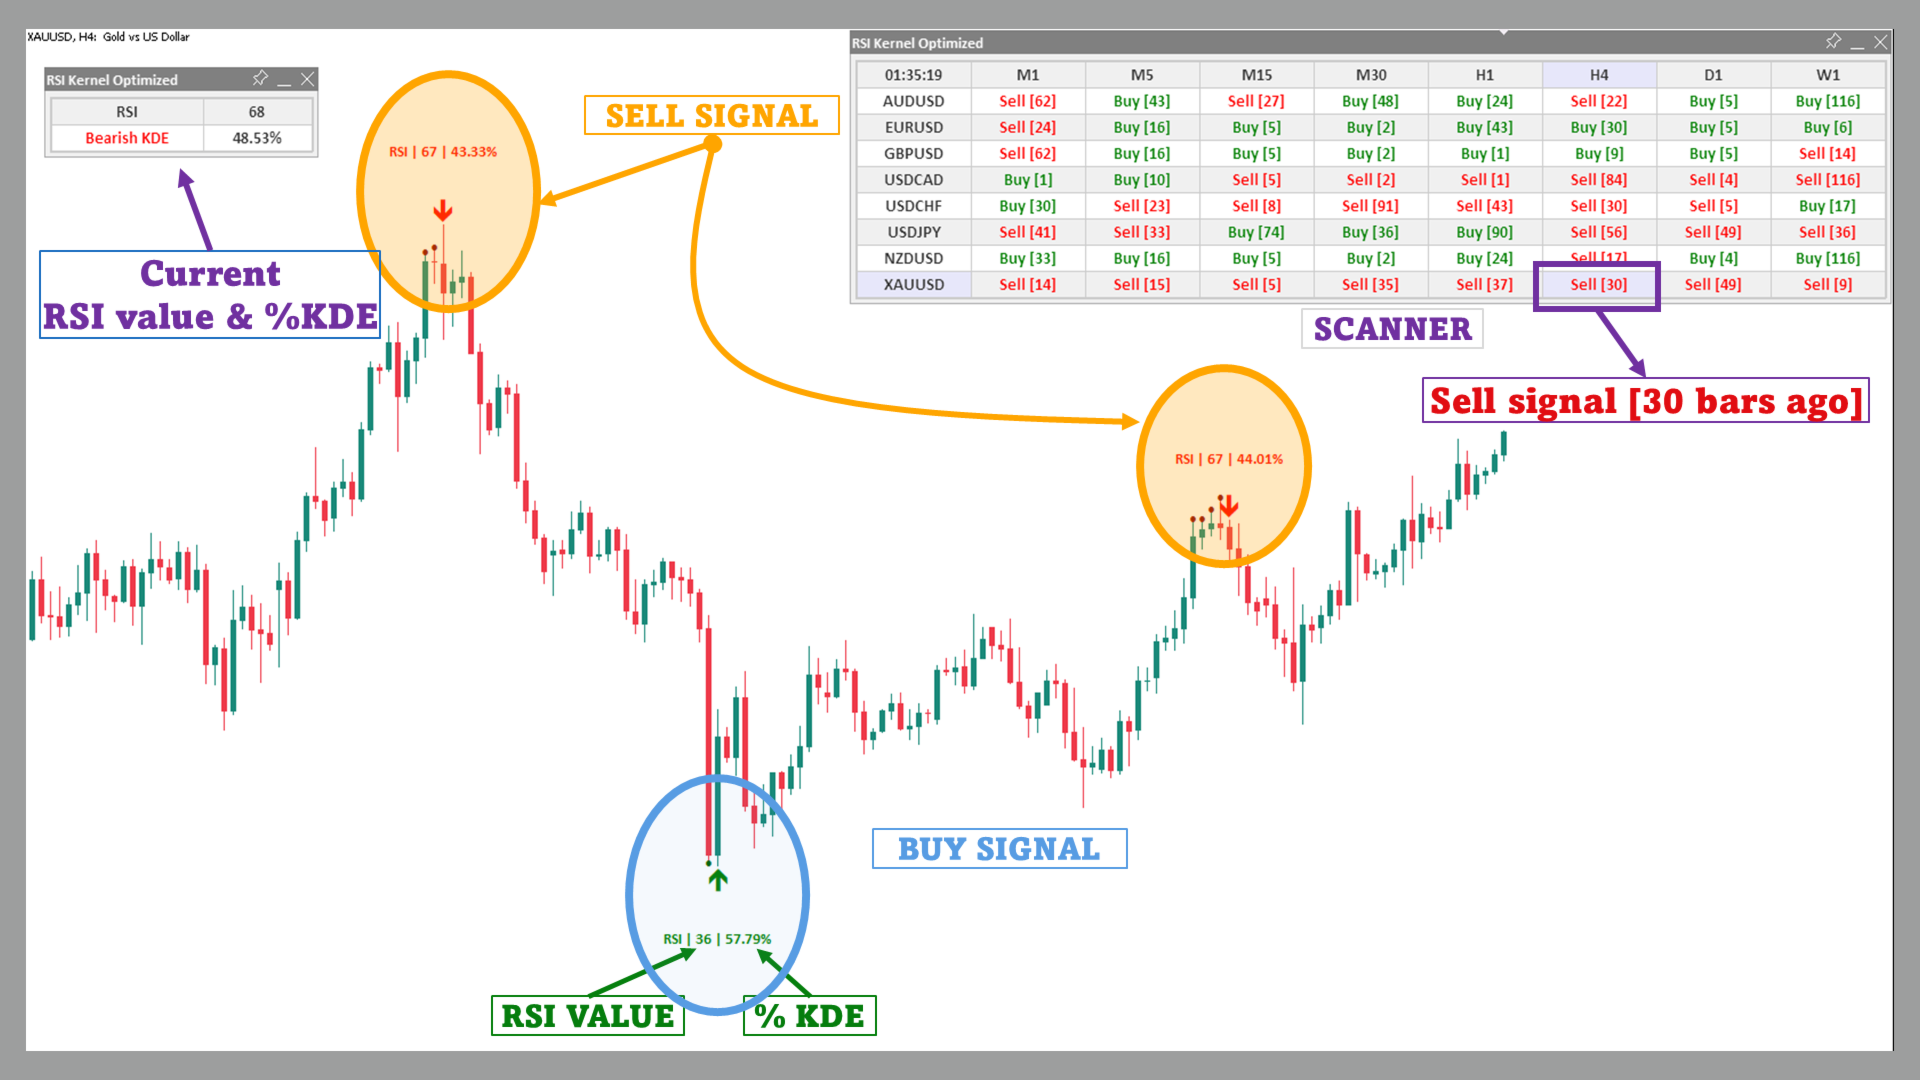
  • Panel de control en tiempo real: Mantente al tanto de los mercados con un panel de control en tiempo real que muestra los valores de RSI y KDE en varios pares de divisas y marcos de tiempo.
  • Alertas de posibles pivotes: Nunca te pierdas un momento clave en el mercado. El indicador te alerta cuando aumenta la probabilidad de un pivote, permitiéndote actuar rápidamente.
  • Visuales mejoradas: El indicador ofrece opciones visuales personalizables, asegurando que tus gráficos se mantengan claros e informativos.

Cómo interpretar el porcentaje de KDE (%):

El porcentaje de KDE es una métrica crucial que mide cuán cerca está el valor actual de RSI del array de KDE. Este porcentaje ayuda a los traders a evaluar la probabilidad de que se forme un punto de pivote:

  • Bajo porcentaje de KDE: Indica una baja probabilidad de un pivote, lo que sugiere que la tendencia actual puede continuar.
  • Moderado porcentaje de KDE: Señala una mayor probabilidad de un pivote, incitando a los traders a buscar más confirmaciones.
  • Alto porcentaje de KDE: Sugiere fuertemente que un pivote es inminente, alineándose con condiciones de sobrecompra o sobreventa en el análisis tradicional de RSI. Estos son momentos críticos para entrar o salir de una operación.

Cómo funciona:

El RSI Kernel Optimized calcula el RSI para cada vela e identifica los puntos de pivote potenciales. Utilizando el algoritmo KDE, crea distribuciones de probabilidad tanto para los RSIs de pivote altos como bajos, luego determina la probabilidad de que una vela forme un pivote. Este innovador proceso permite a los traders recibir alertas oportunas sobre posibles reversiones o continuaciones de tendencia, convirtiéndose en una herramienta invaluable para tomar decisiones de trading precisas.

  • Cálculo de RSI: El indicador calcula el RSI de cada vela y los almacena en arrays para los pivotes altos y bajos.
  • Cálculo de KDE: Aplica el algoritmo KDE a ambos arrays de pivotes, utilizando funciones de núcleo personalizables (Uniforme, Gaussiano o Sigmoide) y configuraciones de ancho de banda.
  • Detección de pivotes: Cuando los valores de KDE superan el umbral establecido, el indicador traza flechas en el gráfico, indicando posibles pivotes alcistas o bajistas.

¿Qué lo hace único?

A diferencia de los indicadores RSI tradicionales, el RSI Kernel Optimized with Scanner utiliza el algoritmo KDE para predecir puntos de pivote en tiempo real. Una vez que la vela se cierra, la señal se confirma y el indicador no se repinta, lo que significa que puedes comenzar tu estrategia de trading de manera confiada en la apertura de la próxima vela si aparece una señal. El panel integrado mejora esto aún más al proporcionar una vista general de los valores de RSI y KDE en varios pares de divisas y marcos de tiempo, lo que permite a los traders monitorear el mercado de manera eficiente.
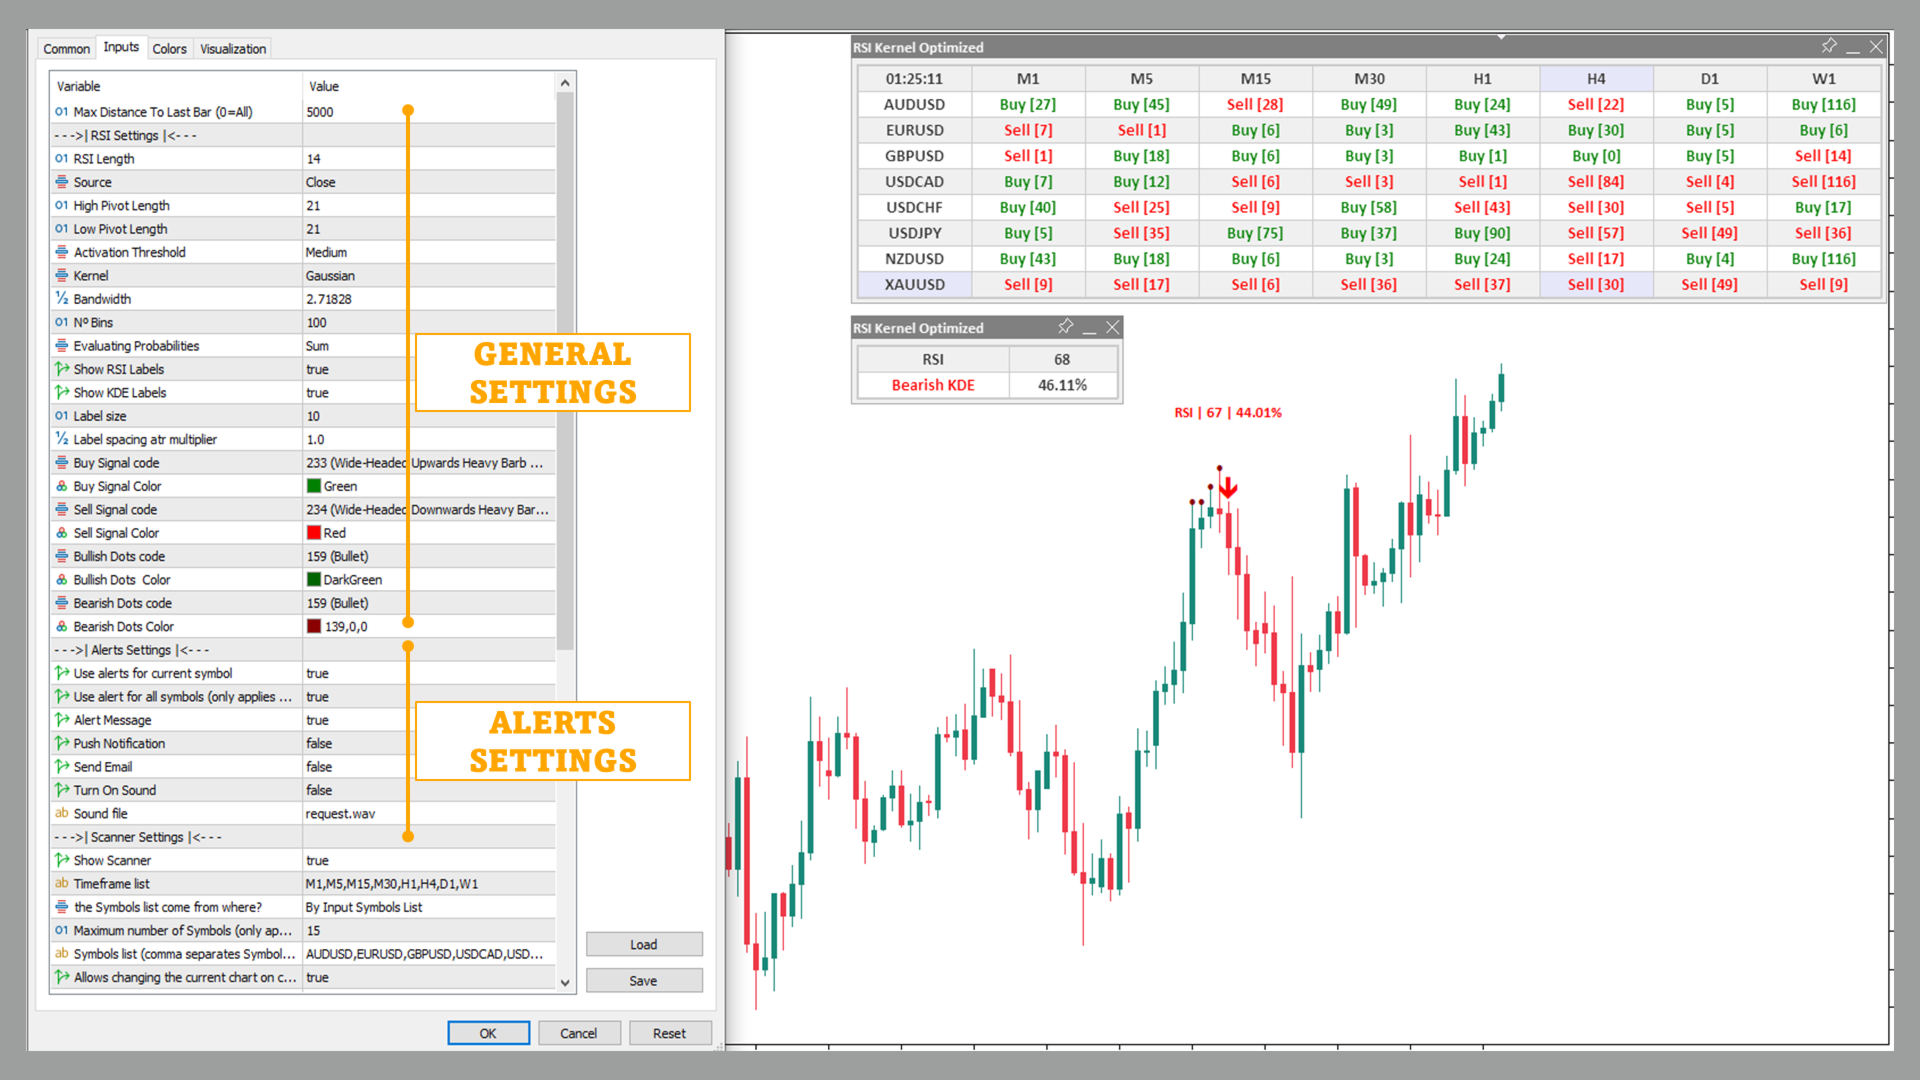
Configuraciones:

  • Configuraciones de RSI: Ajusta la longitud y la fuente del RSI para que se adapten a tu estrategia de trading.
  • Longitud de pivotes: Personaliza la longitud de los pivotes para detectar tanto pivotes altos como bajos con precisión.
  • Parámetros de KDE: Ajusta el algoritmo KDE con opciones de ancho de banda, función de núcleo y número de bins para una flexibilidad máxima.
  • Umbral de activación: Determina el número de flechas que se muestran. Configuraciones más altas resultarán en más flechas dibujadas.
  • Función de núcleo: La función de núcleo para el cálculo de KDE. La Gaussiana es un núcleo comúnmente utilizado y está basada en la distribución normal.
  • Ancho de banda: Este ajuste determina la suavidad de la salida de la función KDE.
  • Nº de bins: El número de elementos que tendrá el array de probabilidad de KDE. Configuraciones más altas resultarán en mayor precisión.

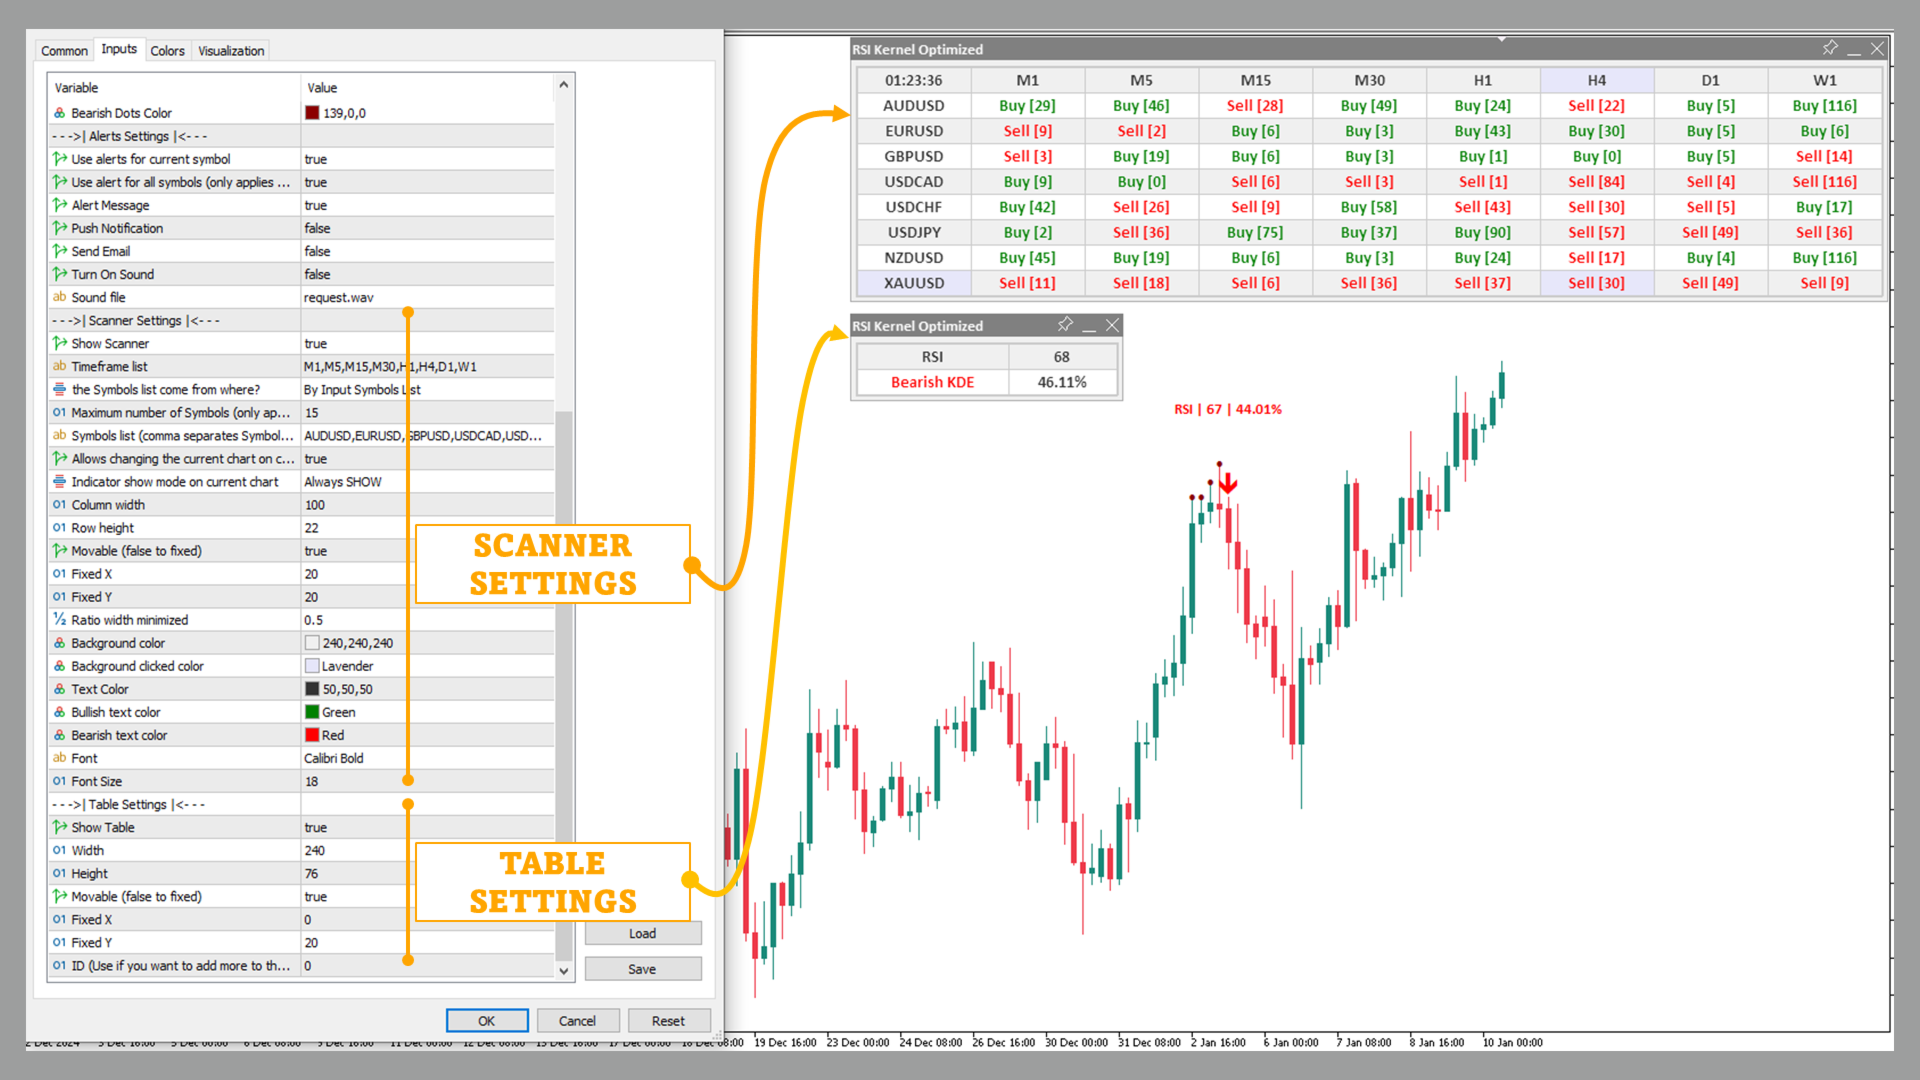
Panel de control de RSI y KDE:

El panel integrado permite a los traders escanear múltiples pares de divisas y marcos de tiempo, proporcionando valores de RSI y KDE en tiempo real para cada uno. Esta función facilita la detección de oportunidades potenciales en diferentes mercados de un vistazo.

RSI Kernel Optimized with Scanner es más que un simple indicador RSI; es una poderosa herramienta de detección de pivotes que integra un análisis estadístico avanzado para ofrecer una visión más clara de los movimientos del mercado. Con su función sin re-pintado, puedes confiar en que una vez que se muestra una señal, esta permanecerá inalterada, lo que te permite realizar entradas comerciales de manera oportuna y confiable. Ya seas un trader diario o un inversor a largo plazo, este indicador te proporciona las ideas que necesitas para tomar decisiones comerciales informadas.


    Comentarios 4
    totee toto
    54
    totee toto 2025.02.17 12:07 
     

    Interest indicator. Help for my trading.Well done.

    Yusuf Hamzah
    741
    Yusuf Hamzah 2024.12.17 14:03 
     

    Unique. RSI + KDE. Scientifically sound. The concept provides a good unbiased additional confirmation of a possible reversal. Well done.

    danmar
    1795
    danmar 2024.12.04 06:11 
     

    i buy this one because i read the review of XANKEEZ on the other excellent product that i bought Volumetric Order Blocks MT4 Multi Timeframe and it is also a great one which works very well with volumetric : Well Done and today i upload the new version with new functionalities that i ask yesterday 3 december for future update! so quick and for me he makes my chart clearer and with less space taken for the MTF with use of Y negative to hide upper part of title Then THANK YOU A LOT. few sellers take really the asking of their buyers (even i understand that all asking could not be taken). Here it is a very quick update , user support is excellent, thank you again.

    Productos recomendados
    Owl smart levels
    Sergey Ermolov
    4.24 (37)
    Versión MT5  |   FAQ El   Indicador Owl Smart Levels   es un sistema comercial completo dentro de un indicador que incluye herramientas de análisis de mercado tan populares como   los fractales avanzados de Bill Williams , Valable ZigZag que construye   la estructura de onda correcta   del mercado y   los niveles de Fibonacci   que marcan los niveles exactos de entrada. en el mercado y lugares para tomar ganancias. Descripción detallada de la estrategia Instrucciones para trabajar con el indi
    Noize Absorption Index MT4
    Ekaterina Saltykova
    5 (1)
    Noize Absorption Index - is the manual trading system that measures the difference of pressure between bears forces and bulls forces. Green line - is a noize free index that showing curent situation. Zero value of index shows totally choppy/flat market.Values above zero level shows how powerfull bullish wave is and values below zero measures bearish forces.Up arrow appears on bearish market when it's ready to reverse, dn arrow appears on weak bullish market, as a result of reverse expectation. S
    PABT Pattern Indicator - it's classical system one of the signal patterns. Indicator logic - the Hi & Lo of the bar is fully within the range of the preceding bar, look to trade them as pullback in trend. In the way if indicator found PABT pattern it's drawing two lines and arrow what showing trend way.  - First line - it's entry point and drawing at: 1. On the high of signal bar or on middle of the signal bar (depending from indicator mode) for buy; 2. On the low of signal bar or on middle of t
    Infinity Trend Pro
    Yaroslav Varankin
    1 (1)
    This is a trend indicator without redrawing Developed instead of the binary options strategy (by the color of the Martingale candlestick) Also works well in forex trading When to open trades (binary options) A signal will appear in the place with a candle signaling the current candle It is recommended to open a deal for one candle of the current timeframe M1 and M5 When a blue dot appears, open a deal up When a red dot appears, open a trade down. How to open trades on Forex. When a signal is rec
    The Th3Eng PipFinite indicator is based on a very excellent analysis of the right trend direction with perfect custom algorithms. It show the true direction and the best point to start trading. With StopLoss point and Three Take Profit points. Also it show the right pivot of the price and small points to order to replace the dynamic support and resistance channel, Which surrounds the price. And Finally it draws a very helpful Box on the left side on the chart includes (take profits and Stop loss
    Special offer : ALL TOOLS , just $35 each! New tools   will be   $30   for the   first week   or the   first 3 purchases !  Trading Tools Channel on MQL5 : Join my MQL5 channel to update the latest news from me La herramienta Breakaway Fair Value Gaps (FVG) es una solución innovadora diseñada para que los traders identifiquen áreas donde el precio se ha alejado del equilibrio, proporcionando conocimientos detallados sobre las probabilidades de mitigación. Esta herramienta no solo destaca señale
    Trade with Gann on your side!! MASTER CIRCLE 360 CIRCLE CHART, originally created by Gann admitted that this is “The Mother of all charts”. It is one of the last studies that this great trader left for us. The numeric tab le is apparently quite simple like all the tables and is based on square numbers, the SQUARE OF 12 and is by evolution, one of the most important square numbers. Here we can find CYCLE, PRICE AND TIME thanks to angles and grades, to show past and future support and resistance.
    EZZ Elite Zig Zag is an indicator for the MetaTrader 4 terminal. This indicator traces the peak of the trend based on the market reversal, thus showing various opportunities in the financial market. EZZ Elite Zig Zag is a visual tool, intuitive, and easy to understand and use.  Test it Yourself by Downloading it for Free. Author Paulo Rocha all rights reserved
    A classic indicator with advanced features for more accurate display of the market situation. All settings of all moving averages are available, such as the moving average type and the priced used in its calculation. It is also possible to change the appearance of the indicator - line or histogram. Additional parameters provide the ability of fine tuning. Distinctive features Does not redraw. Additional parameters for fine tuning. Displayed as a line or as a histogram. Works on all timeframes a
    The indicator displays the data of the Stochastic oscillator from a higher timeframe on the chart. The main and signal lines are displayed in a separate window. The stepped response is not smoothed. The indicator is useful for practicing "manual" forex trading strategies, which use the data from several screens with different timeframes of a single symbol. The indicator uses the settings that are identical to the standard ones, and a drop-down list for selecting the timeframe. Indicator Paramet
    Alpha Trend sign has been a very popular trading tool in our company for a long time. It can verify our trading system and clearly indicate trading signals, and the signals will not drift. Main functions: Based on the market display of active areas, indicators can be used to intuitively determine whether the current market trend belongs to a trend market or a volatile market. And enter the market according to the indicator arrows, with green arrows indicating buy and red arrows indicating se
    PinBar Hunter
    Dmitrijs Ivanajevs
    PinBar Hunter — Your reliable assistant for trading the Pin Bar pattern! High Accuracy Signals This indicator automatically identifies bullish and bearish pin bars, instantly displaying clear arrows on the chart for convenient entry into trades. Flexible Signal Filters Utilize built-in time and Moving Average (MA) filters to receive only the highest quality and most reliable trading signals. Convenient Information Panel All indicator settings and current statuses are always at han
    El indicador "Auto FIBO Pro" de Crypto_Forex es una gran herramienta auxiliar para operar. - El indicador calcula y coloca automáticamente en el gráfico los niveles de Fibonacci y las líneas de tendencia locales (color rojo). - Los niveles de Fibonacci indican áreas clave donde el precio puede revertirse. - Los niveles más importantes son 23,6 %, 38,2 %, 50 % y 61,8 %. - Puede usarlo para scalping de reversión o para operar en cuadrículas de zonas. - También existen muchas oportunidades para m
    Distinctive
    Tatiana Savkevych
    Distinctive is a forex trending arrow indicator for identifying potential entry points. I like it, first of all, because it has a simple mechanism of work, adaptation to all time periods and trading tactics. Created on the basis of a regression channel with filters. Plotting the Lawrence indicator signals on a price function chart using a mathematical approach. How it works - when the price breaks out in the overbought / oversold zone (channel levels), a buy or sell signal is generated. Everyt
    Master Scalping M1 es un indicador innovador que utiliza un algoritmo para determinar la tendencia de forma rápida y precisa. El indicador calcula el tiempo de apertura y cierre de posiciones, los algoritmos del indicador le permiten encontrar los momentos ideales para ingresar a una operación (comprar o vender un activo), lo que aumenta el éxito de las transacciones para la mayoría de los comerciantes. Beneficios del indicador: Fácil de usar, no sobrecarga el gráfico con información innecesari
    Trendiness Index
    Libertas LLC
    5 (3)
    "The trend is your friend" is one of the best known sayings in investing, because capturing large trendy price movements can be extremely profitable. However, trading with the trend is often easier said than done, because many indicators are based on price reversals not trends. These aren't very effective at identifying trendy periods, or predicting whether trends will continue. We developed the Trendiness Index to help address this problem by indicating the strength and direction of price trend
    Bermaui Bands
    Muhammad Elbermawi
    4.97 (67)
    Bermaui Bands (BB) es una herramienta de análisis técnico que ayuda a filtrar entre los movimientos de precios de rango y tendencia. La idea detrás de este indicador se puede explicar en los siguientes pasos: Calcule la desviación estándar como un oscilador que se mueve entre 0 y 100. Lo llamaré porcentaje de desviación de Bermaui (BD%). Si "BD%" está cerca de cero, la volatilidad está en su punto máximo. Además, si "BD%" está cerca de 100, la volatilidad es muy baja. Una alta volatilidad signif
    Trend Oscillator es un indicador avanzado personalizado de Crypto_Forex, ¡una herramienta de trading eficiente! - Se utiliza un nuevo método de cálculo avanzado: 20 opciones para el parámetro "Precio para el cálculo". - El oscilador más suave jamás desarrollado. - Color verde para tendencias alcistas, color rojo para tendencias bajistas. - Valores de sobreventa: por debajo de 5, valores de sobrecompra: por encima de 95. - Hay muchas oportunidades para mejorar incluso las estrategias estándar c
    The Penta-O is a 6-point retracement harmonacci pattern which usually precedes big market movements. Penta-O patterns can expand and repaint quite a bit. To make things easier this indicator implements a twist: it waits for a donchian breakout in the right direction before signaling the trade. The end result is an otherwise repainting indicator with a very reliable trading signal. The donchian breakout period is entered as an input. [ Installation Guide | Update Guide | Troubleshooting | FAQ | A
    Cosmic Diviner X Planet
    Olena Kondratenko
    4 (2)
    This unique multi-currency strategy simultaneously determines the strength of trends and market entry points, visualizing this using histograms on the chart. The indicator is optimally adapted for trading on the timeframes М5, М15, М30, Н1. For the convenience of users, the indicator renders the entry point (in the form of an arrow), recommended take profit levels (TP1, TP2 with text labels) and the recommended Stop Loss level. The take profit levels (TP1, TP2) are automatically calculated for
    Los indicadores [ZhiBiCCI] son ​​adecuados para todos los ciclos de uso y también son adecuados para todas las variedades de mercado. [ZhiBiCCI] La línea verde sólida es una reversión de la divergencia alcista. La línea de puntos verde es una divergencia alcista clásica. [ZhiBiCCI] La línea continua hacia el rojo es una divergencia bajista inversa. La línea roja punteada es una divergencia bajista clásica. [ZhiBiCCI] puede configurarse en los parámetros (Alerta, Enviar correo, Enviar notifica
    What are Heiken Ashi Candles? Heiken Ashi, derived from the Japanese term 'Heikin Ashi,' translates to average price bars. It's an indicator depicting price bars on a chart. Formula for Heiken Ashi candles: - Heiken Ashi opening price: (previous candle's opening + closing price) / 2 - Closing price Heiken Ashi: (opening + high + low + closing) / 4 - Heiken Ashi peak: Max of high, opening, or closing price - Heiken Ashi bottom price: Min of low, opening, or closing price How to Read Heiken A
    Mirror
    Stanislav Korotky
    This indicator predicts rate changes based on the chart display principle. It uses the idea that the price fluctuations consist of "action" and "reaction" phases, and the "reaction" is comparable and similar to the "action", so mirroring can be used to predict it. The indicator has three parameters: predict - the number of bars for prediction (24 by default); depth - the number of past bars that will be used as mirror points; for all depth mirroring points an MA is calculated and drawn on the ch
    Stepping Trend
    Mpendulo Chiliza
    The Stepping Trend Indicator     The Steppi ng Trend indicator uses the  average true range  (ATR indicator) in its calculation. This gives you control to set your own average true range period, I set the Default as 10.   Indicator Details. Green Arrow Up: This means you are at the starting point of a new bullish trend, it’s time to buy.   Red  Arrow  Down : This means you are at the starting point of a new  bearish  trend, it’ s time to sell .   What if you miss the Arrow Signal?   No prob
    Super Reversal Pattern
    Parfait Mujinga Ndalika
    Super Reversal Pattern Indicator Unlock the power of advanced pattern recognition with our Super Reversal Pattern Indicator. Designed for traders seeking precision and reliability, this indicator identifies one of the most effective reversal patterns in technical analysis, offering a significant edge in your trading strategy. Key Features: Non-Repainting Accuracy: Enjoy the confidence of non-repainting technology. Once a Super Reversal Pattern is detected, it remains static, providing consiste
    Signal trend indicator. Detects the direction of the trend and is coloured accordingly.  Has built in audible and visual alerts when trends change. Can send notifications to your phone or email. Allows Trend and Counter-Trend trading. Works on all timeframes, all currency pairs, metals, indices and cryptocurrencies. Can be used with binary options. Distinctive features No re-drawing; Simple and clear settings; Four types of alerts; Works on all timeframes and all trading tools; Suitable
    For sure, this indicator has become very popular amongst traders. Through coding this indicator will give you the most accurate levels possible for your trading analysis. We have also added in the ability for you to receive alerts when the price breaks above or below a Support or Resistance lines! HOW TO USE The red rectangles represent your resistance/supply zone. The green rectangles represent your support/demand zone.  BONUS FEATURES We coded this indicator with the ability to switch between
    Buy and sell zones
    Evgeniy Zhdan
    5 (2)
    Indicador para determinar plano y tendencia. Si el precio está por debajo de cualquiera de los dos histogramas y dos líneas (rojo y azul), esta es una zona de venta. Al comprar esta versión del indicador, la versión MT4 para una cuenta real y una demo, ¡como regalo (para recibir, escríbame un mensaje privado)! Si el precio está por encima de cualquiera de los dos histogramas y dos líneas (rojo y azul), esta es una zona de compra. Versión MT4:   https://www.mql5.com/en/market/product/3793 Si
    Atomic Analyst
    Issam Kassas
    5 (2)
    En primer lugar, vale la pena enfatizar que este Indicador de Trading no repinta, no redibuja y no se retrasa, lo que lo hace ideal tanto para el trading manual como para el automatizado. Manual del usuario: configuraciones, entradas y estrategia. El Analista Atómico es un Indicador de Acción del Precio PA que utiliza la fuerza y el impulso del precio para encontrar una mejor ventaja en el mercado. Equipado con filtros avanzados que ayudan a eliminar ruidos y señales falsas, y aumentan el poten
    Trend Monitor
    Pavel Zamoshnikov
    4 (4)
    The indicator generates early signals basing on ADX reading data combined with elements of price patterns. Works on all symbols and timeframes. The indicator does not redraw its signals. You see the same things on history and in real time. For better visual perception signals are displayed as arrows (in order not to overload the chart). Features Easy to use. Filter configuration only requires selection of sensitivity in the " Sensitivity of the indicator " input. Signals can be filtered using
    Los compradores de este producto también adquieren
    Gann Made Easy
    Oleg Rodin
    4.8 (116)
    Gann Made Easy es un sistema de comercio de Forex profesional y fácil de usar que se basa en los mejores principios de comercio utilizando la teoría del Sr. W. D. Gann. El indicador proporciona señales precisas de COMPRA y VENTA, incluidos los niveles de Stop Loss y Take Profit. Puede comerciar incluso sobre la marcha utilizando notificaciones PUSH. ¡Por favor, póngase en contacto conmigo después de la compra! ¡Compartiré mis consejos comerciales con usted y excelentes indicadores de bonificació
    Gold Stuff
    Vasiliy Strukov
    4.86 (253)
    Gold Stuff: un indicador de tendencia diseñado específicamente para el oro, también se puede usar en cualquier instrumento financiero. El indicador no se vuelve a dibujar ni se retrasa. El marco de tiempo recomendado es H1. Este indicador está escrito por EA Gold Stuff Advisor, puede encontrarlo en mi perfil.  Puede obtener una copia gratuita de nuestro indicador Strong Support y Trend Scanner, por favor envíe un mensaje privado. ¡a mí! IMPORTANTE! Póngase en contacto conmigo inmediatamente de
    Enigmera
    Ivan Stefanov
    5 (7)
    ENIGMERA: El núcleo del mercado Importante: La demostración de MQL5.com se ejecuta en el Strategy Tester y puede no reflejar completamente la funcionalidad de Enigmera. Consulta la descripción, las capturas de pantalla y el video para más detalles. ¡No dudes en contactarme si tienes alguna pregunta! El código del indicador ha sido completamente reescrito. La versión 3.0 añade nuevas funcionalidades y elimina errores acumulados desde el inicio del indicador. Introducción Este indicador y sistem
    M1 Arrow
    Oleg Rodin
    5 (17)
    Una estrategia intradía basada en dos principios fundamentales del mercado. El algoritmo se basa en el análisis de volúmenes y ondas de precios utilizando filtros adicionales. El algoritmo inteligente del indicador da una señal solo cuando dos factores de mercado se combinan en uno. El indicador calcula ondas de cierto rango en el gráfico M1 utilizando los datos del marco de tiempo más alto. Y para confirmar la onda, el indicador utiliza el análisis por volumen. Este indicador es un sistema come
    Scalper Inside PRO
    Alexey Minkov
    4.76 (63)
    !SPECIAL SALE! An exclusive indicator that utilizes an innovative algorithm to swiftly and accurately determine the market trend. The indicator automatically calculates opening, closing, and profit levels, providing detailed trading statistics. With these features, you can choose the most appropriate trading instrument for the current market conditions. Additionally, you can easily integrate your own arrow indicators into Scalper Inside Pro to quickly evaluate their statistics and profitability
    Te presento un excelente indicador técnico: Grabber, que funciona como una estrategia de trading "todo incluido" lista para usar. En un solo código se integran potentes herramientas de análisis técnico del mercado, señales de trading (flechas), funciones de alertas y notificaciones push. Cada comprador de este indicador recibe además de forma gratuita: Grabber Utility: una herramienta para la gestión automática de órdenes abiertas Video manual paso a paso: cómo instalar, configurar y operar con
    Dynamic Forex28 Navigator
    Bernhard Schweigert
    5 (5)
    Dynamic Forex28 Navigator: la herramienta de trading de Forex de última generación. ACTUALMENTE CON UN 49 % DE DESCUENTO. Dynamic Forex28 Navigator es la evolución de nuestros indicadores populares de larga data, que combina el poder de tres en uno: Indicador avanzado Currency Strength28 (695 reseñas) + Indicador avanzado Currency IMPULSE con ALERT (520 reseñas) + Señales combinadas CS28 (bonificación). Detalles sobre el indicador https://www.mql5.com/en/blogs/post/758844 ¿Qué ofrece el indi
    Scalper Vault
    Oleg Rodin
    5 (29)
    Scalper Vault es un sistema profesional de reventa que le brinda todo lo que necesita para una reventa exitosa. Este indicador es un sistema comercial completo que puede ser utilizado por operadores de divisas y opciones binarias. El marco de tiempo recomendado es M5. El sistema le proporciona señales de flecha precisas en la dirección de la tendencia. También le proporciona señales superiores e inferiores y niveles de mercado de Gann. Los indicadores proporcionan todo tipo de alertas, incluidas
    FX Volume
    Daniel Stein
    4.59 (34)
    FX Volume: Experimente el Verdadero Sentimiento del Mercado desde la Perspectiva de un Bróker Resumen Rápido ¿Desea llevar su estrategia de trading a otro nivel? FX Volume ofrece información en tiempo real sobre cómo los traders minoristas y los brókers están posicionados, mucho antes de que aparezcan informes retrasados como el COT. Ya sea que busque beneficios consistentes o simplemente quiera una ventaja más profunda en los mercados, FX Volume le ayuda a identificar desequilibrios important
    Trend Screener
    STE S.S.COMPANY
    4.78 (93)
    Indicador de tendencia, solución única e innovadora para el comercio y filtrado de tendencias con todas las funciones de tendencias importantes integradas en una sola herramienta. Es un indicador 100% sin repintar de marcos temporales y monedas múltiples que se puede usar en todos los símbolos/instrumentos: divisas, materias primas, criptomonedas, índices y acciones. OFERTA POR TIEMPO LIMITADO: El indicador de detección de soporte y resistencia está disponible por solo 50$ y de por vida. (Precio
    Golden Trend Indicator
    Noha Mohamed Fathy Younes Badr
    4.9 (10)
    Golden Trend indicator  is The best indicator for predicting trend movement this indicator never lags and never repaints and never back paints    and give  arrow buy and sell    before the candle appear  and it will help you and  will make your trading decisions clearer its work on all currencies and  gold and crypto and all time frame This unique  indicator uses very secret algorithms to catch the  trends, so you can trade using this indicator and see the trend clear on charts  manual guide and
    FX Power MT4 NG
    Daniel Stein
    4.94 (18)
    FX Power: Analiza la Fuerza de las Divisas para Decisiones de Trading Más Inteligentes Descripción General FX Power es tu herramienta esencial para comprender la fuerza real de las principales divisas y el oro en cualquier condición de mercado. Al identificar divisas fuertes para comprar y débiles para vender, FX Power simplifica las decisiones de trading y descubre oportunidades de alta probabilidad. Ya sea que quieras seguir las tendencias o anticipar reversiones utilizando valores extremos
    Apollo Secret Trend es un indicador de tendencia profesional que se puede utilizar para encontrar tendencias en cualquier par y período de tiempo. El indicador puede convertirse fácilmente en su principal indicador comercial que puede usar para detectar tendencias del mercado sin importar qué par o marco de tiempo prefiera operar. Al usar un parámetro especial en el indicador, puede adaptar las señales a su estilo comercial personal. El indicador proporciona todo tipo de alertas, incluidas las n
    - Lifetime update free Contact me for instruction, add group and any questions! Related Products:  Bitcoin Expert , Gold Expert - Non-repaint - I just sell my products in Elif Kaya profile, any other websites are stolen old versions, So no any new updates or support. Introduction The breakout and retest strategy is traded support and resistance levels. it involves price breaking through a previous level.  The break and retest strategy is designed to help traders do two main things, the first is
    Algo Pumping MT4
    Ihor Otkydach
    5 (2)
    PUMPING STATION – Tu estrategia personal "todo incluido" Te presentamos PUMPING STATION, un indicador revolucionario para Forex que transformará tu forma de operar en una experiencia emocionante y eficaz. No es solo un asistente, sino un sistema de trading completo con potentes algoritmos que te ayudarán a operar de forma más estable. Al comprar este producto, recibes GRATIS: Archivos de configuración exclusivos: para una configuración automática y un rendimiento óptimo. Manual en video paso a p
    Easy Breakout
    Mohamed Hassan
    5 (10)
    After your purchase, feel free to contact me for more details on how to receive a bonus indicator called VFI, which pairs perfectly with Easy Breakout for enhanced confluence!   Easy Breakout is a powerful price action trading system built on one of the most popular and widely trusted strategies among traders: the Breakout strategy ! This indicator delivers crystal-clear Buy and Sell signals based on breakouts from key support and resistance zones. Unlike typical breakout indicators, it levera
    TPSproTREND PrO
    Roman Podpora
    4.68 (25)
    VERSION MT5        —        ИНСТРУКЦИЯ RUS           —        INSTRUCTIONS  ENG Funciones principales: Señales de entrada precisas ¡SIN RENDERIZACIÓN! Si aparece una señal, ¡sigue siendo relevante! Esta es una diferencia importante con respecto a los indicadores de redibujo, que pueden proporcionar una señal y luego cambiarla, lo que puede provocar una pérdida de fondos depositados. Ahora puedes ingresar al mercado con mayor probabilidad y precisión. También existe la función de colorear las ve
    Gold Venamax MT4
    Sergei Linskii
    5 (1)
    Gold Venamax : este es el mejor indicador técnico de acciones. El algoritmo del indicador analiza el movimiento del precio de un activo y refleja la volatilidad y las posibles zonas de entrada. Características del indicador: Este es un súper indicador con Magia y dos bloques de flechas de tendencia para un comercio cómodo y rentable. El botón rojo para cambiar de bloque se muestra en el gráfico. La magia se establece en la configuración del indicador, por lo que puede instalar el indicador en
    Volatility Trend System - un sistema de comercio que da señales para las entradas. El sistema de volatilidad da señales lineales y puntuales en la dirección de la tendencia, así como señales para salir de ella, sin redibujar ni demoras. El indicador de tendencia monitorea la dirección de la tendencia a mediano plazo, muestra la dirección y su cambio. El indicador de señal se basa en cambios en la volatilidad y muestra entradas en el mercado. El indicador está equipado con varios tipos de alert
    ¡Actualmente 20% OFF ! ¡La mejor solución para cualquier novato o trader experto! Este software funciona con 28 pares de divisas. Se basa en 2 de nuestros principales indicadores (Advanced Currency Strength 28 y Advanced Currency Impulse). Proporciona una gran visión general de todo el mercado de divisas. Muestra los valores de Advanced Currency Strength, la velocidad de movimiento de las divisas y las señales para 28 pares de divisas en todos los (9) marcos temporales. Imagine cómo mejorará
    Lux Trend
    Mohamed Hassan
    5 (3)
    After purchase, please contact me to get your trading tips + more information for a great bonus!   Lux Trend is a professional strategy based on using Higher Highs and Lower Highs to identify and draw Trendline Breakouts! Lux Trend  utilizes two Moving Averages to confirm the overall trend direction before scanning the market for high-quality breakout opportunities, ensuring more accurate and reliable trade signals. This is a proven trading system used by real traders worldwide, demonstrating
    TPSpro RFI Levels
    Roman Podpora
    4.85 (27)
    INSTRUCCIONES      RUSO  -  ING     Se recomienda utilizar con un indicador.   -    TPSpro   TENDENCIA PRO -   Versión MT5 Un elemento clave en el trading son las zonas o niveles desde los que se toman las decisiones de compra o venta de un instrumento de trading. A pesar de los intentos de los principales actores de ocultar su presencia en el mercado, inevitablemente dejan rastros. Nuestra tarea era aprender a identificar estos rastros e interpretarlos correctamente. Funciones principales: ¡Mo
    IX Power MT4
    Daniel Stein
    4.75 (8)
    IX Power: Descubre perspectivas de mercado para índices, materias primas, criptomonedas y forex Descripción general IX Power es una herramienta versátil diseñada para analizar la fortaleza de índices, materias primas, criptomonedas y símbolos de forex. Mientras que FX Power ofrece la máxima precisión para pares de divisas mediante el uso de datos de todos los pares disponibles, IX Power se centra exclusivamente en los datos del mercado del símbolo subyacente. Esto convierte a IX Power en una e
    Introduction to X3 Chart Pattern Scanner X3 Cherart Pattern Scanner is the non-repainting and non-lagging indicator detecting X3 chart patterns including Harmonic pattern, Elliott Wave pattern, X3 patterns, and Japanese Candlestick patterns. Historical patterns match with signal patterns. Hence, you can readily develop the solid trading strategy in your chart. More importantly, this superb pattern scanner can detect the optimal pattern of its kind. In addition, you can switch on and off individu
    FX Dynamic: Rastrea la volatilidad y las tendencias con un análisis ATR personalizable Descripción general FX Dynamic es una herramienta potente que emplea los cálculos de Average True Range (ATR) para brindar a los traders información incomparable sobre la volatilidad diaria e intradía. Al establecer umbrales de volatilidad claros —por ejemplo, 80%, 100% y 130%— puedes identificar rápidamente oportunidades de beneficio o recibir alertas cuando el mercado excede sus rangos habituales. FX Dynam
    Currency Strength Wizard es un indicador muy poderoso que le proporciona una solución todo en uno para operar con éxito. El indicador calcula el poder de este o aquel par de divisas utilizando los datos de todas las monedas en múltiples marcos de tiempo. Estos datos se representan en forma de índice de moneda fácil de usar y líneas eléctricas de moneda que puede usar para ver el poder de esta o aquella moneda. Todo lo que necesita es adjuntar el indicador al gráfico que desea operar y el indicad
    Tendencia del oro : se trata de un buen indicador técnico bursátil. El algoritmo del indicador analiza el movimiento del precio de un activo y refleja la volatilidad y las posibles zonas de entrada. Las mejores señales del indicador: - Para VENTA = histograma rojo + puntero rojo CORTO + flecha amarilla de señal en la misma dirección. - Para COMPRA = histograma azul + puntero azul LARGO + flecha de señal aqua en la misma dirección. Ventajas del indicador: 1. El indicador produce señales co
    Supply Demand Analyzer
    Suvashish Halder
    5 (6)
    Supply Demand Analyzer is an advanced trading indicator meticulously designed for the precise identification, analysis, and management of supply and demand zones. By integrating real-time data and advanced algorithms, this tool enables traders to recognize market phases, price movements, and structural patterns with unparalleled accuracy. It simplifies complex market dynamics into actionable insights, empowering traders to anticipate market behavior, identify trading opportunities, and make info
    Support Resistance screnner
    STE S.S.COMPANY
    4.94 (36)
    Support And Resistance Screener está en un indicador de nivel para MetaTrader que proporciona múltiples herramientas dentro de un indicador. Las herramientas disponibles son: 1. Cribador de estructura de mercado. 2. Zona de retroceso alcista. 3. Zona de retroceso bajista. 4. Puntos pivotes diarios 5. Puntos de pivote semanales 6. Puntos Pivotes mensuales 7. Fuerte soporte y resistencia basado en patrón armónico y volumen. 8. Zonas de nivel de banco. OFERTA POR TIEMPO LIMITADO: El indicador de so
    Daily Candle Predictor es un indicador que predice el precio de cierre de una vela. El indicador está destinado principalmente para su uso en gráficos D1. Este indicador es adecuado tanto para el comercio de divisas tradicional como para el comercio de opciones binarias. El indicador se puede utilizar como un sistema de negociación independiente o puede actuar como una adición a su sistema de negociación existente. Este indicador analiza la vela actual, calculando ciertos factores de fuerza dent
    Otros productos de este autor
    Special offer : ALL TOOLS , just $35 each! New tools   will be   $30   for the   first week   or the   first 3 purchases !  Trading Tools Channel on MQL5 : Join my MQL5 channel to update the latest news from me Comencemos con las características destacadas: El EA está equipado con un FILTRO DE NOTICIAS y un FILTRO RSI. Riesgo bajo (algunos pares de divisas tienen un DrawDown de <10%, incluso 5%). Este EA no utiliza ninguna función de martingala o cuadrícula. El EA puede mostrar zonas visuales p
    Volumatic VIDyA MT5
    Duc Hoan Nguyen
    5 (2)
    Special offer : ALL TOOLS , just $35 each! New tools   will be   $30   for the   first week   or the   first 3 purchases !  Trading Tools Channel on MQL5 : Join my MQL5 channel to update the latest news from me Volumatic VIDYA (Variable Index Dynamic Average) es un indicador avanzado diseñado para rastrear tendencias y analizar la presión de compra-venta en cada fase de una tendencia. Utilizando el Promedio Dinámico de Índice Variable (Variable Index Dynamic Average) como técnica principal de s
    Special offer : ALL TOOLS , just $35 each! New tools   will be   $30   for the   first week   or the   first 3 purchases !  Trading Tools Channel on MQL5 : Join my MQL5 channel to update the latest news from me El indicador Volumetric Order Blocks Multi Timeframe es una herramienta poderosa diseñada para traders que buscan una comprensión más profunda del comportamiento del mercado al identificar áreas clave de precios donde los principales participantes del mercado acumulan órdenes. Estas área
    Special offer : ALL TOOLS , just $35 each! New tools   will be   $30   for the   first week   or the   first 3 purchases !  Trading Tools Channel on MQL5 : Join my MQL5 channel to update the latest news from me El Indicador de Patrón de Reversión de Tres Barras ofrece una herramienta poderosa para los traders, identificando y destacando automáticamente patrones de reversión de tres barras directamente en el gráfico de precios. Este indicador es un recurso valioso para detectar posibles reversio
    Special offer : ALL TOOLS , just $35 each! New tools   will be   $30   for the   first week   or the   first 3 purchases !  Trading Tools Channel on MQL5 : Join my MQL5 channel to update the latest news from me El indicador Zero Lag MA Trend Levels MT5 con escáner combina la media móvil de cero retraso (ZLMA) con una media móvil exponencial estándar (EMA), brindando a los traders una visión completa del impulso del mercado y los niveles clave de precios. Además, las funciones de escáner y alert
    Special offer : ALL TOOLS , just $35 each! New tools   will be   $30   for the   first week   or the   first 3 purchases !  Trading Tools Channel on MQL5 : Join my MQL5 channel to update the latest news from me En el volátil panorama de la negociación financiera actual, identificar con precisión los niveles de soporte y resistencia es fundamental para que los traders tomen decisiones informadas. Predictive Ranges Scanner Multi-TF es una herramienta avanzada diseñada para ayudar a los traders a
    Special offer : ALL TOOLS , just $35 each! New tools   will be   $30   for the   first week   or the   first 3 purchases !  Trading Tools Channel on MQL5 : Join my MQL5 channel to update the latest news from me ¡Descubre el poder del concepto de Inversion Fair Value Gap (IFVG) de ICT con el Inversion Fair Value Gaps Indicator ! Esta herramienta de última generación lleva los Fair Value Gaps (FVG) al siguiente nivel al identificar y mostrar zonas de FVG invertidas, que son áreas clave de soporte
    Special offer : ALL TOOLS , just $35 each! New tools   will be   $30   for the   first week   or the   first 3 purchases !  Trading Tools Channel on MQL5 : Join my MQL5 channel to update the latest news from me ¡Descubre el poder del concepto de Inversion Fair Value Gap (IFVG) de ICT con el Inversion Fair Value Gaps Indicator ! Esta herramienta de última generación lleva los Fair Value Gaps (FVG) al siguiente nivel al identificar y mostrar zonas de FVG invertidas, que son áreas clave de soporte
    Oferta especial : ALL TOOLS , ¡solo $35 cada uno! New tools   will be   $30   for the   first week   or the   first 3 purchases !  Trading Tools Channel on MQL5 : Join my MQL5 channel to update the latest news from me En un entorno de trading volátil, una herramienta de análisis potente e intuitiva puede ayudarte a aprovechar las oportunidades rápidamente. Fibonacci Trend Scanner no solo integra las funciones tradicionales del indicador de Fibonacci y SuperTrend, sino que también amplía la func
    Special offer : ALL TOOLS , just $35 each! New tools   will be   $30   for the   first week   or the   first 3 purchases !  Trading Tools Channel on MQL5 : Join my MQL5 channel to update the latest news from me El Fibonacci Confluence Toolkit Multi-Timeframe es una herramienta avanzada de análisis técnico diseñada para traders profesionales, que ayuda a identificar zonas potenciales de reversión de precios al combinar señales y patrones clave del mercado. Con capacidades de visualización de múl
    Special offer : ALL TOOLS , just $35 each! New tools   will be   $30   for the   first week   or the   first 3 purchases !  Trading Tools Channel on MQL5 : Join my MQL5 channel to update the latest news from me El indicador Supertrend Fakeout es una versión mejorada del clásico indicador Supertrend , diseñado para ofrecer señales de tendencia más fiables. Al incorporar características avanzadas como Fakeout Index Limit y Fakeout ATR Mult , este indicador ayuda a filtrar las falsas inversiones d
    FREE
    Volumatic VIDyA MT4
    Duc Hoan Nguyen
    5 (3)
    Special offer : ALL TOOLS , just $35 each! New tools   will be   $30   for the   first week   or the   first 3 purchases !  Trading Tools Channel on MQL5 : Join my MQL5 channel to update the latest news from me Volumatic VIDYA (Variable Index Dynamic Average) es un indicador avanzado diseñado para rastrear tendencias y analizar la presión de compra-venta en cada fase de una tendencia. Utilizando el Promedio Dinámico de Índice Variable (Variable Index Dynamic Average) como técnica principal de s
    Special offer : ALL TOOLS , just $35 each! New tools   will be   $30   for the   first week   or the   first 3 purchases !  Trading Tools Channel on MQL5 : Join my MQL5 channel to update the latest news from me El indicador Volumetric Order Blocks Multi Timeframe es una herramienta poderosa diseñada para traders que buscan una comprensión más profunda del comportamiento del mercado al identificar áreas clave de precios donde los principales participantes del mercado acumulan órdenes. Estas área
    Special offer : ALL TOOLS , just $35 each! New tools   will be   $30   for the   first week   or the   first 3 purchases !  Trading Tools Channel on MQL5 : Join my MQL5 channel to update the latest news from me El Indicador de Patrón de Reversión de Tres Barras ofrece una herramienta poderosa para los traders, identificando y destacando automáticamente patrones de reversión de tres barras directamente en el gráfico de precios. Este indicador es un recurso valioso para detectar posibles reversio
    Special offer : ALL TOOLS , just $35 each! New tools   will be   $30   for the   first week   or the   first 3 purchases !  Trading Tools Channel on MQL5 : Join my MQL5 channel to update the latest news from me I. Introducción Market Structure Trend Targets Scanner es una herramienta poderosa para analizar tendencias del mercado, identificar puntos de ruptura y gestionar riesgos mediante un stop loss dinámico. Al rastrear máximos y mínimos anteriores para detectar rupturas, esta herramienta ay
    Special offer : ALL TOOLS , just $35 each! New tools   will be   $30   for the   first week   or the   first 3 purchases !  Trading Tools Channel on MQL5 : Join my MQL5 channel to update the latest news from me Supply Demand Retest and Break Multi Timeframe , esta herramienta traza zonas de oferta y demanda basadas en velas de fuerte momentum, permitiéndole identificar estas zonas en múltiples marcos de tiempo utilizando la función   timeframe selector   . Con etiquetas de retest y break, junto
    Special offer : ALL TOOLS , just $35 each! New tools   will be   $30   for the   first week   or the   first 3 purchases !  Trading Tools Channel on MQL5 : Join my MQL5 channel to update the latest news from me Presentamos SuperTrend ATR Multiplier with Scanner for MT5 – una herramienta versátil y poderosa diseñada para ayudarte a estar siempre un paso adelante de las tendencias del mercado, con funciones personalizables y alertas en tiempo real. Siguiendo la lógica confiable de SuperTrend de K
    FREE
    Special offer : ALL TOOLS , just $35 each! New tools   will be   $30   for the   first week   or the   first 3 purchases !  Trading Tools Channel on MQL5 : Join my MQL5 channel to update the latest news from me Trendlines with Breaks Scanner es una herramienta de trading de última generación diseñada para ayudar a los traders a identificar tendencias críticas y detectar rupturas en tiempo real. Con líneas de tendencia generadas automáticamente basadas en puntos de pivote, este indicador permite
    Special offer : ALL TOOLS , just $35 each! New tools   will be   $30   for the   first week   or the   first 3 purchases !  Trading Tools Channel on MQL5 : Join my MQL5 channel to update the latest news from me El indicador Liquidity Pools es una herramienta avanzada que identifica y marca zonas de liquidez potenciales en el gráfico al analizar áreas altas y bajas con frecuentes toques de mecha, junto con el número de revisitas y el volumen negociado dentro de cada zona. Esta herramienta propor
    SMC System MT4
    Duc Hoan Nguyen
    5 (1)
    Special offer : ALL TOOLS , just $35 each! New tools   will be   $30   for the   first week   or the   first 3 purchases !  Trading Tools Channel on MQL5 : Join my MQL5 channel to update the latest news from me SMC es un enfoque de trading que ayuda a los traders a identificar zonas de liquidez, posiciones de órdenes institucionales y puntos clave de giro del mercado. Al aprovechar los principios de SMC, los traders pueden navegar por el mercado de manera más efectiva, encontrando entradas y sa
    Special offer : ALL TOOLS , just $35 each! New tools   will be   $30   for the   first week   or the   first 3 purchases !  Trading Tools Channel on MQL5 : Join my MQL5 channel to update the latest news from me Descubre el poder de la IA con el SuperTrend AI Clustering con escáner , una herramienta revolucionaria para MetaTrader4 (MT4). Este indicador redefine el análisis del mercado combinando el agrupamiento K-means con el popular indicador SuperTrend, brindando a los traders una ventaja para
    Special offer : ALL TOOLS , just $35 each! New tools   will be   $30   for the   first week   or the   first 3 purchases !  Trading Tools Channel on MQL5 : Join my MQL5 channel to update the latest news from me Maximiza tu ventaja comercial con Follow Line MT5 con escáner, un indicador avanzado basado en la volatilidad diseñado para traders serios. Esta herramienta combina el poder de las Bandas de Bollinger con configuraciones personalizables, ofreciendo información precisa sobre los movimient
    FREE
    Special offer : ALL TOOLS , just $35 each! New tools   will be   $30   for the   first week   or the   first 3 purchases !  Trading Tools Channel on MQL5 : Join my MQL5 channel to update the latest news from me Descubra el poder del aprendizaje automático avanzado con el Machine Learning Adaptive SuperTrend , un indicador de vanguardia diseñado para adaptarse sin problemas a las condiciones cambiantes del mercado. Al integrar la agrupación en clústeres de k-medias con la metodología SuperTrend,
    Liquidity Pools MT4
    Duc Hoan Nguyen
    5 (1)
    Special offer : ALL TOOLS , just $35 each! New tools   will be   $30   for the   first week   or the   first 3 purchases !  Trading Tools Channel on MQL5 : Join my MQL5 channel to update the latest news from me El indicador Liquidity Pools es una herramienta avanzada que identifica y marca zonas de liquidez potenciales en el gráfico al analizar áreas altas y bajas con frecuentes toques de mecha, junto con el número de revisitas y el volumen negociado dentro de cada zona. Esta herramienta propor
    Special offer : ALL TOOLS , just $35 each! New tools   will be   $30   for the   first week   or the   first 3 purchases !  Trading Tools Channel on MQL5 : Join my MQL5 channel to update the latest news from me En el siempre cambiante panorama del comercio financiero, identificar y analizar con precisión los niveles de soporte y resistencia es esencial para tomar decisiones de inversión informadas. SnR Retest and Break Multi-Timeframe es un indicador de soporte y resistencia diseñado para mejor
    Special offer : ALL TOOLS , just $35 each! New tools   will be   $30   for the   first week   or the   first 3 purchases !  Trading Tools Channel on MQL5 : Join my MQL5 channel to update the latest news from me El Fibonacci Confluence Toolkit Multi-Timeframe es una herramienta avanzada de análisis técnico diseñada para traders profesionales, que ayuda a identificar zonas potenciales de reversión de precios al combinar señales y patrones clave del mercado. Con capacidades de visualización de múl
    Supertrend Fakeout MT4
    Duc Hoan Nguyen
    4.5 (2)
    Special offer : ALL TOOLS , just $35 each! New tools   will be   $30   for the   first week   or the   first 3 purchases !  Trading Tools Channel on MQL5 : Join my MQL5 channel to update the latest news from me El indicador Supertrend Fakeout es una versión mejorada del clásico indicador Supertrend , diseñado para ofrecer señales de tendencia más fiables. Al incorporar características avanzadas como Fakeout Index Limit y Fakeout ATR Mult , este indicador ayuda a filtrar las falsas inversiones d
    FREE
    Special offer : ALL TOOLS , just $35 each! New tools   will be   $30   for the   first week   or the   first 3 purchases !  Trading Tools Channel on MQL5 : Join my MQL5 channel to update the latest news from me Descripción general OA SnR Power es una herramienta poderosa diseñada para ayudar a los traders a identificar y evaluar la fortaleza de los niveles de soporte y resistencia. Al incorporar factores clave como el volumen de operaciones, la frecuencia de rebote y el recuento de pruebas, es
    FREE
    Special offer : ALL TOOLS , just $35 each! New tools   will be   $30   for the   first week   or the   first 3 purchases !  Trading Tools Channel on MQL5 : Join my MQL5 channel to update the latest news from me SMC es un enfoque de trading que ayuda a los traders a identificar zonas de liquidez, posiciones de órdenes institucionales y puntos clave de giro del mercado. Al aprovechar los principios de SMC, los traders pueden navegar por el mercado de manera más efectiva, encontrando entradas y sa
    Special offer : ALL TOOLS , just $35 each! New tools   will be   $30   for the   first week   or the   first 3 purchases !  Trading Tools Channel on MQL5 : Join my MQL5 channel to update the latest news from me Kalman Trend Levels es un indicador avanzado de seguimiento de tendencias que utiliza la tecnología de filtro de Kalman de vanguardia para proporcionar a los traders potentes señales analíticas. Diseñado para ser preciso y adaptable, esta herramienta no solo identifica zonas críticas de
    Filtro:
    totee toto
    54
    totee toto 2025.02.17 12:07 
     

    Interest indicator. Help for my trading.Well done.

    Duc Hoan Nguyen
    25014
    Respuesta del desarrollador Duc Hoan Nguyen 2025.02.17 12:16
    Thank you for your review!
    I’m glad to hear that the indicator has been helpful for you.
    Wishing you successful trading!
    Yusuf Hamzah
    741
    Yusuf Hamzah 2024.12.17 14:03 
     

    Unique. RSI + KDE. Scientifically sound. The concept provides a good unbiased additional confirmation of a possible reversal. Well done.

    Duc Hoan Nguyen
    25014
    Respuesta del desarrollador Duc Hoan Nguyen 2024.12.17 14:13
    Thank you for your positive review.
    I'm pleased that product met your expectations.
    Wishing you continued success in your trading!
    danmar
    1795
    danmar 2024.12.04 06:11 
     

    i buy this one because i read the review of XANKEEZ on the other excellent product that i bought Volumetric Order Blocks MT4 Multi Timeframe and it is also a great one which works very well with volumetric : Well Done and today i upload the new version with new functionalities that i ask yesterday 3 december for future update! so quick and for me he makes my chart clearer and with less space taken for the MTF with use of Y negative to hide upper part of title Then THANK YOU A LOT. few sellers take really the asking of their buyers (even i understand that all asking could not be taken). Here it is a very quick update , user support is excellent, thank you again.

    Duc Hoan Nguyen
    25014
    Respuesta del desarrollador Duc Hoan Nguyen 2024.12.04 10:23
    Thank you for your review!
    I'm glad the indicator meets your needs and makes your trading smoother. Supporting customers is always my top priority.
    Wishing you great success!
    XANKEEZ
    439
    XANKEEZ 2024.11.28 03:54 
     

    one of the indicators i was really interested in but i never thought i would be able to use it on MT4. this is really a great tool. one of MUST HAVE tool for trading. thanks to the author who made it possible.

    Duc Hoan Nguyen
    25014
    Respuesta del desarrollador Duc Hoan Nguyen 2024.11.28 09:26
    Thank you for your review! Glad to hear the tool is helpful for you.
    Wishing you successful trading!
    Respuesta al comentario
    Versión 2.10 2025.02.27
    Optimized dashboard algorithm
    Versión 2.0 2024.12.31
    - Optimized the algorithm to make the indicator a little faster.
    - Improved user experience with the dashboard.
    - Added the feature to hide/show indicator on the current chart.
    Versión 1.15 2024.12.03
    - From now on all labels in the indicator will use the font parameter in the scanner section
    - Added label size, label spacing parameter for RSI and KDE Labels
    - Can accept negative numbers for fixed X, Y parameters (be careful when using)
    Versión 1.14 2024.12.02
    Added parameters to fixed the dashboards from the beginning (Movable, fixed X, fixed Y)
    Versión 1.10 2024.11.01
    Fixed a minor bug related to Alerts