Statiscal trend indicator
- Indicadores
- Pietro Nardi
- Versión: 1.2
- Actualizado: 8 octubre 2024
- Activaciones: 5
Statistical Trend Indicator is an advanced custom indicator designed to analyze market movements and provide traders with calculated probabilities of upward or downward trends. By analyzing historical price data over a specified lookback period, this indicator computes the likelihood of the market continuing in either direction, offering traders a statistical edge in decision-making.
Key Features:
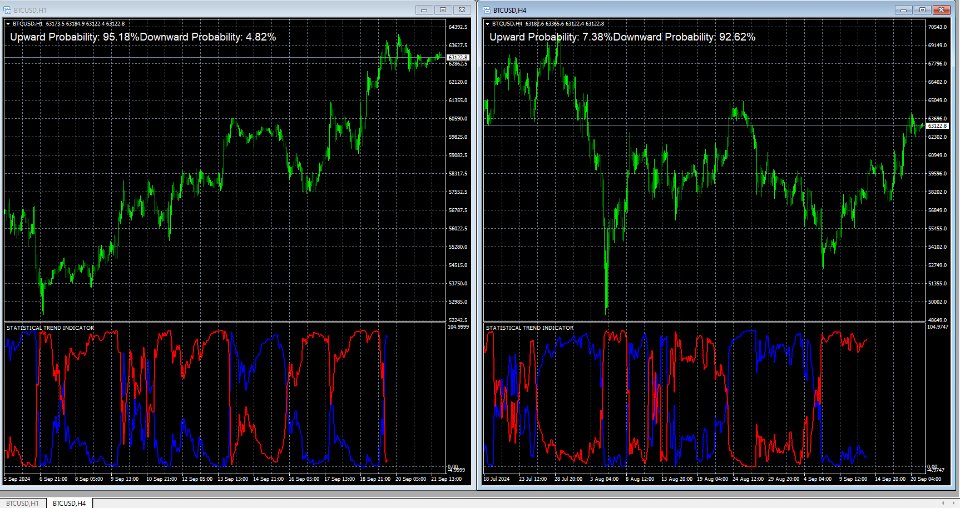
Probability Display: It calculates and displays the percentage probabilities of an upward or downward trend, shown as two separate lines on the chart. The blue line represents the probability of an upward trend, while the red line represents the probability of a downward trend.
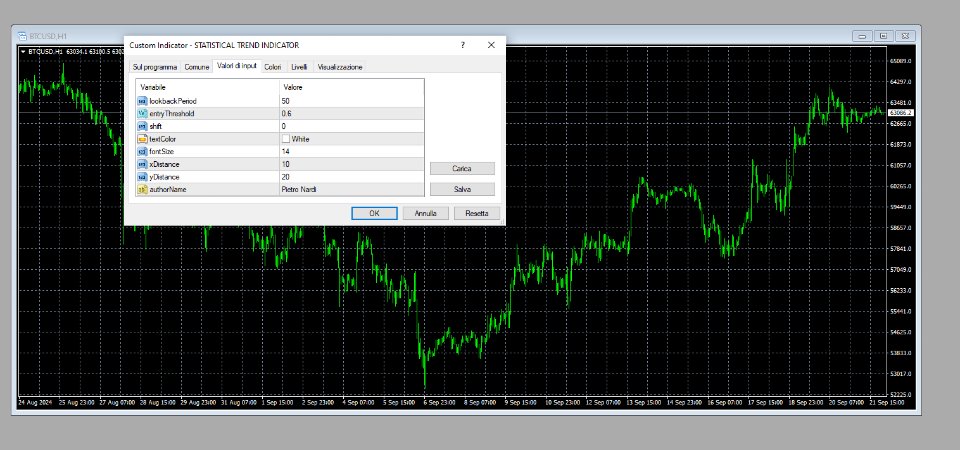
Customizable Lookback Period: Traders can adjust the lookbackPeriod parameter to change the number of bars used for statistical calculations, allowing for flexibility depending on market conditions or trading strategies.
Real-Time Updates: The indicator updates the trend probabilities in real-time, showing the most recent calculations directly on the chart for instant decision-making.
Graphical Display: The probabilities are displayed as a text object on the chart, showing the exact percentage of upward and downward trends at any given moment, making it easy to interpret without cluttering the screen.
Author Label: For clarity and personalization, the indicator includes an embedded author label that displays the creator’s name directly on the chart.
Input Parameters:
Lookback Period: Defines how many historical bars are analyzed to calculate the mean and standard deviation of price movements.
Entry Threshold: This input can be used to define a threshold for signaling potential trade entries based on the computed probabilities.
Graphical Customization: You can customize the text color, font size, and position of the probability and author labels on the chart.
How It Works:
The indicator uses statistical methods to analyze price fluctuations and determine whether the current price action leans towards a bullish or bearish trend. It dynamically adjusts its calculations based on recent market behavior, ensuring that it provides up-to-date information for your trading decisions.
Whether you are a day trader, swing trader, or long-term investor, the Statistical Trend Indicator can add an objective, data-driven layer to your market analysis, helping you gauge the likelihood of potential market trends before committing to a trade
