MSB Strategy Indicator
- Indicadores
- Shingidzano Lesetedi
- Versión: 1.0
- Activaciones: 5
Capitalized on market structure and price gaps
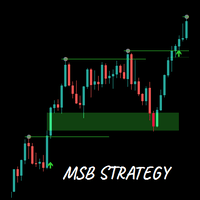
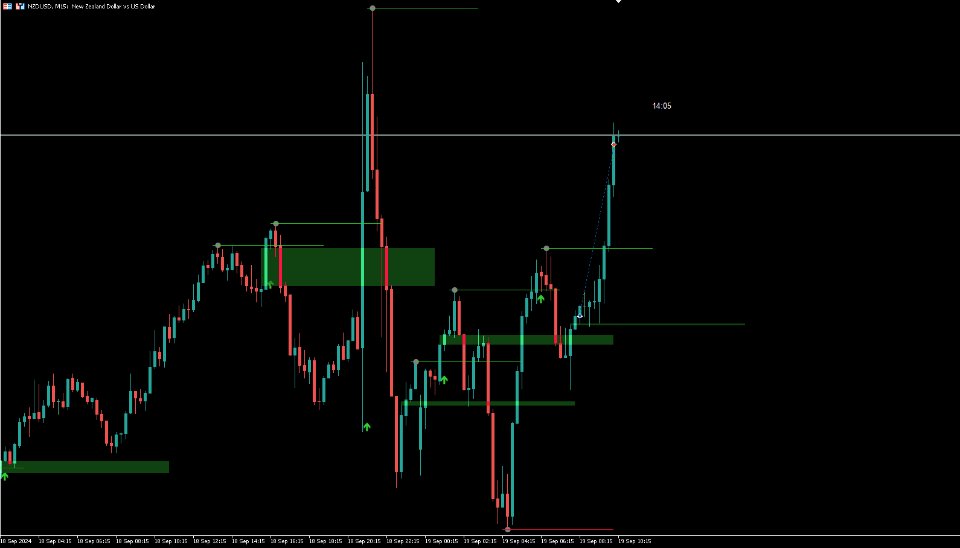
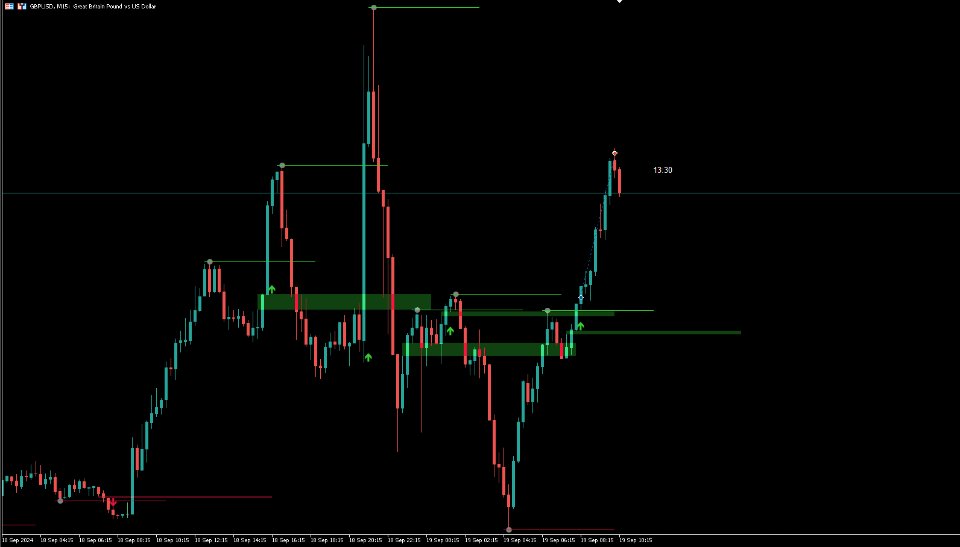
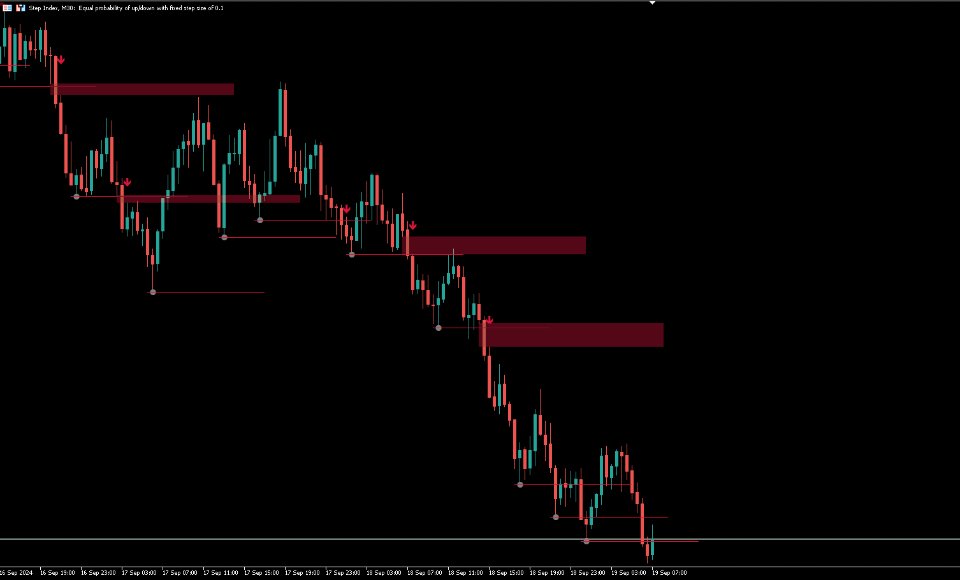
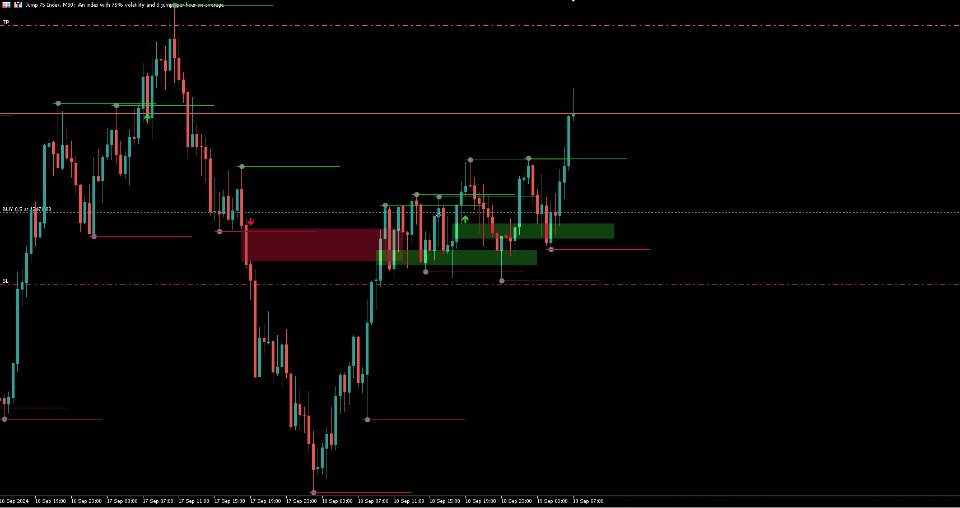
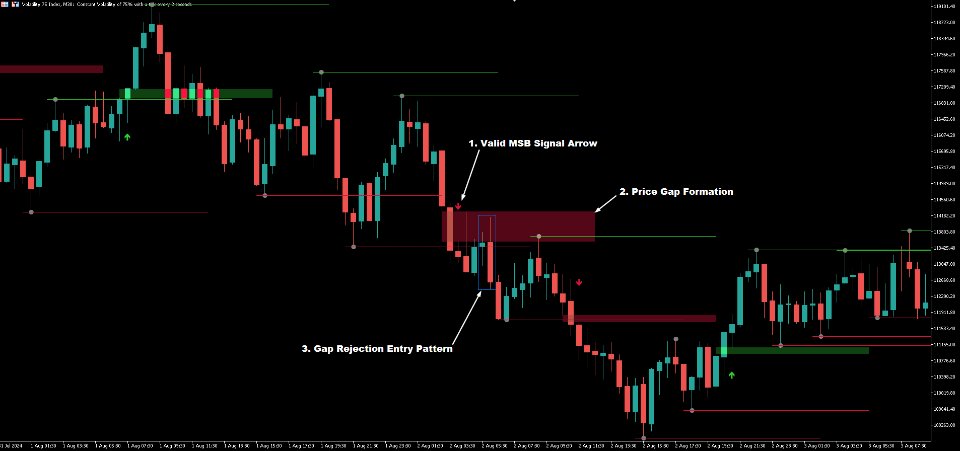
The MSB Strategy indicator identifies swing highs and lows, detects high probability breakouts and price gaps (better knows as FVGs) which when price retests offer high probability entries. The indicator will draw an arrow to mark breakouts and when detected draw a rectangle FVG zone which you can use to define high probability entries. The 200 EMA is included to filter out noise and false signals.
Summary of features
- Alerts on market structure breaks
- Alerts of price gap formations
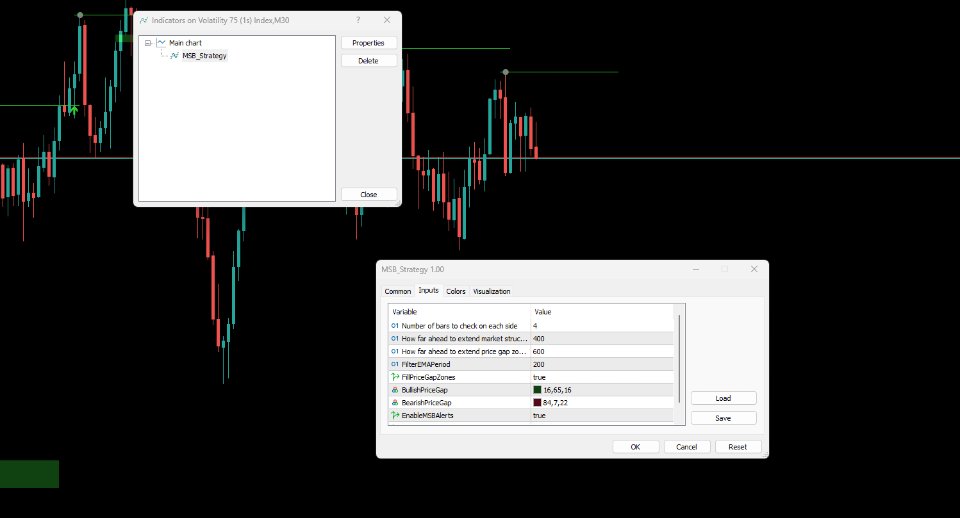
- Input to adjust swing high and low detection
- Adjustable length of market structure lines
- Adjustable length of price gap rectangles
- Adjustable price gap rectangle color for different chart backgrounds
- Adjustable EMA trend filter
Best Patterns to trade with this indicator
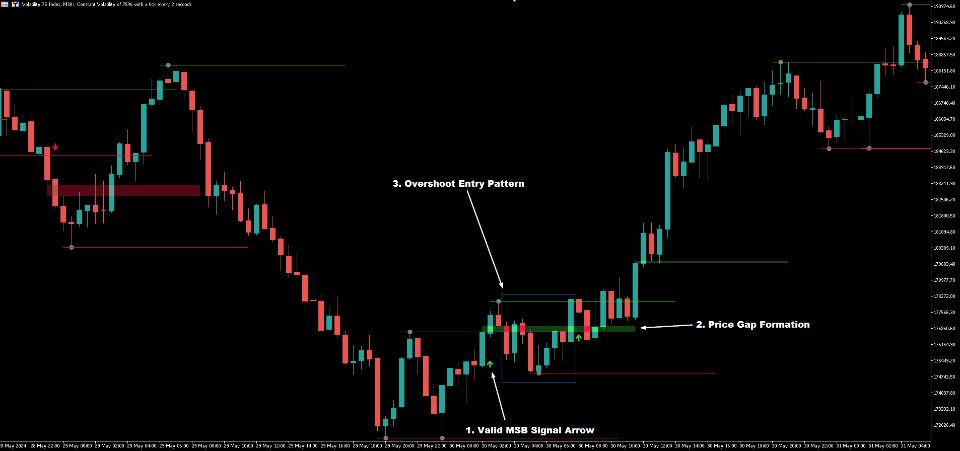
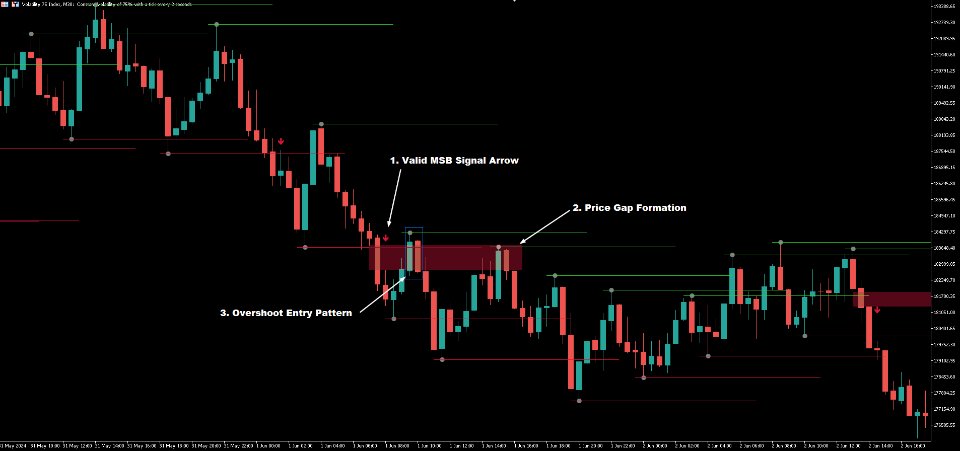
Gap Overshoot Entry
Valid MSB Signal Arrow ⇒ Price Gap Formation ⇒ Overshoot Entry Pattern (check images for examples )
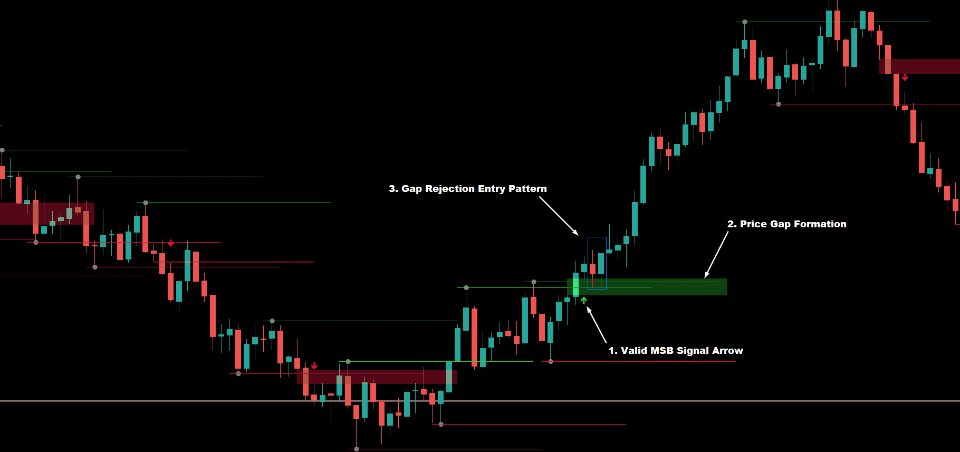
Gap Rejection Entry
Valid MSB Signal Arrow ⇒ Price Gap Formation ⇒ Gap Rejection Entry Pattern (check images for examples)
Recommended Risk Reward is 2:1 but you can go higher up to 4:1 if you can filter setups well and accept a lower strike rate.
Recommended Timeframes are 1min, 5min, 30min, 4hr, Daily. Cascading from higher timeframe signals to lower timeframe ones will provide the best trading setups.
This indicator works well with all trading instruments including synthetic indices such as Volatility 75 Index, Step Index and Jump Indices
Feel free to download the demo and test the indicator on the strategy tester.
Remember any trading strategy is only as good as the trader that can use it effectively
