Fast flat
- Indicadores
- Dimitri Nepomniachtchi
- Versión: 2.0
- Actualizado: 6 octubre 2024
- Activaciones: 20
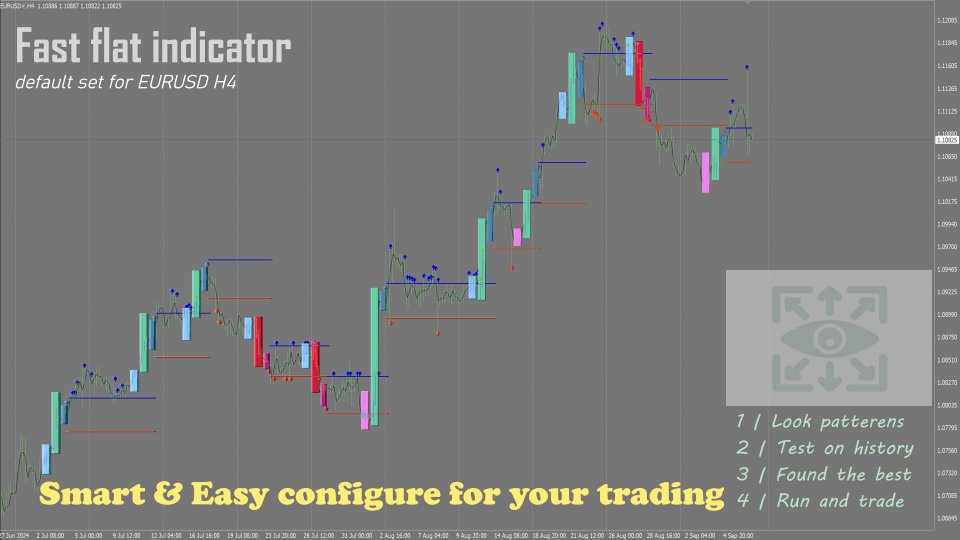
The Fast flat indicator can recognize and notify you of short flats after the price rises or falls. Where the price can rush further or reverse.
++ The indicator is open to arbitrary flat settings. You will probably have to conduct quite a few tests, approaching the best results. I will be very grateful if you share in the comments your tests, parameters and advice to other users, who may also be able to improve your results.
Should I use it for entry signals, order stops, hedging...?
- The indicator is adjustable with simple mathematical calculations. It can be adjusted and tested for your trading conditions.
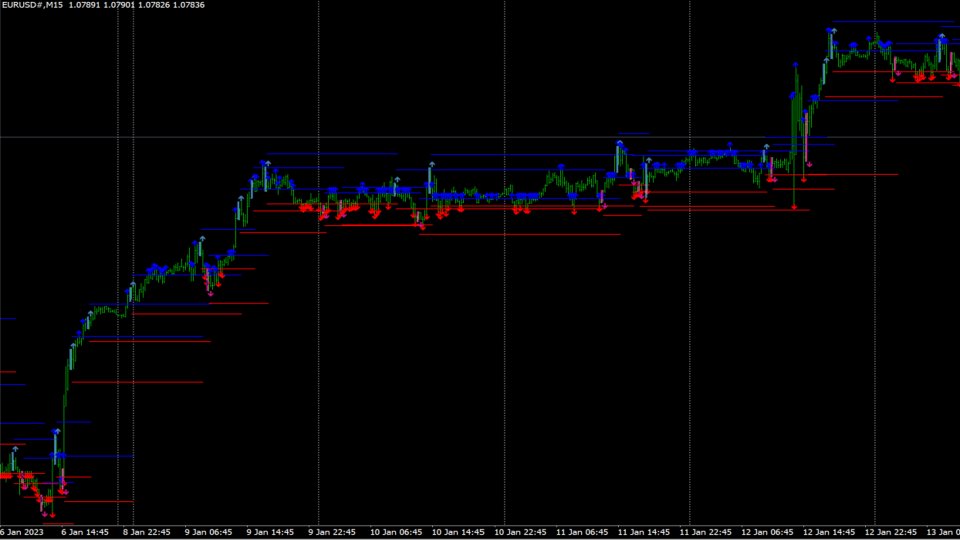
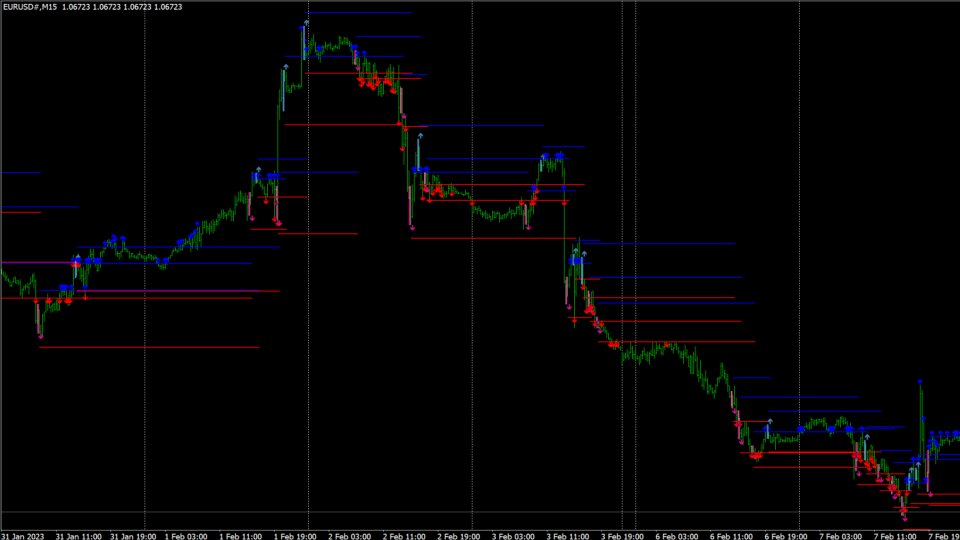
- In the picture drawn by the strategy tester, you can recognize various signals yourself:
--- Reversals
--- Level breakouts
--- Breakouts of the top and bottom
--- Support and resistance
--- Trading within a flat
--- Signals to close profits
--- Stop loss levels
The indicator can display the calculation of the senior timeframe on the junior one. For example, H4 on M15. You need to apply the indicator to the chart 2 times.
The sensitivity of the indicator depends on its settings.
The indicator can be applied to the chart more than once, with different parameters and change colors.
The chart can display all calculation blocks that help in its settings. When your strategy is ready, you can turn them off and leave only the flat boxes.
The indicator shows arrows, but you should not rush to accept them as signals to open a deal.
signals
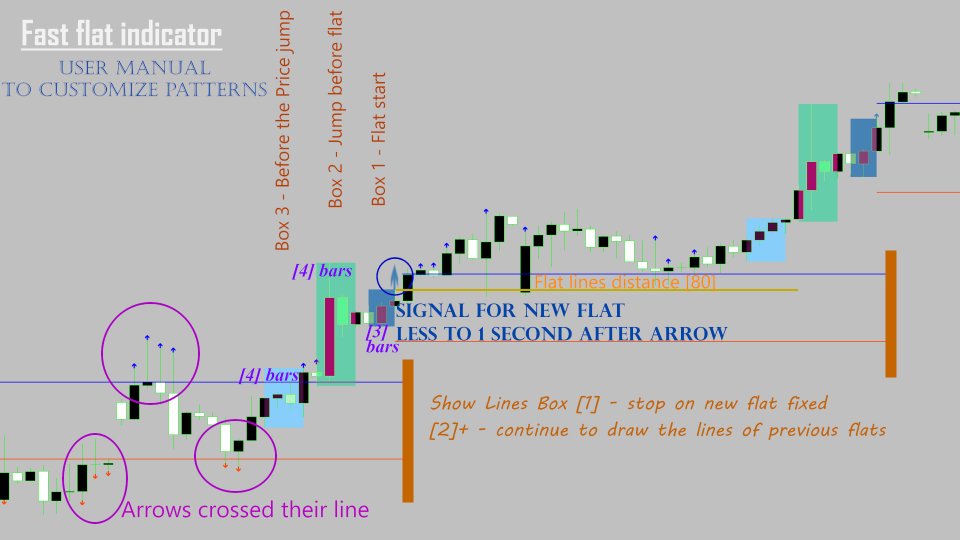
Arrows about the appearance of a new flat, which was formed from a jerk up/down. They appear at the opening of a new bar, as soon as a flat was recognized before this bar.
Lines at the bottom and top of the appeared flat, you can set the indent from the flat in points.
Arrows from lines. Appear from lines at a distance from the flat that is set in the parameters. An arrow from a line appears when the price passes the line in its direction.
Lines are drawn and continue to be drawn from [_] specified last flats. 1 Lines will be drawn only from the last flat. 100 your chart may be covered with lines and it will be more difficult to detect signals.
Fast flat parameters
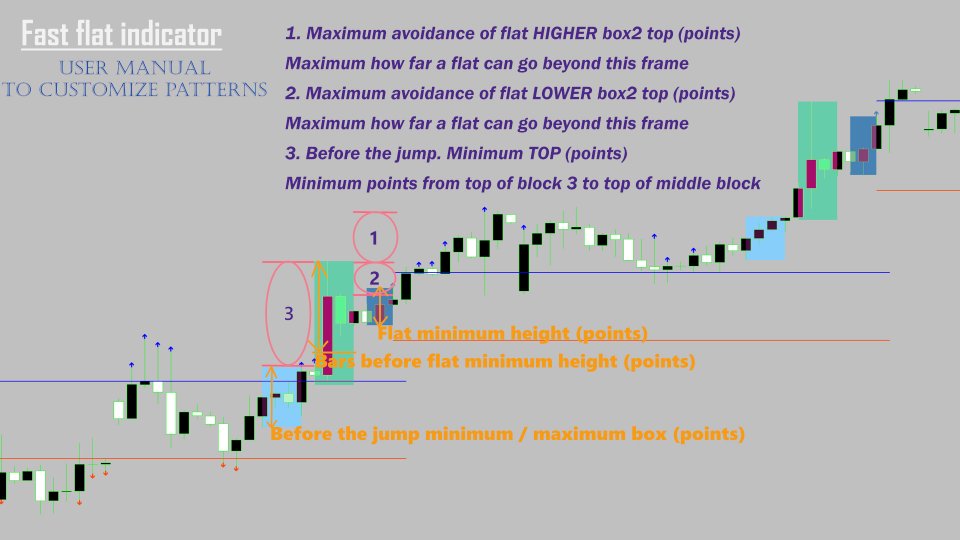
------- BOX1 RIGHT - Flat box ------First block, right block, flat block. Price stop block after the calculated jerk.
Flat bars - How many bars to fix the flat. The more bars, the wider the flat. With smaller bars, you can catch a temporary price stop and a further rush or reversal.
Flat minimum height (pp) - Minimum flat height, below which there will be no fixation.
Flat maximum height (pp) - Maximum flat height, no fixation will occur above it.
Excluding bars for min max height - How many bars can go beyond the flat boundaries. Have any height and break the flat higher or lower.
Shift bars find flat (0-off) - To avoid one flat on another, set how many bars after the last flat, will not display a new flat. Run the test with 0 and you will understand, maybe it suits you.
-- BOX2 MIDDLE - Jump before flat --The second block from the right. This is the block of a jump or rise, fall of the price before a flat.
Bars before flat - How many bars will be used in calculating the second block.
Bars before flat minimum height (pp) - The second block, its minimum height in points. The height of all its specified bars.
Maximum avoidance of flat HIGHER box2 top (pp) - How many points can a flat block deviate from the top of the second block upwards (for the upper flat, vice versa for the lower one).
Maximum avoidance of flat LOWER box2 top (pp) - How many points can a flat block deviate from the top of the second block downwards (for the upper flat, vice versa for the lower one).
------ BOX3 LEFT - Before jump -----The third block. Needed to resist the second block, to catch the upper flat on the rise, and the lower one on the descent.
Bars before the jump - How many bars will be involved in calculating the third block.
Before the jump minimum box (pp) - The third block, its minimum height in points. The height of all its specified bars.
Before the jump maximum box (pp) - The third block, its maximum height in points. The height of all its specified bars.
Before the jump. Minimum TOP (pp) - Minimum distance from the top of the third block to the top of the second block.
Before the jump. Price direction - The direction of the price of the third block, before the jump, the rise in the price of the second block. If you set "totop" then for the upper flat, the price of the third block went up. For the lower flat, the price of the third block went down. If you set "tobottom" then for the upper flat, the price of the third block went down. For the lower flat, the price of the third block went up.
---- Design ----
Show_Arrow_Flat - Show arrows when a new flat appears.
Show_Arrow_Line - Show arrows at line intersections.
Color box1 - Color of the upper flat.
Color box1 - Color of the lower flat.
Color box2 UP - Color of the second block up.
Color box2 DW - Color of the second block down.
Color box3 UP - Color of the third block where the price was moving upward.
Color box3 DW - Color of the third block where the price was going down.
Flat top line color - The top continuous line of the flat.
Flat bottom line color - The lower continuing line of the flat.
Flat lines distance - The distance of the upper and lower lines from the flat. Minimum 1.
Width lines distance - Width of lines from flat.
Show Lines Box - How many last flats will continue to draw lines.
Parameter Sets : moved to comments
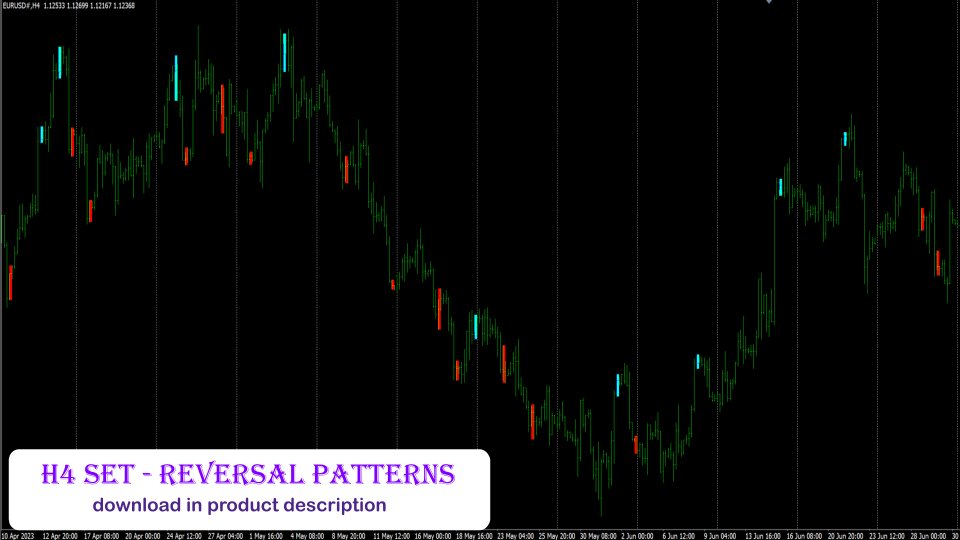
H4 set - Reversal patterns
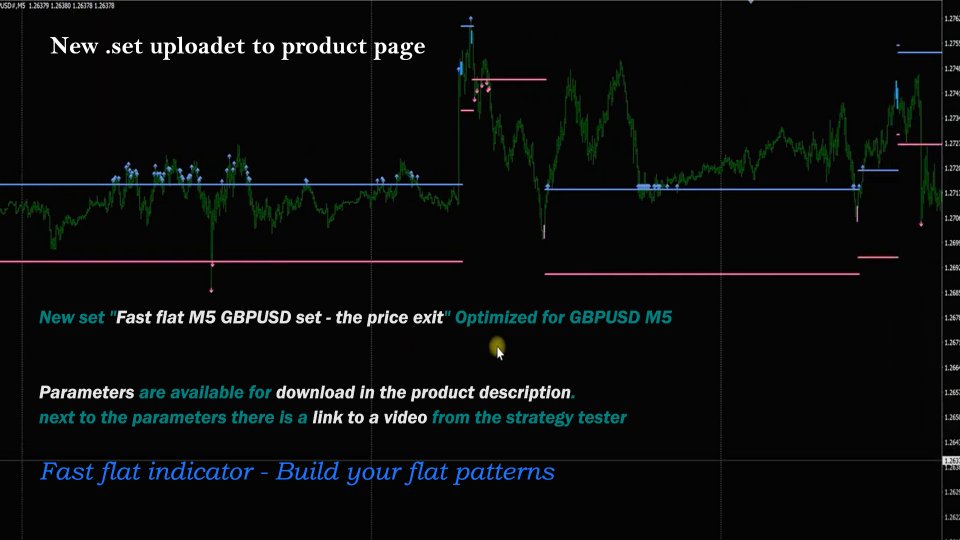
Fast flat M5 GBPUSD set - the price exit / video
Fast flat M5 GBPUSD set - the price exit -- more signals
Buffers for auto trading
0 - Upper flat
1- Lower flat
2 - Upper flat - Upper line
4 - Upper flat - Lower line
3 - Lower flat - Upper line
5 - Lower flat - Lower line
