SMA cross over marker
- Indicadores
- Rick In T Veld
- Versión: 1.4
- Actualizado: 23 septiembre 2024
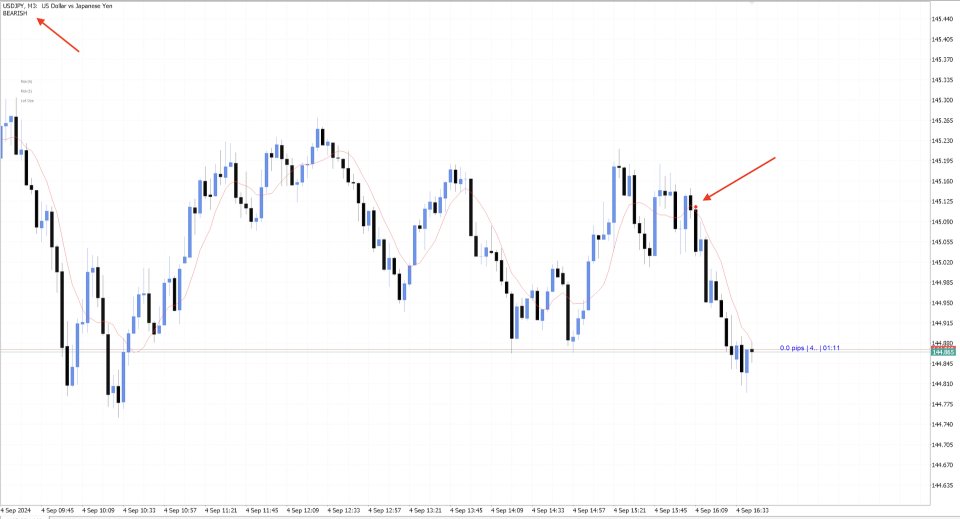
This indicator marks the SMA crossover candles.
To use this indicator properly you should / could also add the Moving Average indicator.
If you do, use the default length of 8 or use the length you used as input within this indicator.
Which I tend to use as my entry model.
Usually when this occurs within my marked supply or demand zone you could end up with a price explosion heading toward the next weak high / low or even toward the daily high / low.
I personally use it on the 2-3 min chart within a supply or demand zone.
The higher timeframe trend is determined on the 200 SMA of the 4h timeframe.
If this value is bearish, the short markers will be shown on every timeframe you open.
If this value is bullish, the long markers will be shown on every timeframe you open.
I've also created a similar indicator for TradingView
Visit: TradingView


