CustomRsi50
- Indicadores
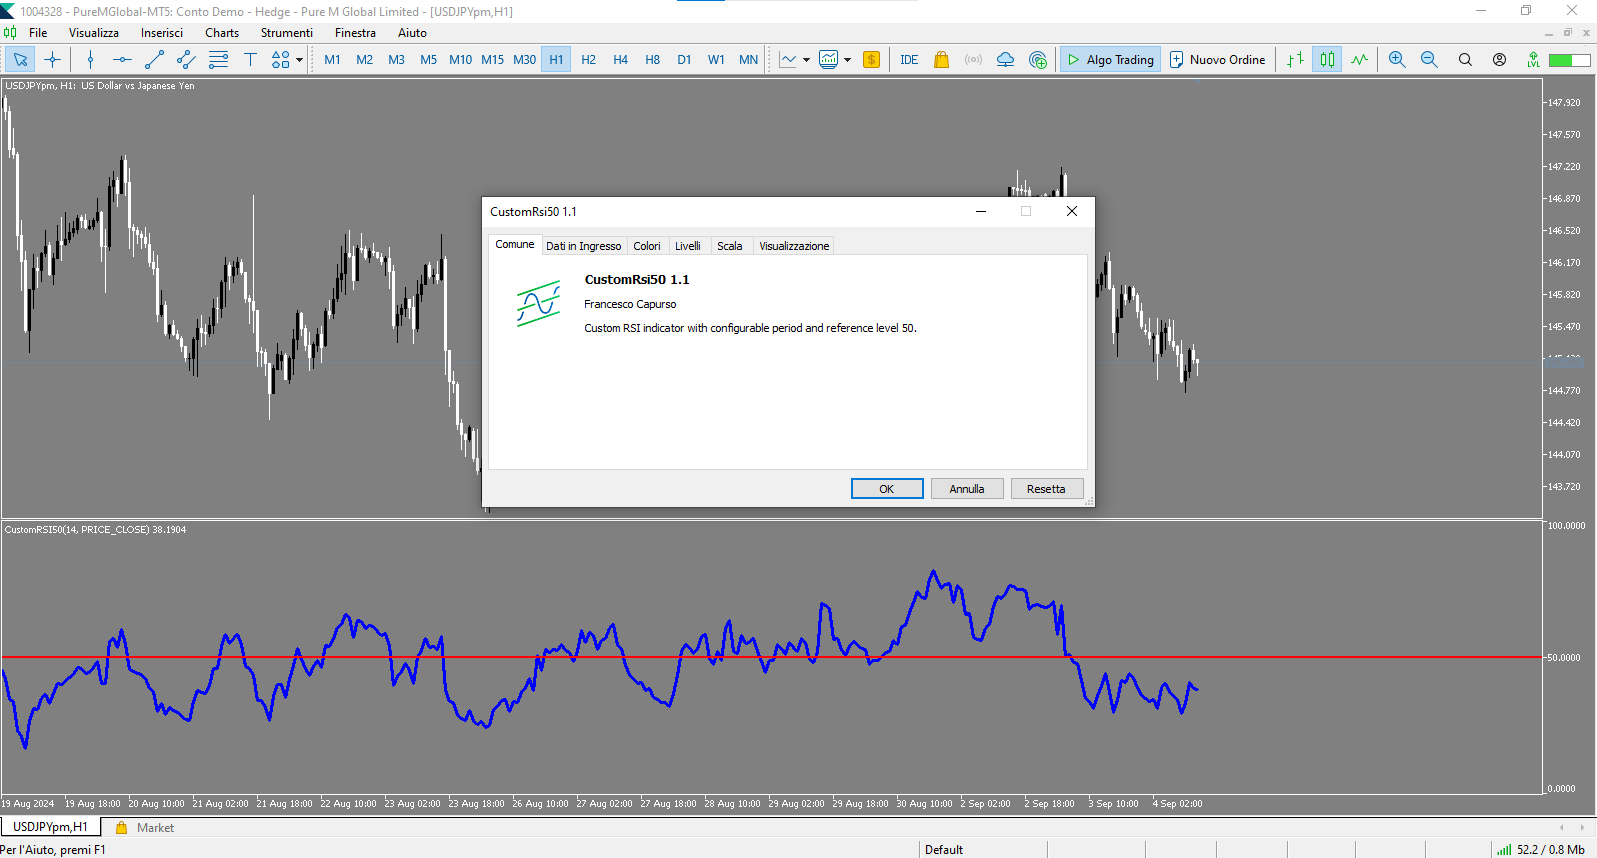
- Francesco Capurso
- Versión: 1.4
- Actualizado: 6 septiembre 2024
CustomRSI50 - Indicador RSI Personalizado con Nivel 50
Descripción
CustomRSI50 es un indicador técnico personalizado basado en el popular Índice de Fuerza Relativa (RSI). Este indicador ofrece una visualización clara y personalizable del RSI, con un énfasis particular en el nivel 50, crucial para muchos traders en el análisis del momentum.
Características Principales
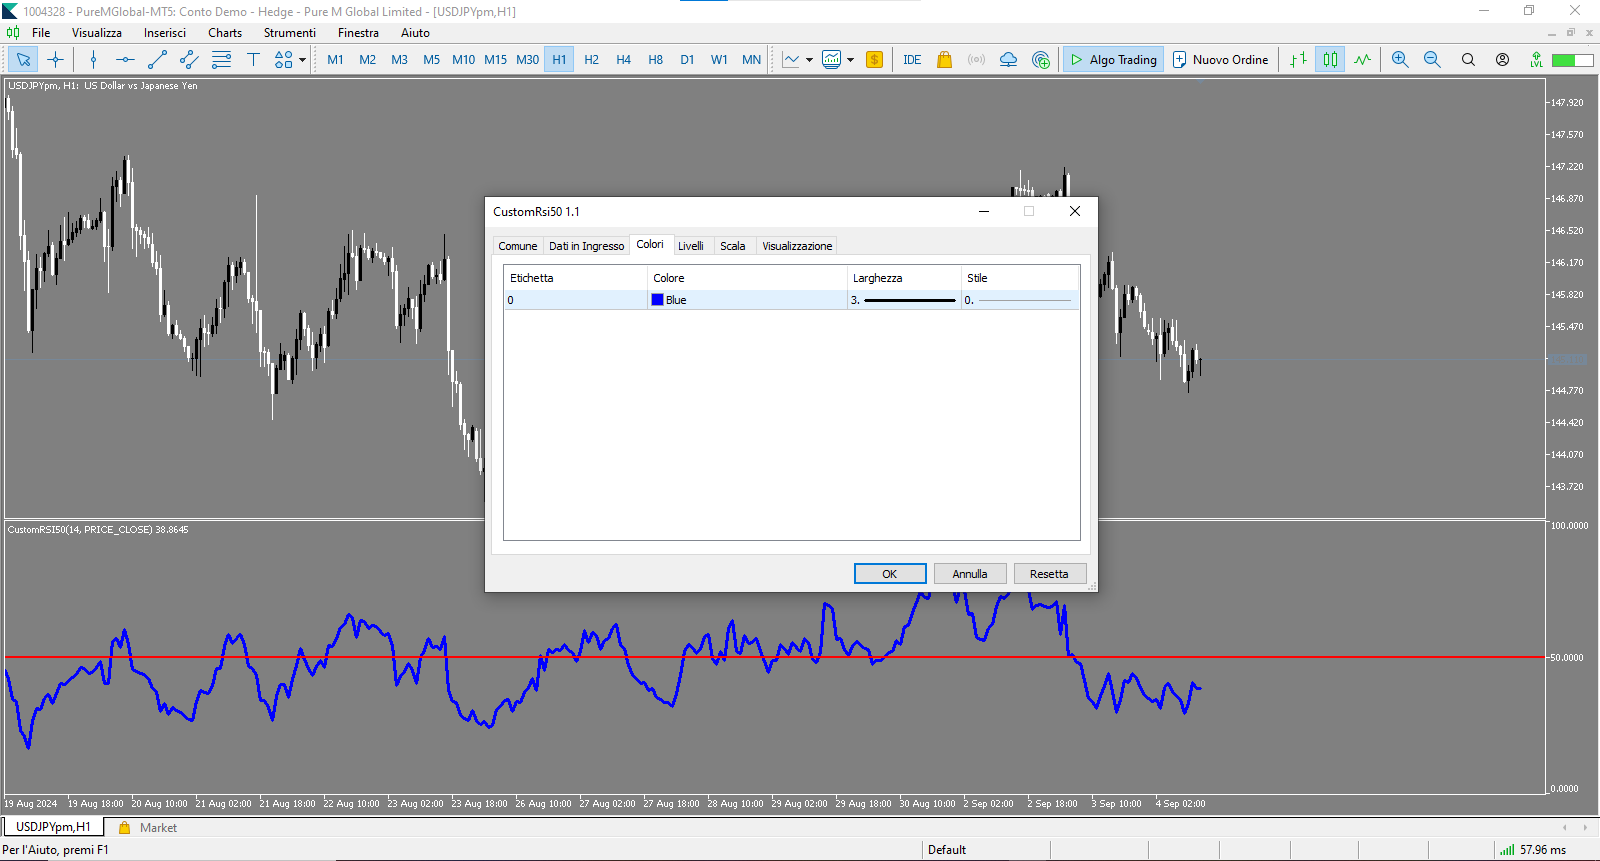
- Período RSI configurable
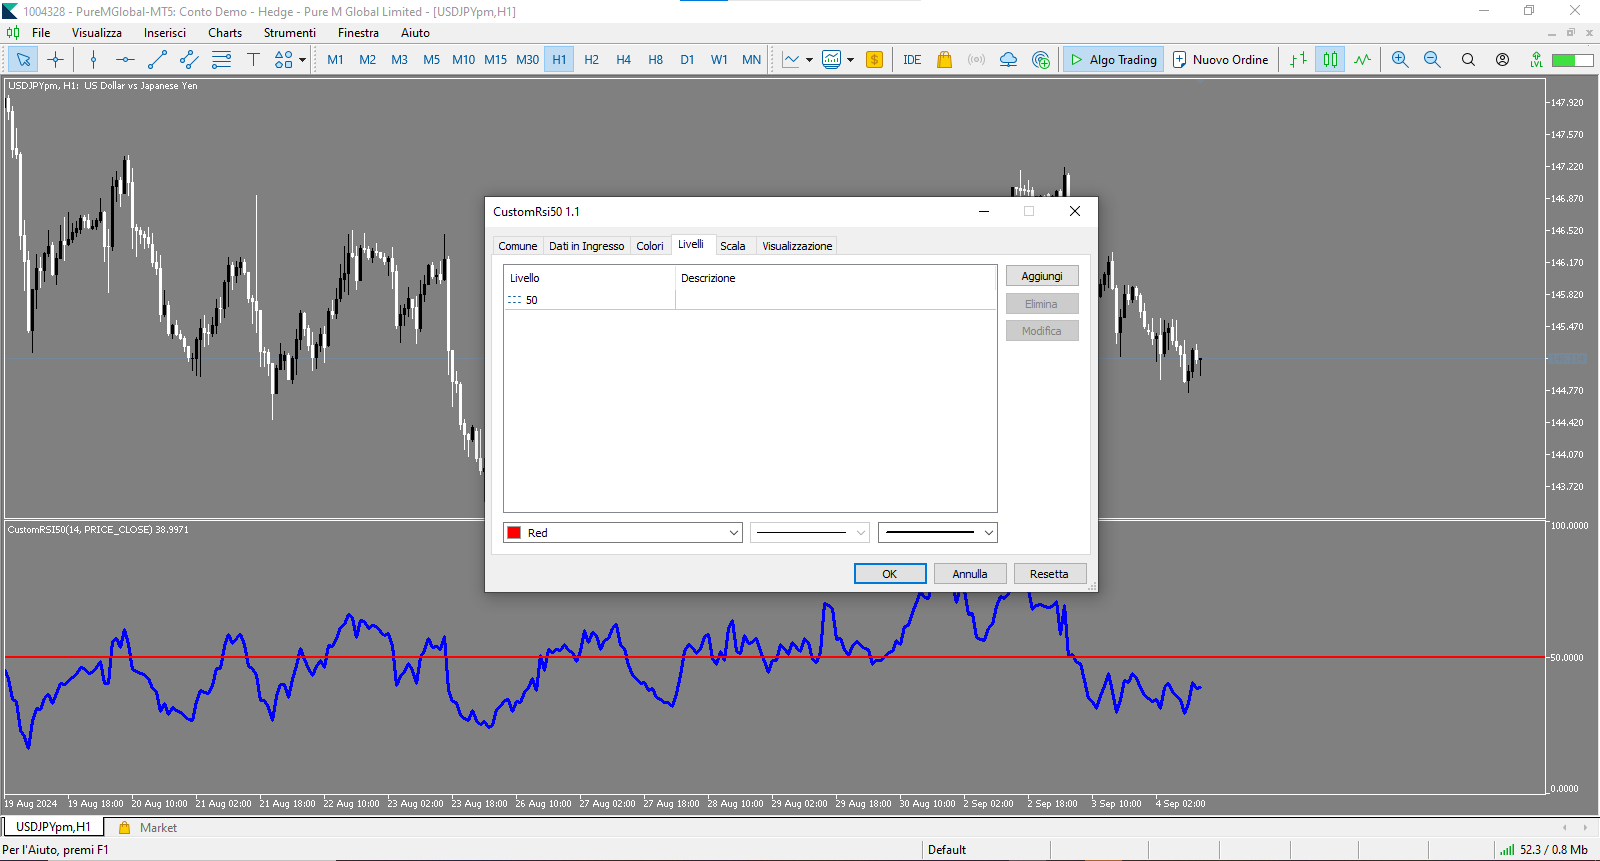
- Nivel de referencia 50 resaltado
- Tipo de precio aplicado personalizable
- Visualización en ventana separada
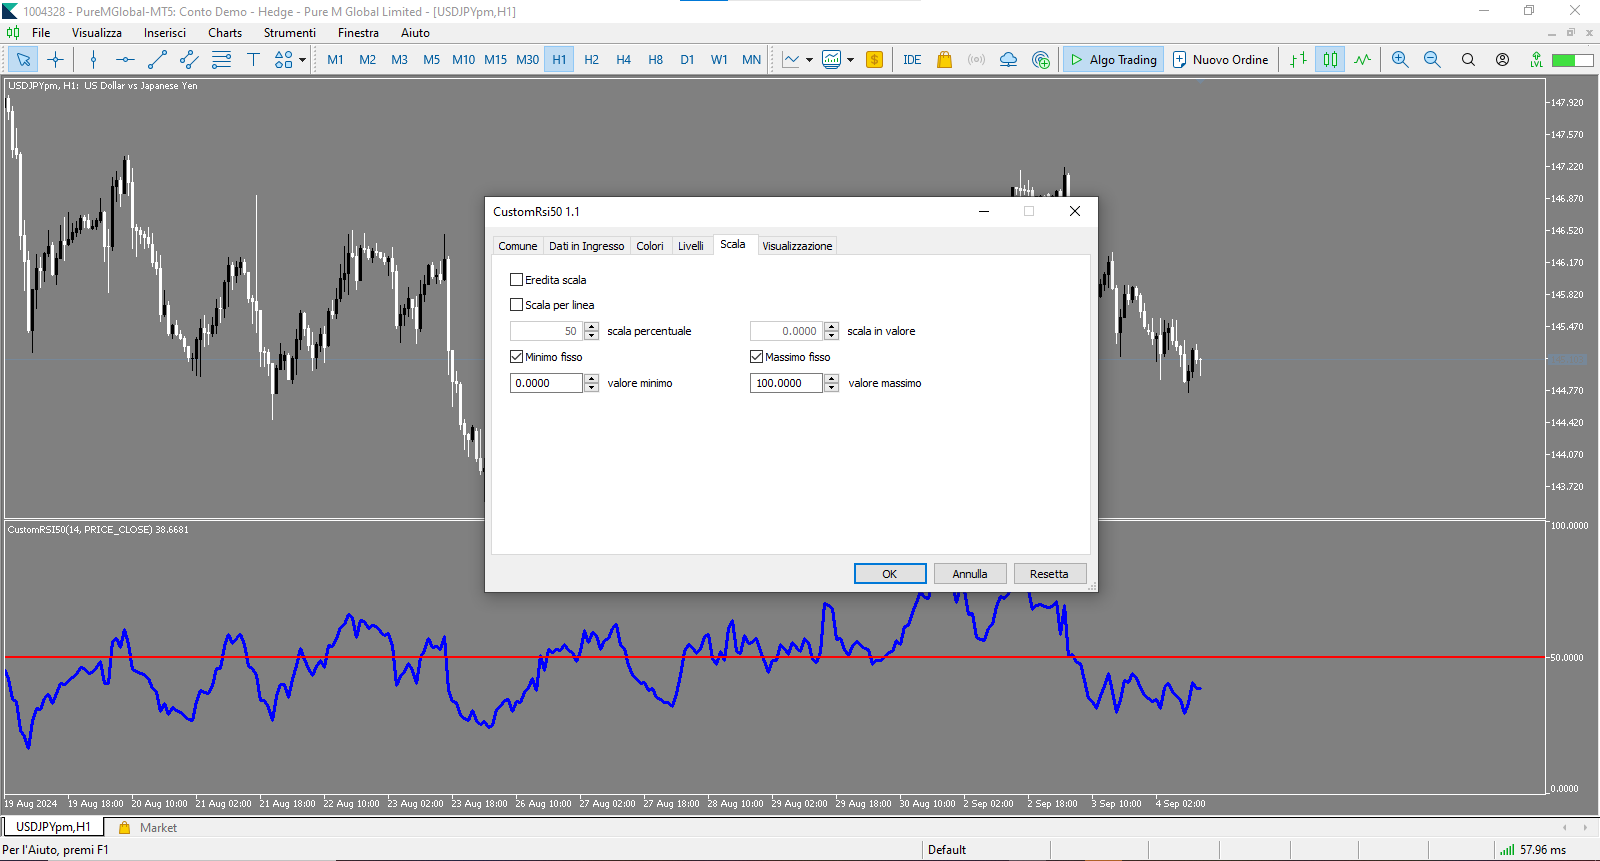
- Escala fija de 0 a 100 para una fácil interpretación
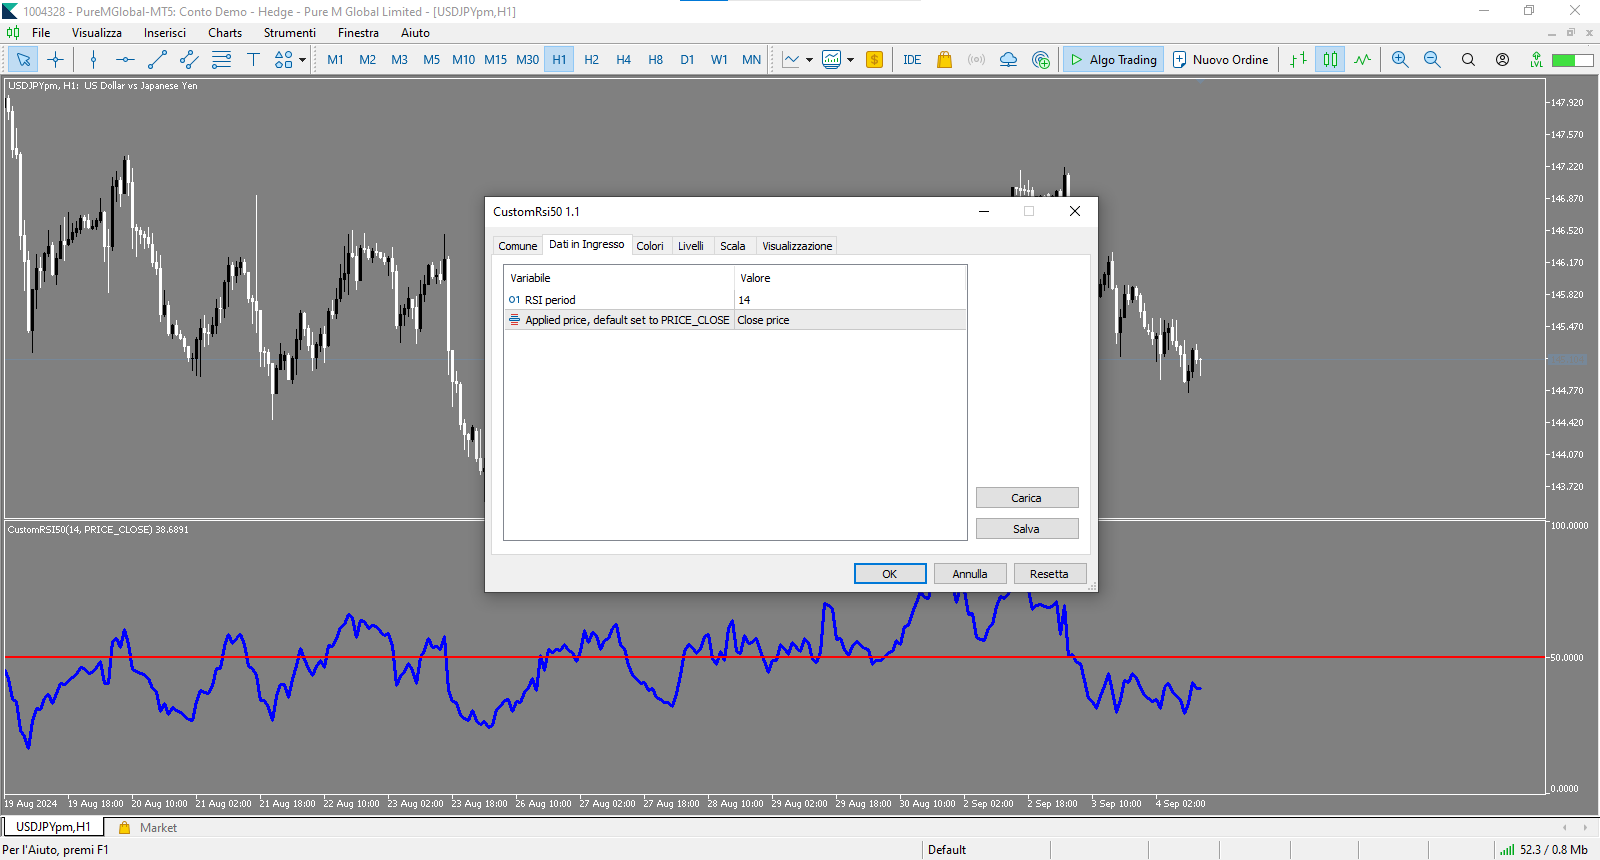
Parámetros Personalizables
- RSI_Period: Permite establecer el período para el cálculo del RSI (predeterminado: 14)
- applied_price: Permite seleccionar el tipo de precio a utilizar para el cálculo (predeterminado: precio de cierre)
Cómo Utilizar CustomRSI50
- Aplica el indicador a cualquier gráfico en tu MetaTrader 5.
- Personaliza el período RSI y el tipo de precio según tus preferencias.
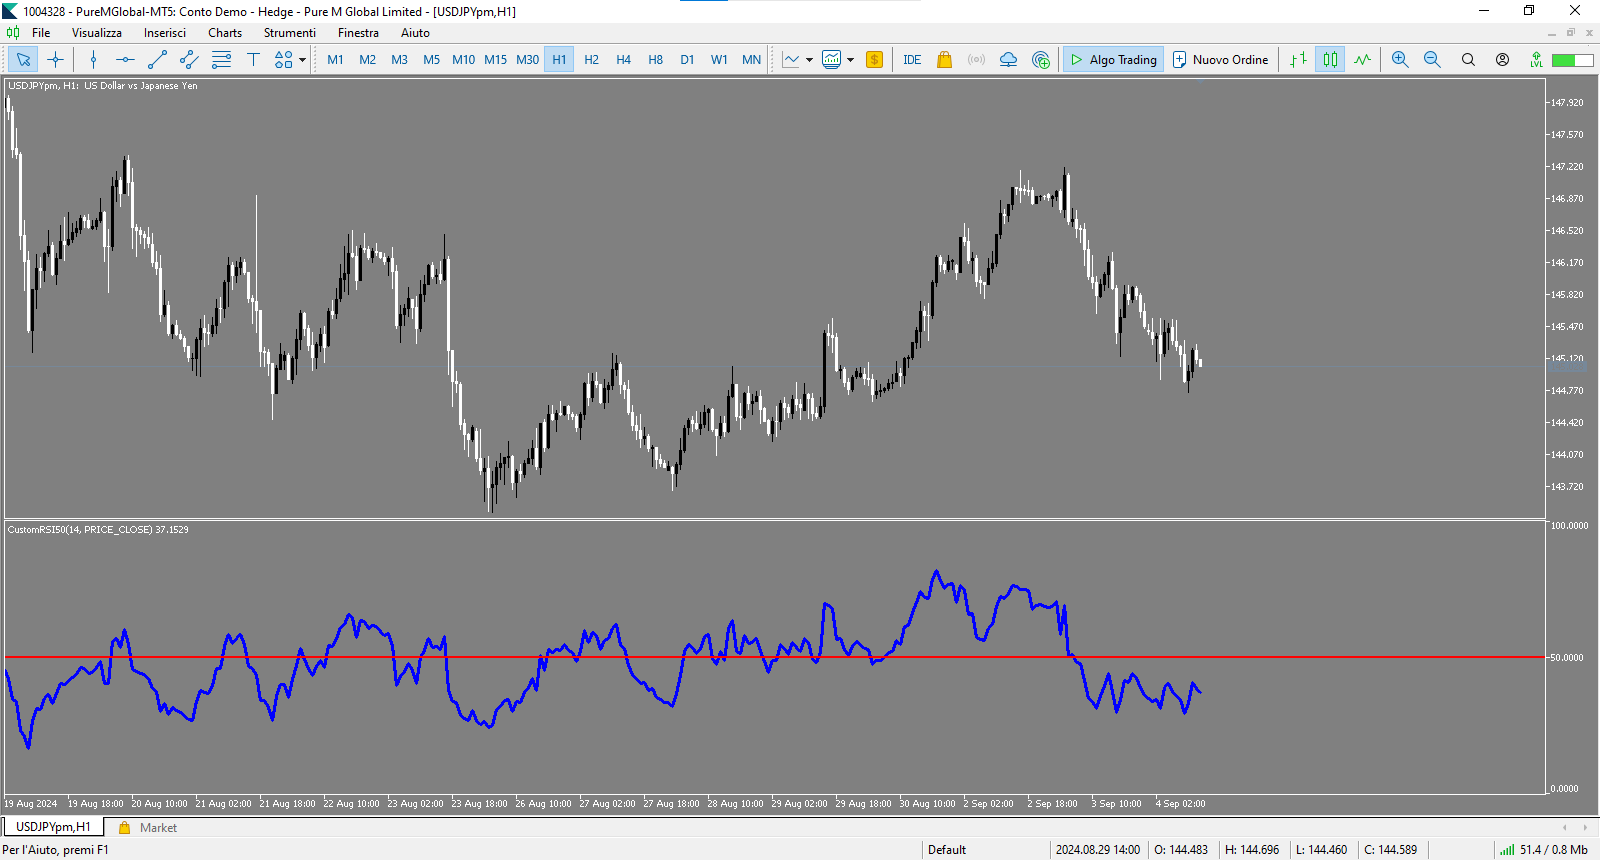
- Observa el movimiento del RSI en relación al nivel 50:
- Valores por encima de 50 indican un momentum alcista.
- Valores por debajo de 50 indican un momentum bajista.
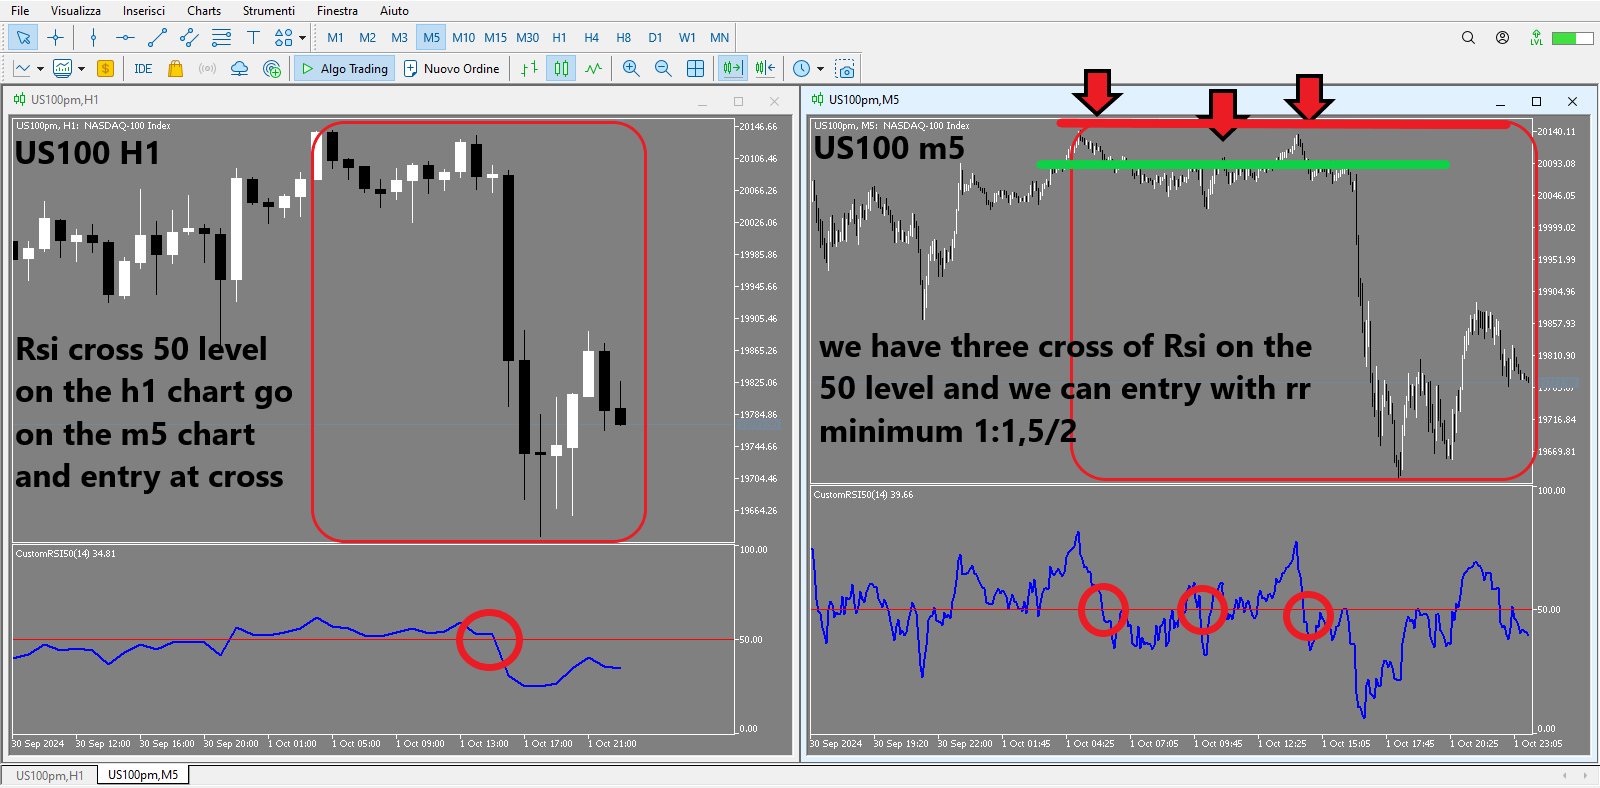
Interpretación de Señales y Ciclos Superiores
El indicador proporciona señales basadas en el cruce del RSI respecto al nivel 50. Aquí te explicamos cómo utilizarlo mejor:
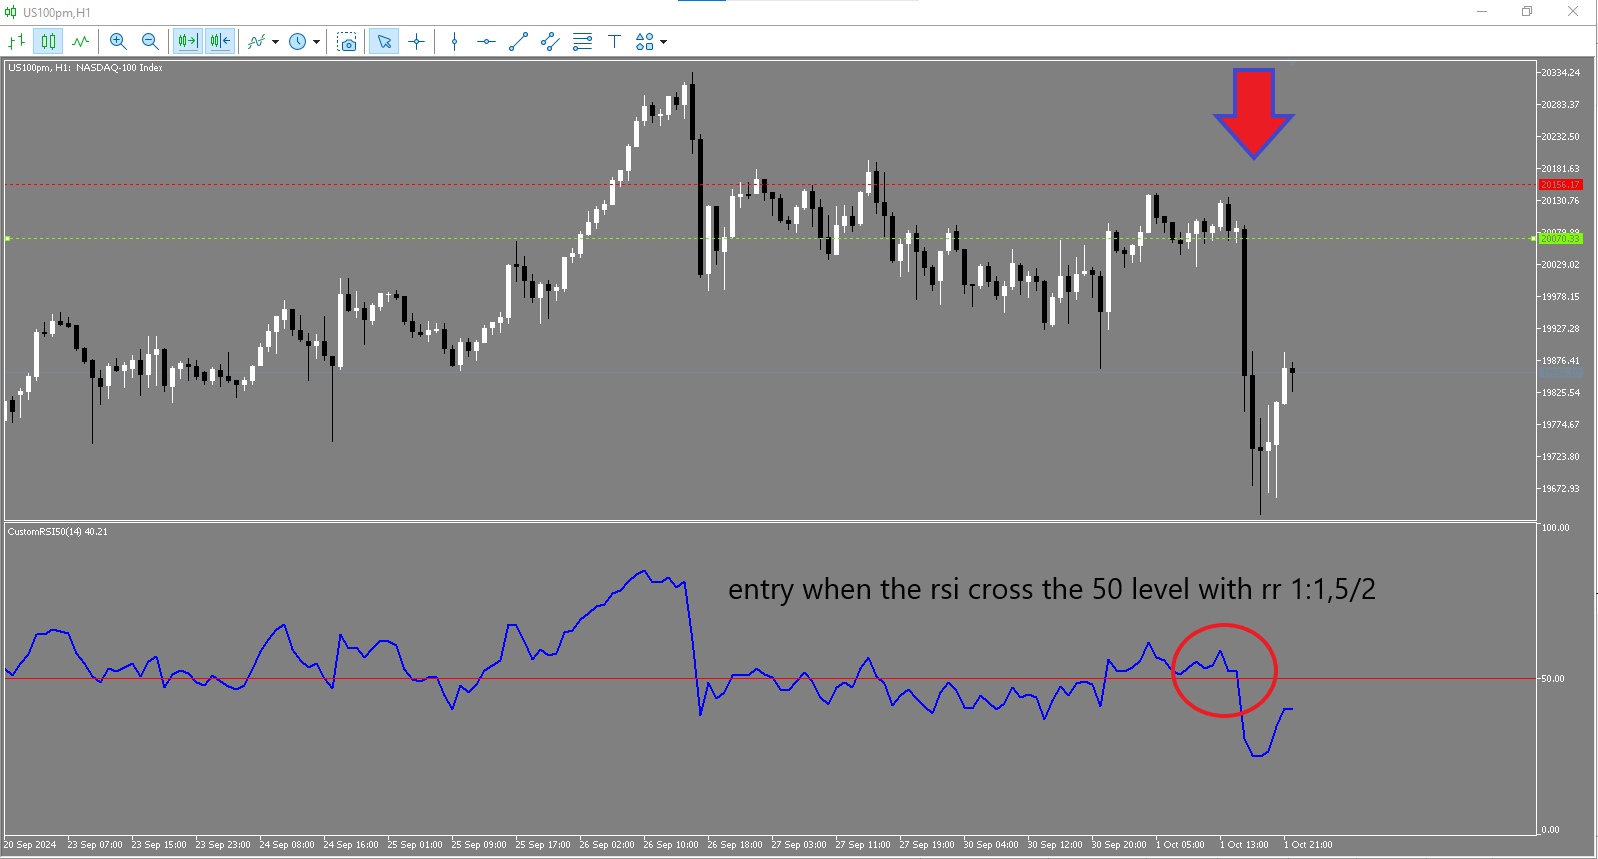
- Señal de entrada: Cuando el RSI cruza el nivel 50 al cierre de la vela, puedes entrar con una relación riesgo/beneficio de 1:1.5, extensible si es necesario.
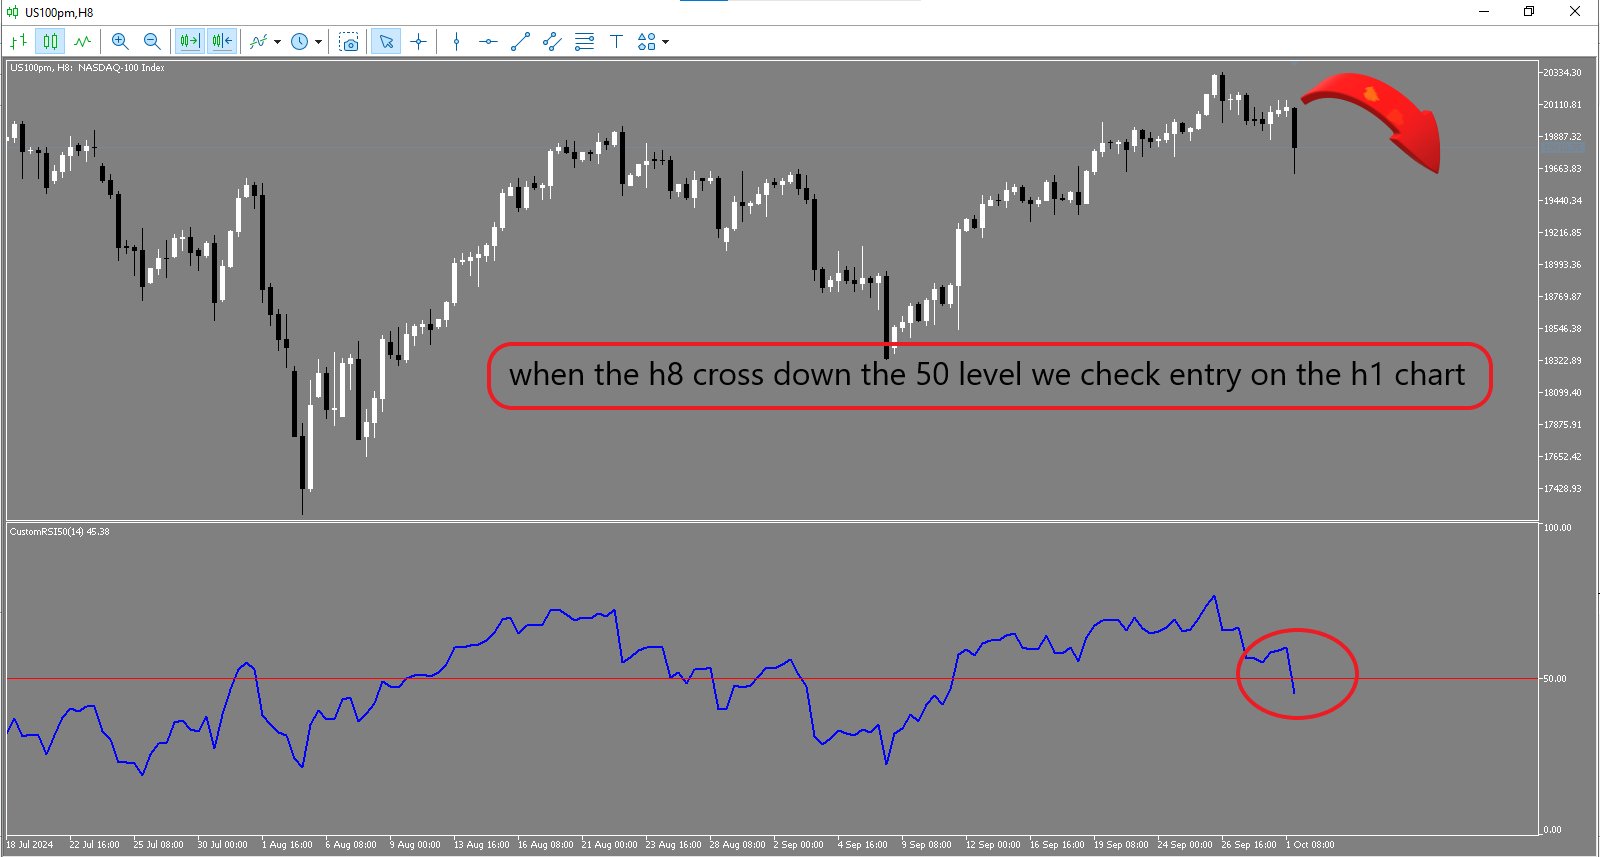
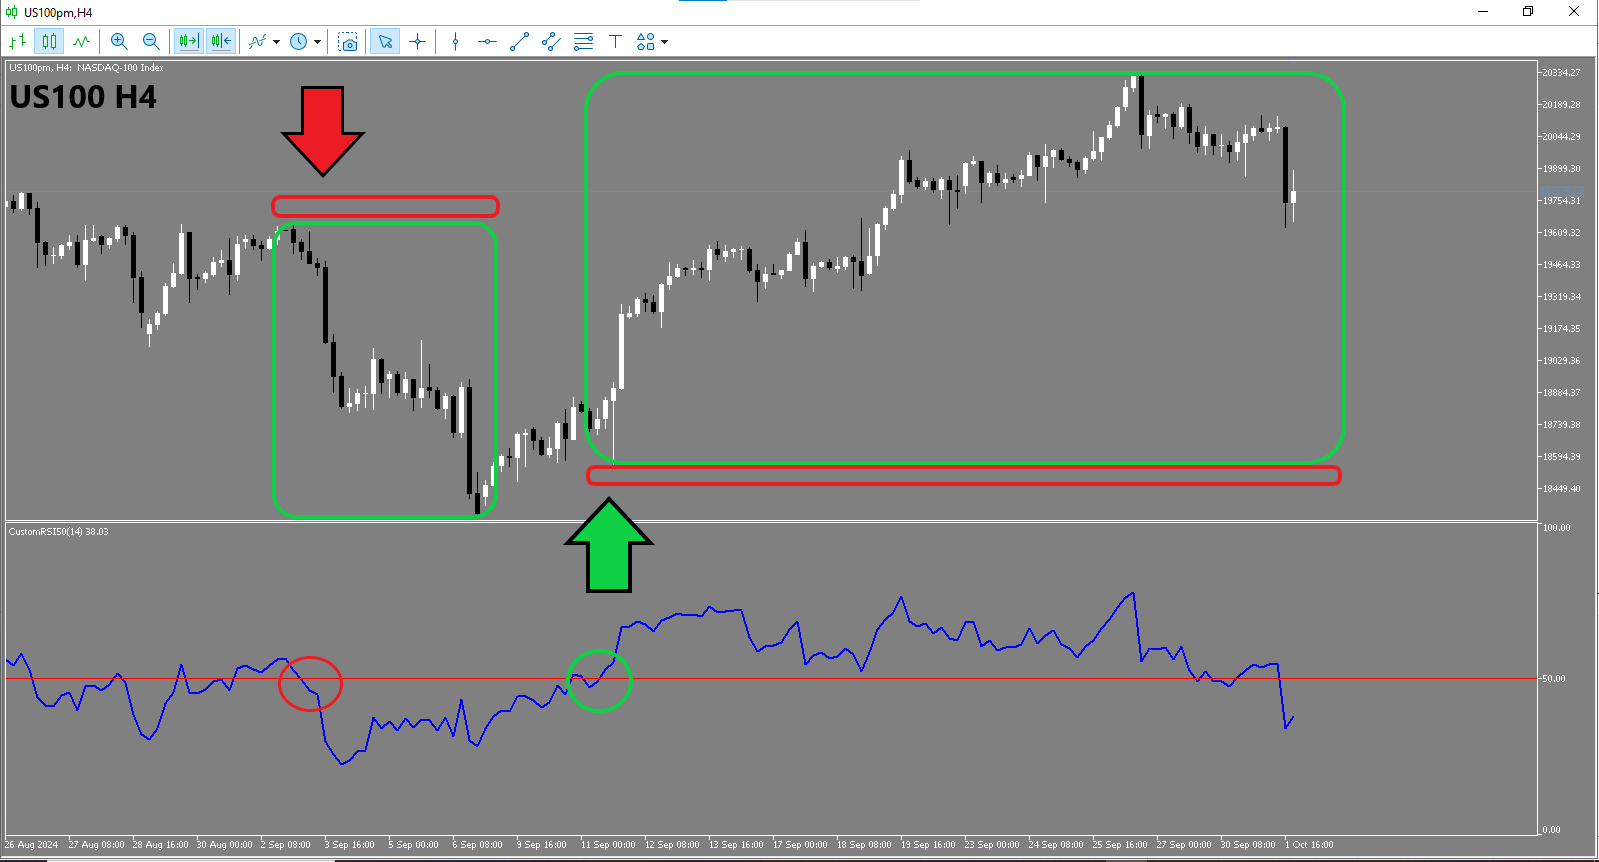
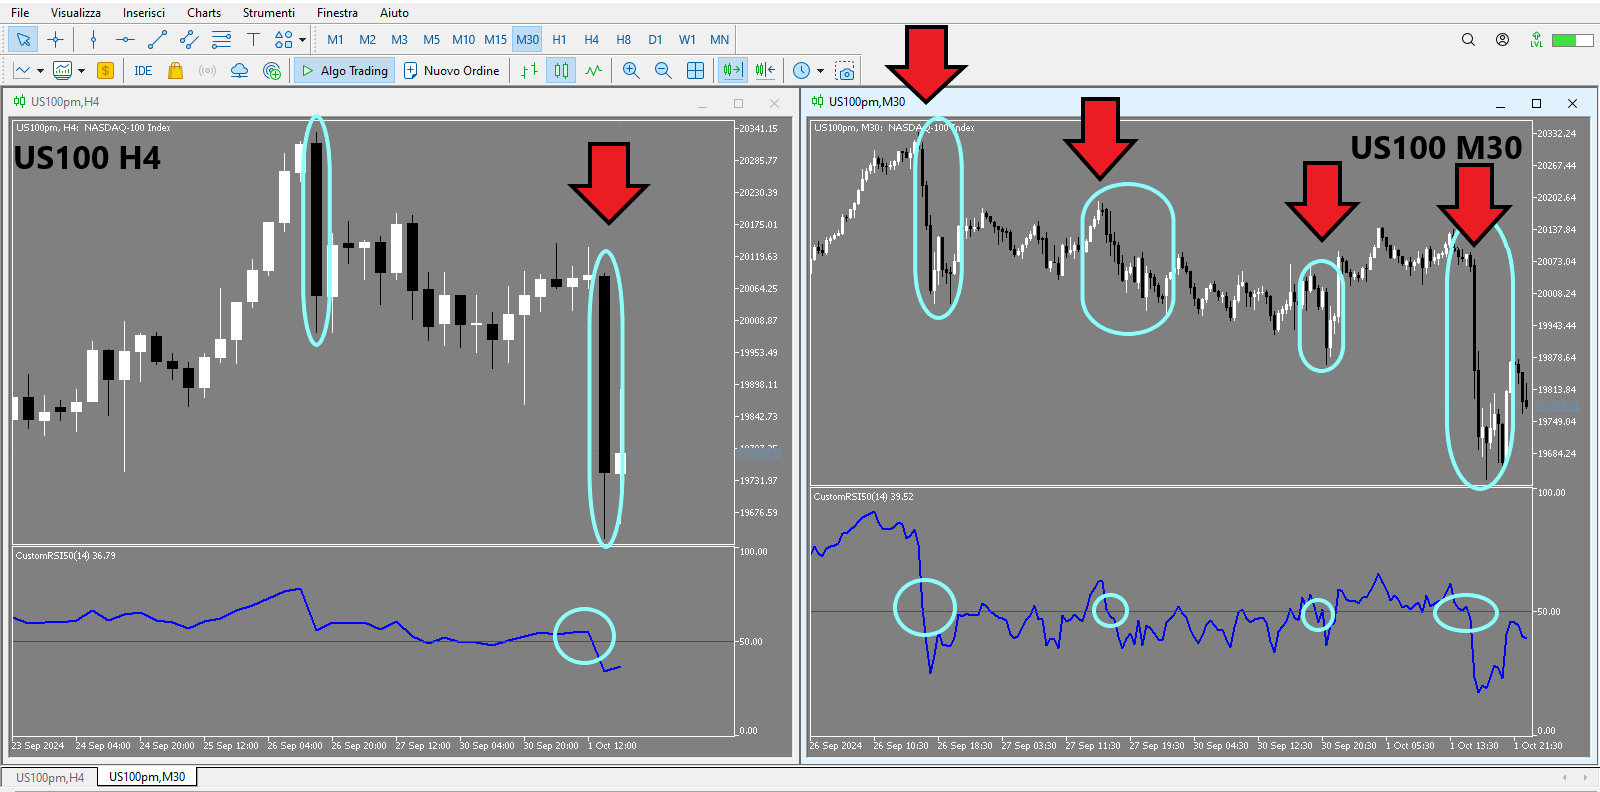
- Confirmación del ciclo superior: Se puede obtener una confirmación adicional observando el comportamiento del RSI en timeframes superiores. Por ejemplo, si en un timeframe mayor (H4 o H8) el RSI está por encima de 50, es preferible buscar solo señales largas en timeframes más pequeños como H1 o M15.
Tabla para la Confirmación del Ciclo Superior
| Timeframe Operativo | Timeframe de Confirmación | Estrategia de Acción |
|---|---|---|
| M5 | H1 | Busca señales largas en M5 solo si el RSI en H1 está por encima de 50; señales cortas si está por debajo de 50 |
| M15 | H4 | Busca señales largas en M15 solo si el RSI en H4 está por encima de 50; señales cortas si está por debajo de 50 |
| H1 | H8 | Busca señales largas en H1 solo si el RSI en H8 está por encima de 50; señales cortas si está por debajo de 50 |
| H4 | Daily | Busca señales largas en H4 solo si el RSI en Daily está por encima de 50; señales cortas si está por debajo de 50 |
Ventajas
- Visualización clara del momentum del mercado
- Fácil identificación de cambios de tendencia alrededor del nivel 50
- Personalización para adaptarse a diferentes estrategias de trading
Versión Avanzada
Descubre la versión avanzada de CustomRSI50AlertAndMail. Disponible por $30, esta versión premium incluye funcionalidades adicionales como el envío de emails y alertas sonoras en cada cruce del RSI respecto al nivel 50, ¡para no perder nunca una señal importante! Haz clic aquí para saber más.
CustomRSI50 es la herramienta ideal para los traders que desean un análisis claro y personalizable del RSI, con un énfasis particular en el nivel crítico de 50. La integración con los ciclos superiores añade un nivel adicional de confirmación, haciendo que el indicador sea fiable para varias estrategias de trading.