• Información general
  • Comentarios
  • Discusión

FX Grid Scalper Plus

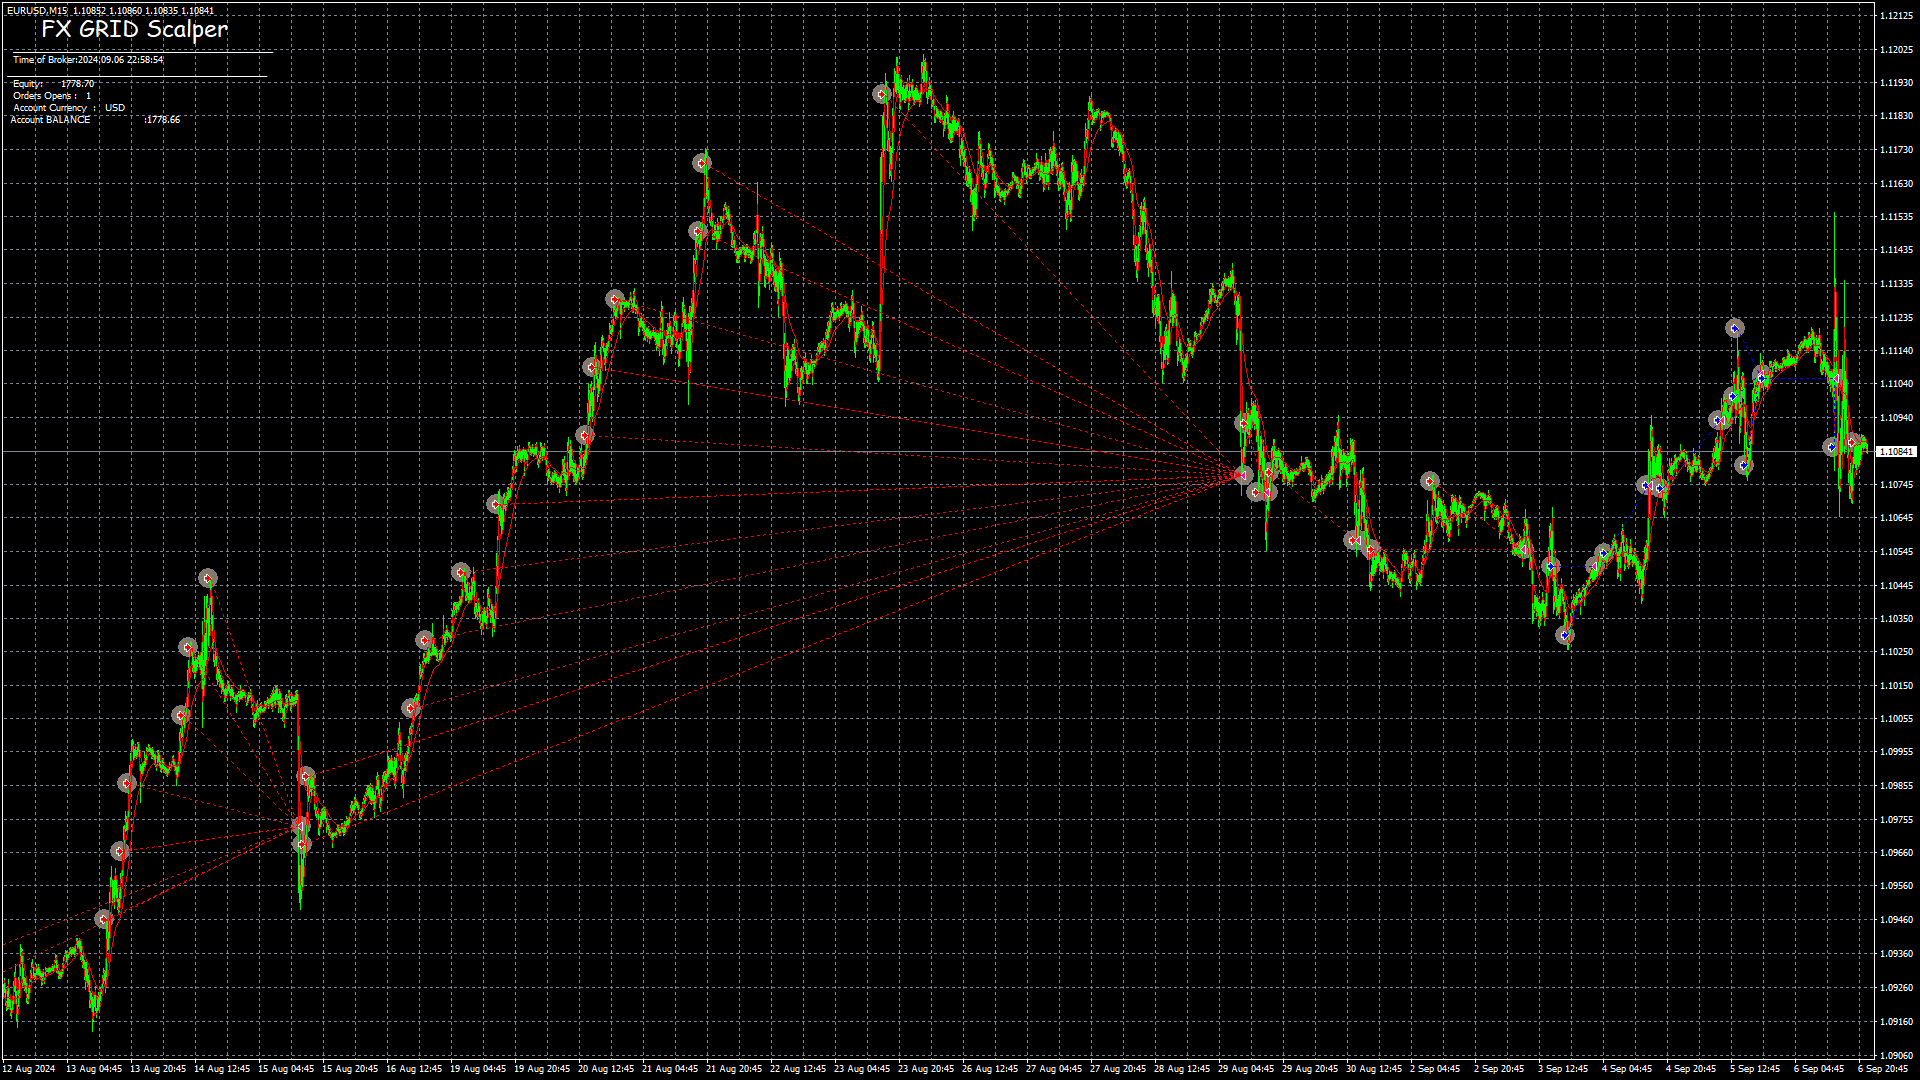
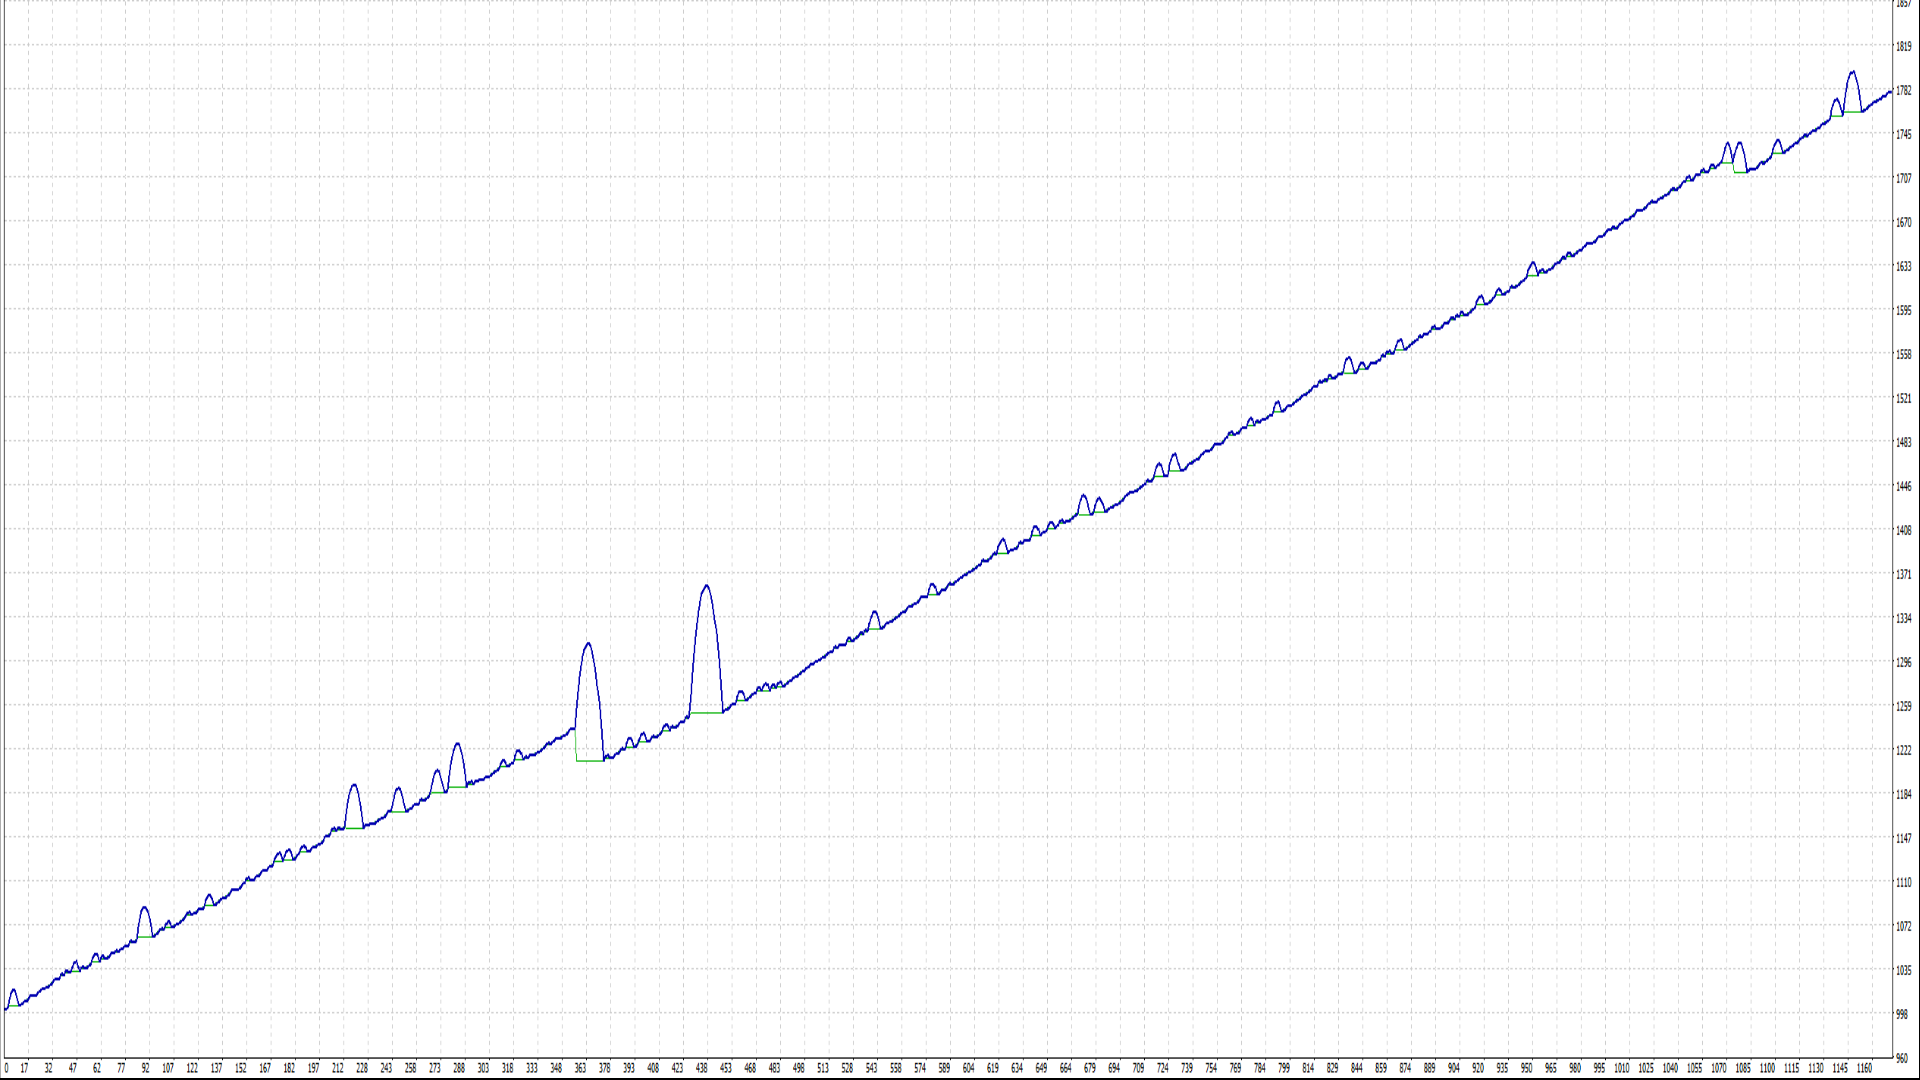
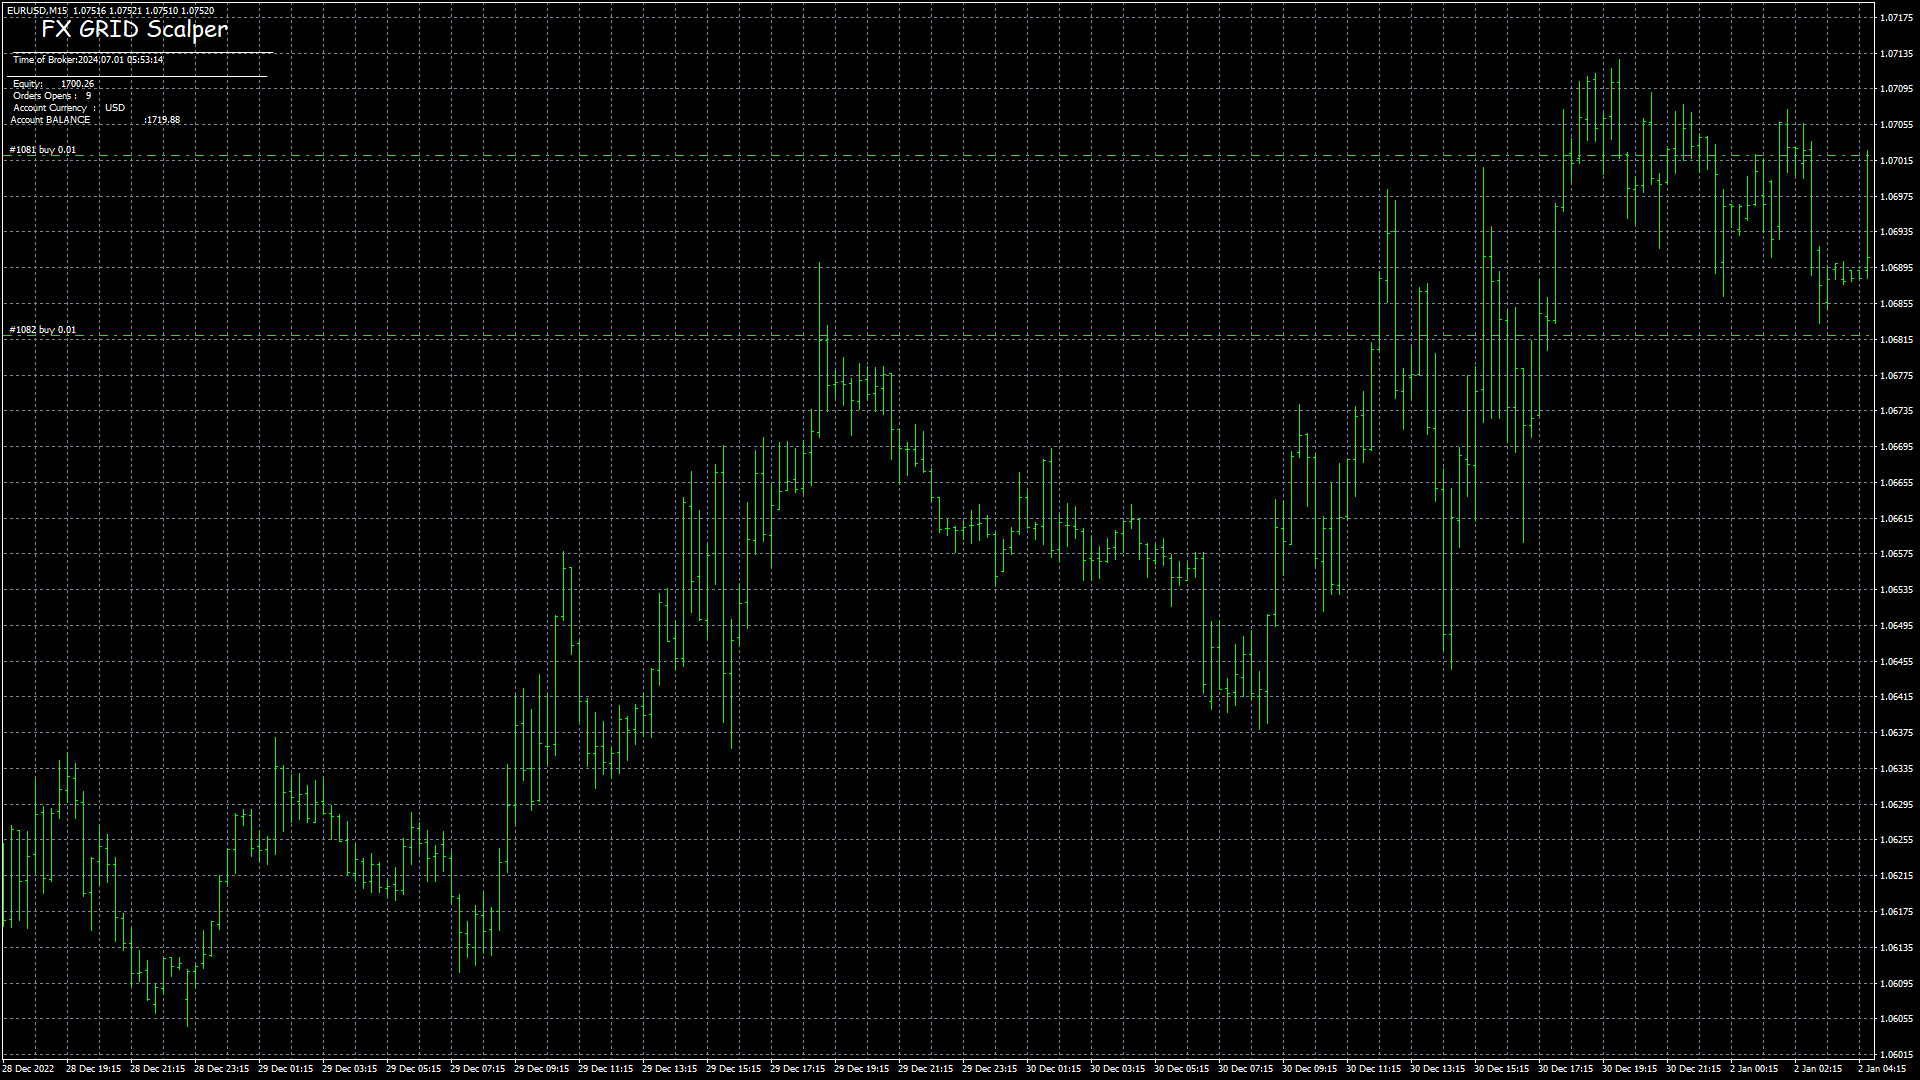
FXGrid Scalper Plus is an advanced Expert Advisor (EA) designed to trade the foreign exchange (Forex) market with a focus on scalping strategies. This powerful tool was developed for traders looking to capitalize on small price movements in a short period of time, using a dynamic grid approach.

Key Features
Dynamic Grid Strategy: Uses a scalable grid approach to manage multiple positions, taking advantage of short-term fluctuations in the market.

High Execution Speed: Optimized to execute orders quickly, ensuring you take advantage of the best trading opportunities.

Multi-Currency Pair Support: Can be used on different currency pairs, making it versatile for various market scenarios.
Otros productos de este autor
TrendStoch Channel Pro
Rodolfo Leonardo De Morais
¡Presentamos nuestro indicador revolucionario - "TrendStoch Channel Pro"! Esta poderosa herramienta permite a los operadores obtener una visión integral del mercado al combinar a la perfección dos características esenciales: observar tendencias temporales más largas y el canal estocástico, directamente en su gráfico. Con "TrendStoch Channel Pro", experimentará un nuevo nivel de precisión comercial. La capacidad del indicador para mostrar tendencias temporales más largas le permite identif
StellaX
Rodolfo Leonardo De Morais
Unlock the Power of Precision Trading with Our Advanced Trend & Stochastic Channel Indicator! Are you tired of missing out on big market moves? Struggling to stay ahead of market trends? It's time to elevate your trading strategy with our cutting-edge Trend & Stochastic Channel Indicator—your ultimate tool for mastering the markets. Why This Indicator Is a Game-Changer: 1. See the Bigger Picture: Stop getting lost in the noise of short-term fluctuations. Our indicator lets you observe larger t
Fx2Core
Rodolfo Leonardo De Morais
IS THE EA MARTINGALE? YES THERE ARE 4 TYPES OF GRID FUNCTION. IF YOU DO NOT LIKE MARTINGALE THEN CHOOSE THE OTHER 3 REMAINING GRID FUNCTIONS THAT IS FIXES START / SUMM START LOT / STEP LOT /  DOES THE EA HAVE STOP LOSS YES DOES THE EA HAVE EQUITY PROTECTION? YES TOTAL 2 DOES THE EA HAVE MAX BUY AND MAX SELL POSITIONS? YES DOES THE EA HAVE TRAILING AND BREAKEVEN? YES DOES THE EA HAVE TAKE PROFIT IN DOLLAR AMOUNT? YES DOES THE EA OPEN ON CANDLE OPEN? YES BUT WE SET THIS TO FALSE AS WE
HeikenashiSmoothing
Rodolfo Leonardo De Morais
Heiken ashi Smoothing in separate window MTF The color of the Heiken-Ashi candles depend on their shadows. The advantage of the Heiken-Ashi chart is that the trend is determined very simply, the upward-facing sails are blue, and the downward-tendency sails are red. For profitable trading it is necessary to use it with the standard candles (make analyzes) and with the other indicators. Indicator Parameters TimeFrame - Graphic time being 0 = Current graph time, 1 = M1, 5 = M5, 15 = M15, 30 = M30
Heat Candle
Rodolfo Leonardo De Morais
The volume is a graphical indicator that shows the number of shares traded in a specified period (for example, minutes / hours / days / weeks / months, etc.) for a particular asset. Volume analysis is a basic, yet very important, element of technical analysis. It provides clues as to the intensity of price movements. In addition, the volume can confirm the strength of a trend. Standard candles do not provide a visual way of looking at buying power and selling power. With that in mind, I crea
Trend Background
Rodolfo Leonardo De Morais
Anyone who is experienced in trading knows that longer time signals are trend signals. That's why it's always good to follow the trends of longer times to make a good trade. With that in mind, I created the trend indicator in the background Indicator Parameters TFBar  - TimeFrame BackgroundEnabled -  Enable Background NumbersOfBars  - Numbers of Bar draw ColorUp - Color Up ColorDown - Color Down Smoothing -  Heiken-Ashi Smoothing Average
VelocityVisor
Rodolfo Leonardo De Morais
This indicator allows you to view the speed of price movement based on the time set in seconds Indicator Parameters VisorVelocity_Price_Up_Color -  Color to UP price VisorVelocity_Price_Down_Color - Color to Down  price VisorVelocity_Price_Zero_Color -  Color to Zero VisorVelocity_Price_X_Position - Posicion horizontal in chart VisorVelocity_Price_Y_Position - Posicion vertical in chart VisorVelocity_Price_Size - Size price font VisorVelocityTime - Time to calcule
Trend Bear Bull Power
Rodolfo Leonardo De Morais
Elevate Your Trading with the Ultimate Market Visualization Indicator! Imagine having the power to visualize price movements across multiple time frames, clearly identify Bull and Bear Market periods, and gauge their strength—all within a single, intuitive tool. With our revolutionary Market Visualization Indicator, you can do just that and more. Why This Indicator Is a Must-Have: 1. Multi-Time Frame Mastery: Stop limiting your analysis to one time frame. Our indicator allows you to seamlessly
Market Line Price Color
Rodolfo Leonardo De Morais
Simple Market Line Price Color This indicator allows you to see the market's aggregation by buying or selling on the price line. when it is attacked the sale turns into a color when it is attacked the purchase takes on another color Indicator Parameters indicator_colorUP - Color of UP price  aggregation   indicator_colorDown - Color of Down    price    aggregation   indicator_WIDTH - WIDTH Line in chart Good Trades 
FREE
Market Price Color
Rodolfo Leonardo De Morais
This indicator allows you to see the market's aggregation by buying or selling on the price . when it is attacked the sale turns into a color when it is attacked the purchase takes on another color Indicator Parameters Price_Up_Color - Color price to UP Price_Down_Color - Color price to Down Price_X_Position - Position Horizontal Price_Y_Position- Position Vertical Price_Size -  Size font
FREE
Trend Show Volume
Rodolfo Leonardo De Morais
Trend Show Volume This indicator allows you to visualize volume distortions. When the volume increases by x percent we have different colors and sizes plotted. Indicator Parameters pPercentShow -  Percentage of volume on which different colors and sizes will be plotted pLength - Average applied to volume [background bar] pModeMA - Type of media applied to the volume
Trend Price Actions
Rodolfo Leonardo De Morais
[Trend Price Actions ] This indicator allows you to plot higher time moving averages on lower time charts with color trend change indicator. [Indicator Parameters] [pTimeFrame] -  [Timeframe for calcule    moving average ] [pTrendPeriod] -  [Period   moving average] [pTrendPrice]  - [Price of   moving average] [pTrendPow]   -  [Power of the moving average movement] ...
OrionZ
Rodolfo Leonardo De Morais
OrionZ  This indicator allows you to view the price trend and channel. When the price is above the average we have a trail color when the price is below we have another Indicator Parameters [pTimeFrame] - [Timeframe for calcule  moving average] [pPeriod] - [ Period  moving average] [pMethod] - [ Method  moving average] [pPrice] - [ Price applied  moving average] [ChannelSpace] -  [ Channel space between the average price]  
FxPlus
Rodolfo Leonardo De Morais
FXPLUS is an Expert Advisor designed to trade on the market fluctuation grid using the MetaTrader 4 (MT4) platform. This powerful EA allows extensive customizations to suit your strategies to optimize profits and better adapt to your conditions. Outstanding Features Grid Martingale Strategy: Utilizes the grid Martingale method to manage orders effectively. Flexible Customization: Offers extensive parameter customization, allowing adjustments according to the user's trading style and risk to
Trend Background MT5
Rodolfo Leonardo De Morais
Anyone who is experienced in trading knows that longer time signals are trend signals. That's why it's always good to follow the trends of longer times to make a good trade. With that in mind, I created the trend indicator in the background Indicator Parameters TFBar  - TimeFrame BackgroundEnabled -  Enable Background NumbersOfBars  - Numbers of Bar draw ColorUp - Color Up ColorDown - Color Down Smoothing -  Heiken-Ashi Smoothing Average inpMA_METHOD -  Smoothing Method width - Size Line bor
Filtro:
No hay comentarios
Respuesta al comentario