WaPreviousCandleLevelsMT5
- Indicadores
- Wachinou Lionnel Pyrrhus Sovi Guidi
- Versión: 1.1
- Actualizado: 2 septiembre 2024
!!!This Free Version just works on EURUSD!!!
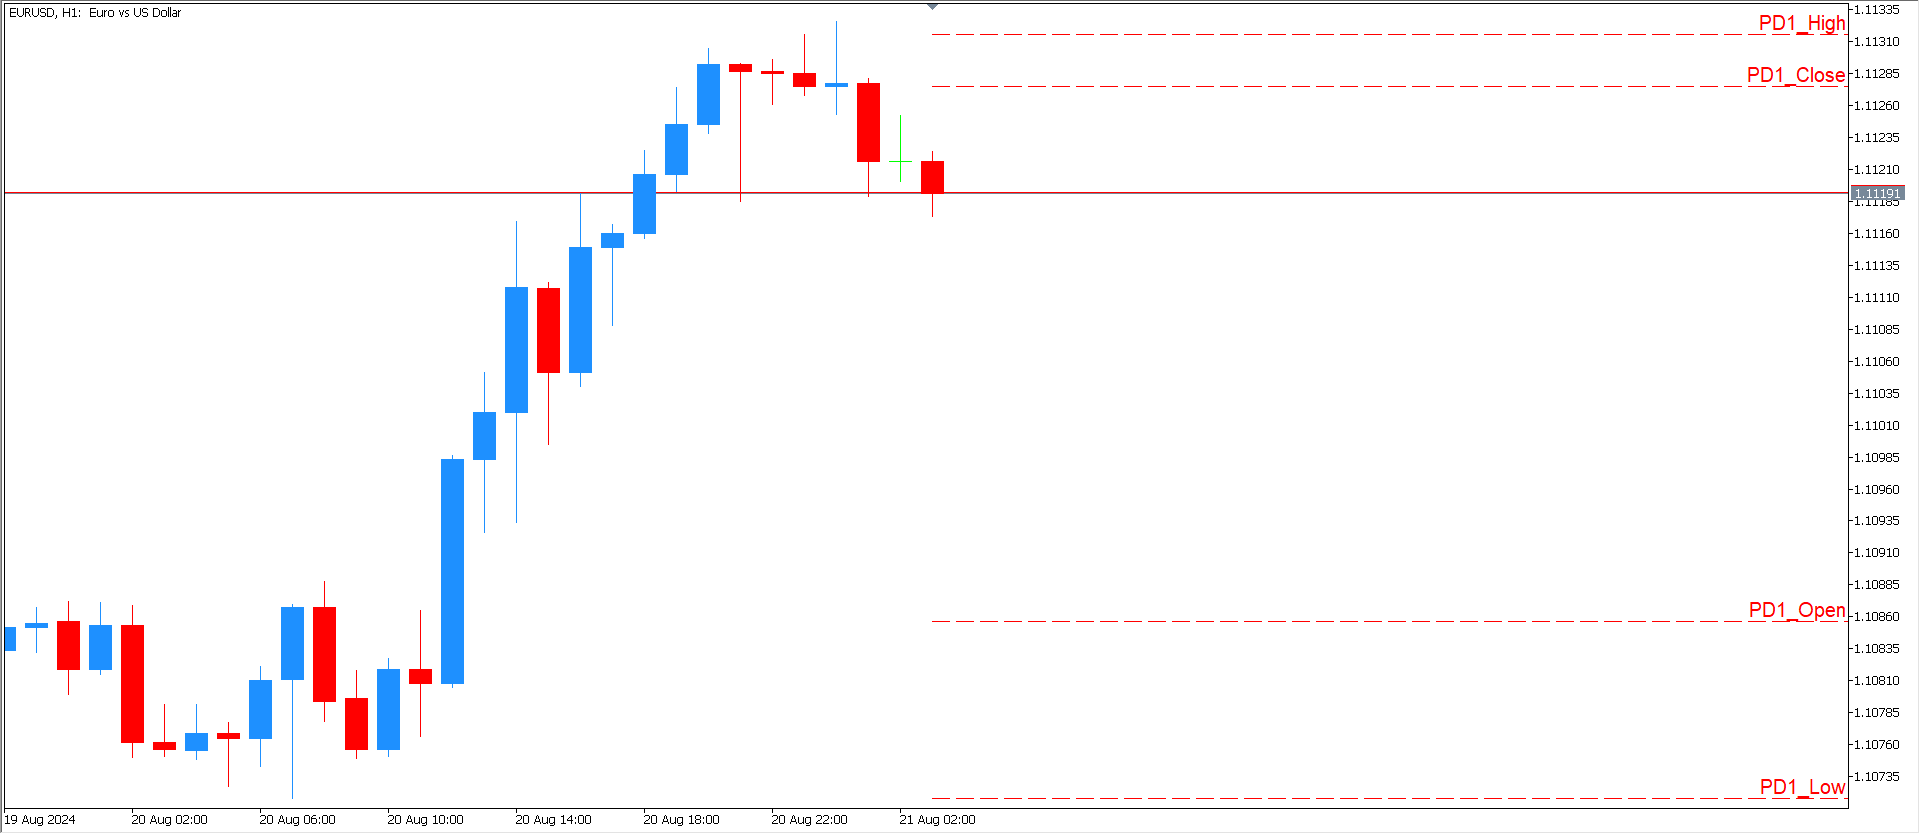
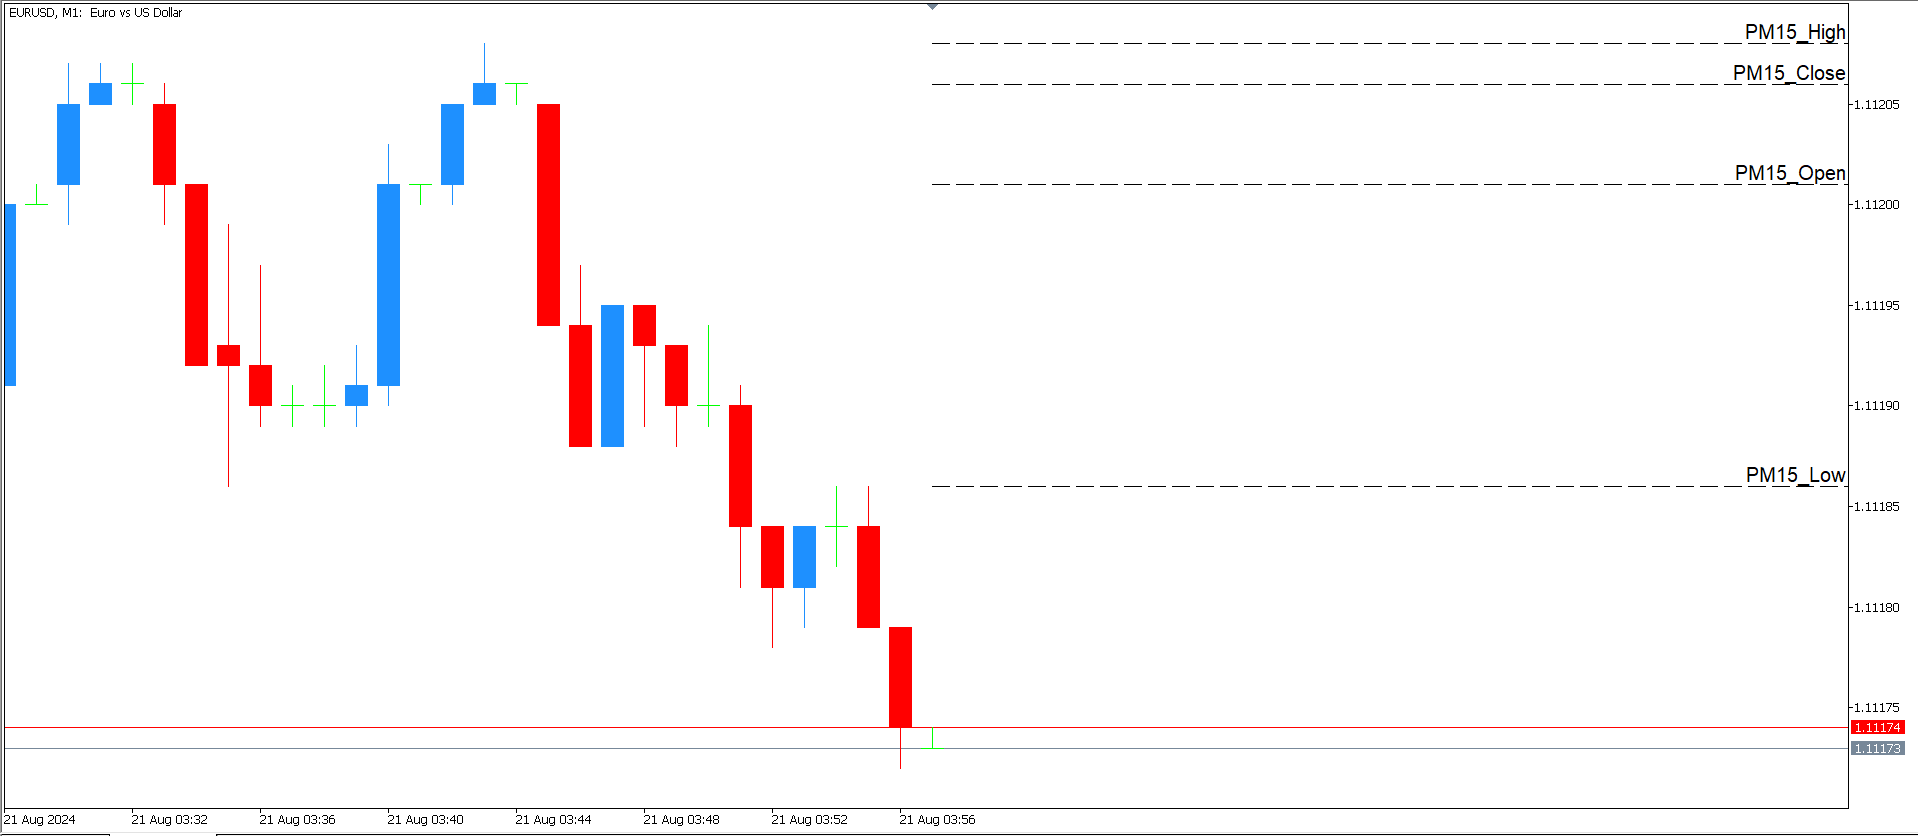
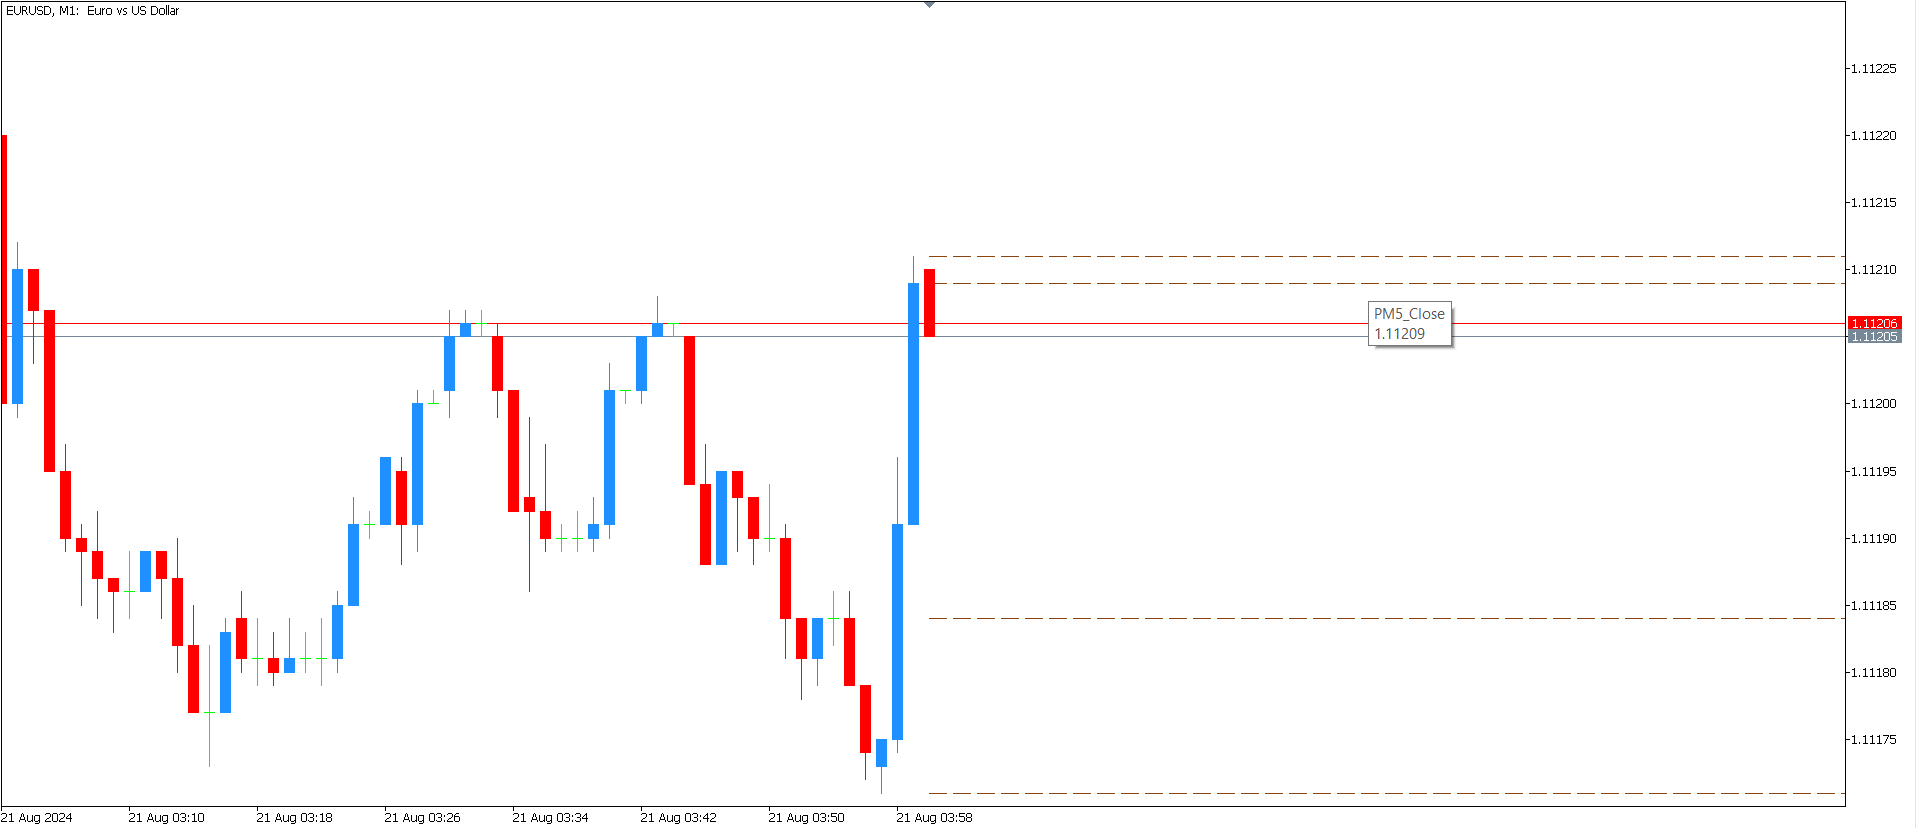
Wa Previous Candle Levels MT5 shows the previous candle levels, it shows the previous candle Open High Low Close levels (OHLC Levels) in different time frame.
It's designed to help the trader to analyse the market and pay attention to the previous candle levels in different time frame.
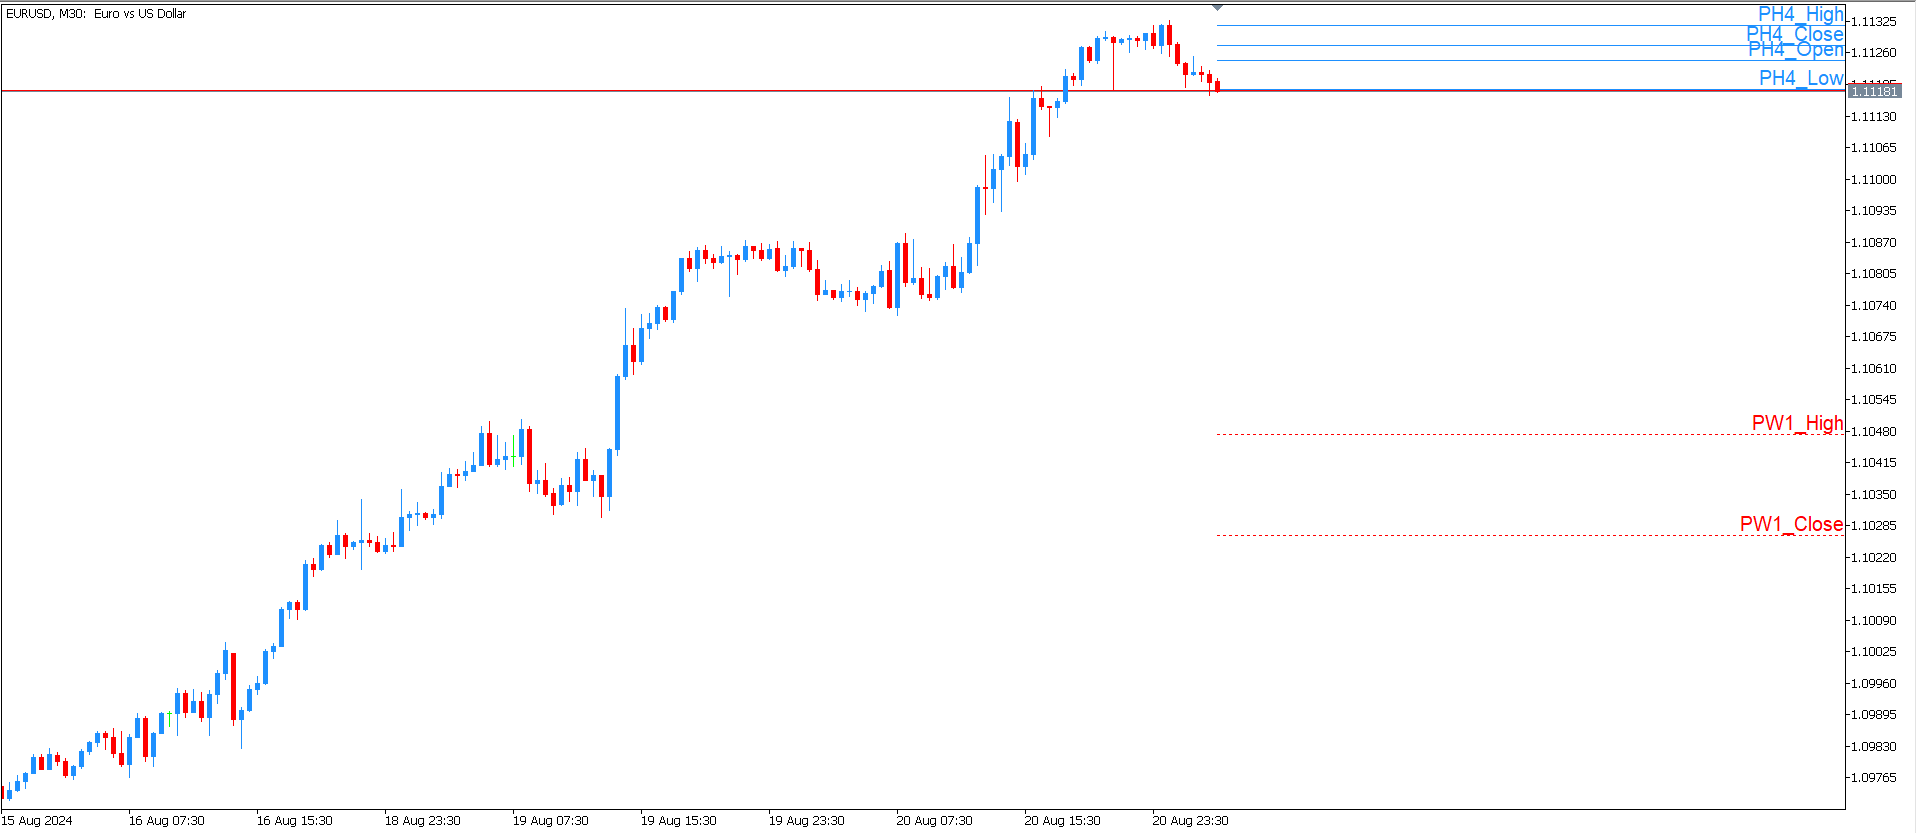
We all know that the OHLC Levels in Monthly, Weekly and Daily are really strong and must of the time, the price strongly reacts at those levels.
In the technical analysis, the user can use them as a support and resistance.
It will help you to efficiently place your Stop Loss (SL) and Take Profit (TP).
The user can:
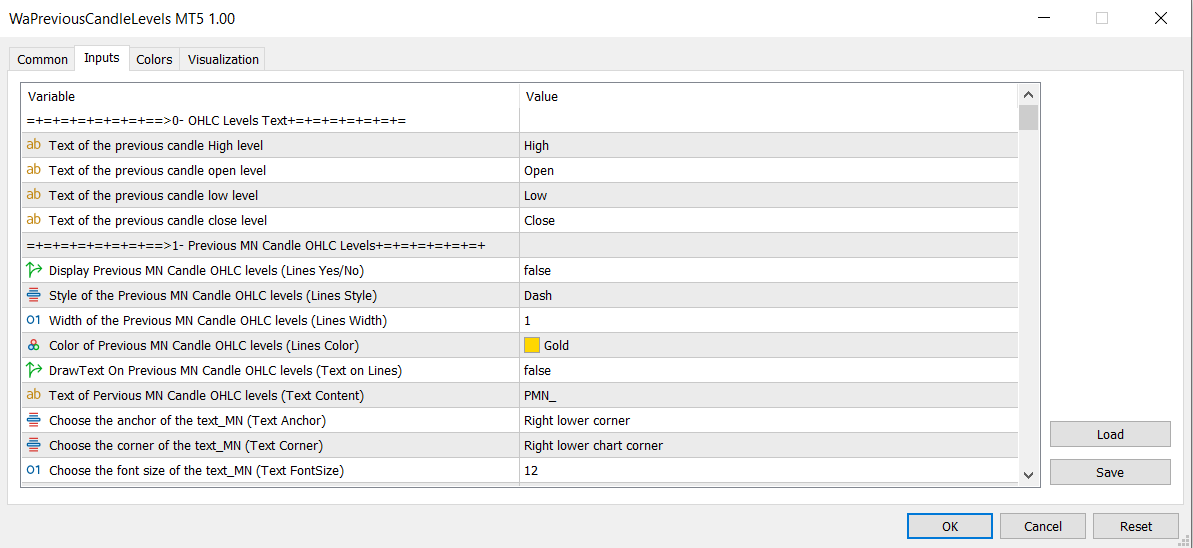
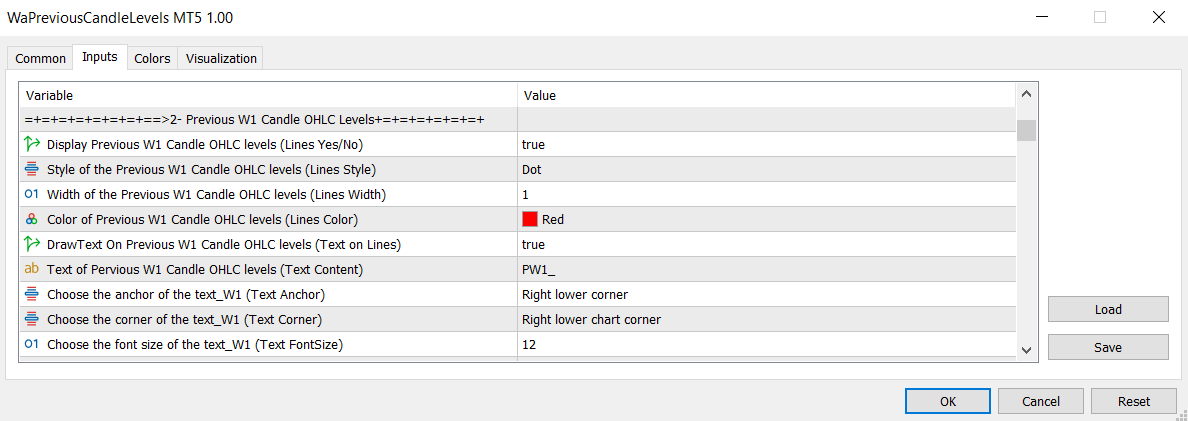
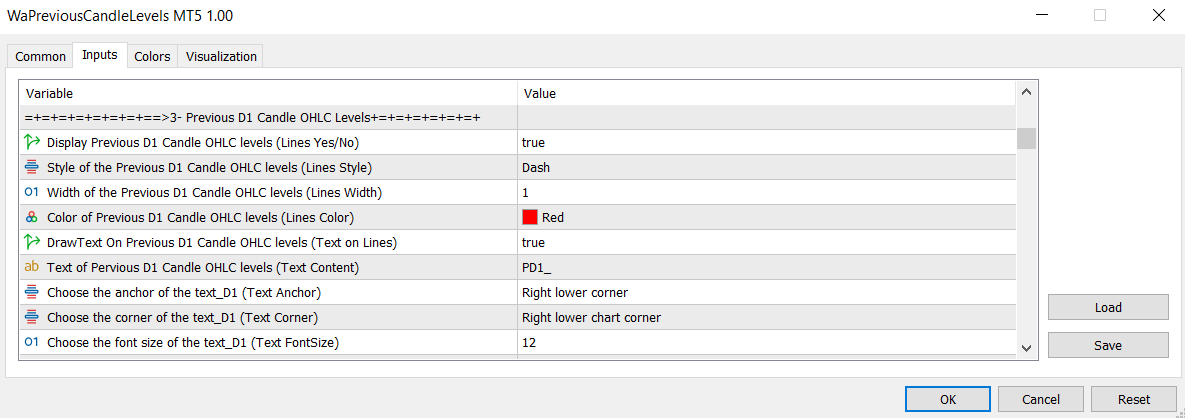
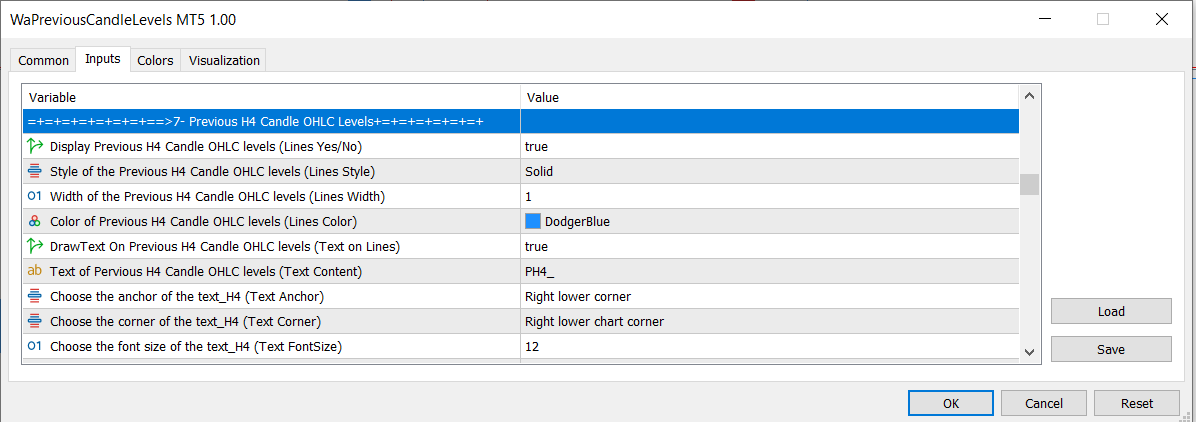
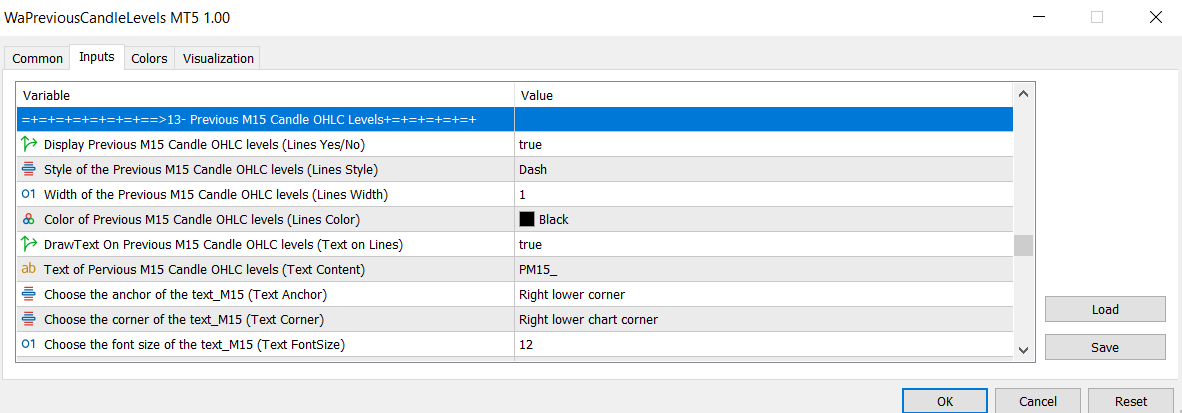
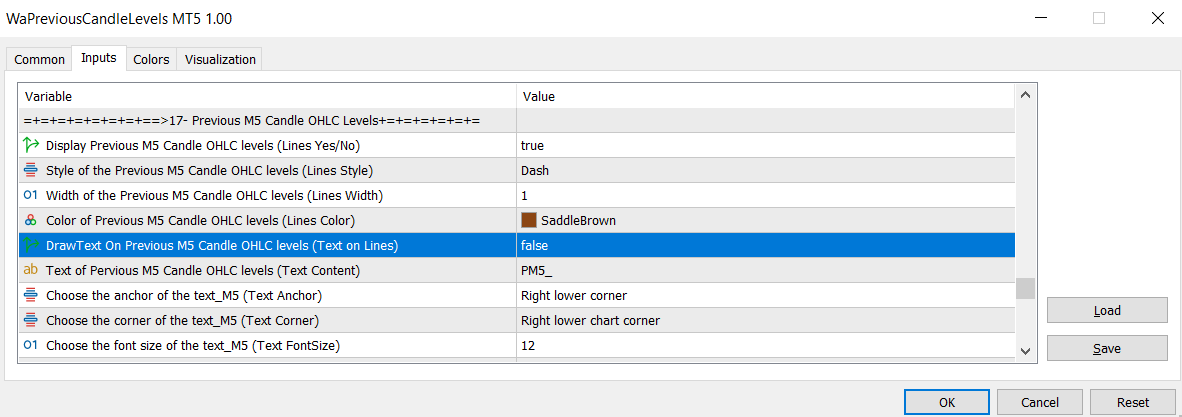
* choose to display Previous Candle OHLC levels in the timeframe that he/she wants;
* choose the style of the line of the Previous Candle OHLC levels;
* input the width of the Previous Candle OHLC levels;
* choose the color of Previous Candle OHLC levels, and can also choose different colors for different time frames;
* choose to draw on the level the text that he/she wrote on Previous Candle OHLC levels;
* write his/her own text on Pervious Candle OHLC levels;
* choose the anchor of the text;
* choose the corner of the text;
* input the font size of the text.
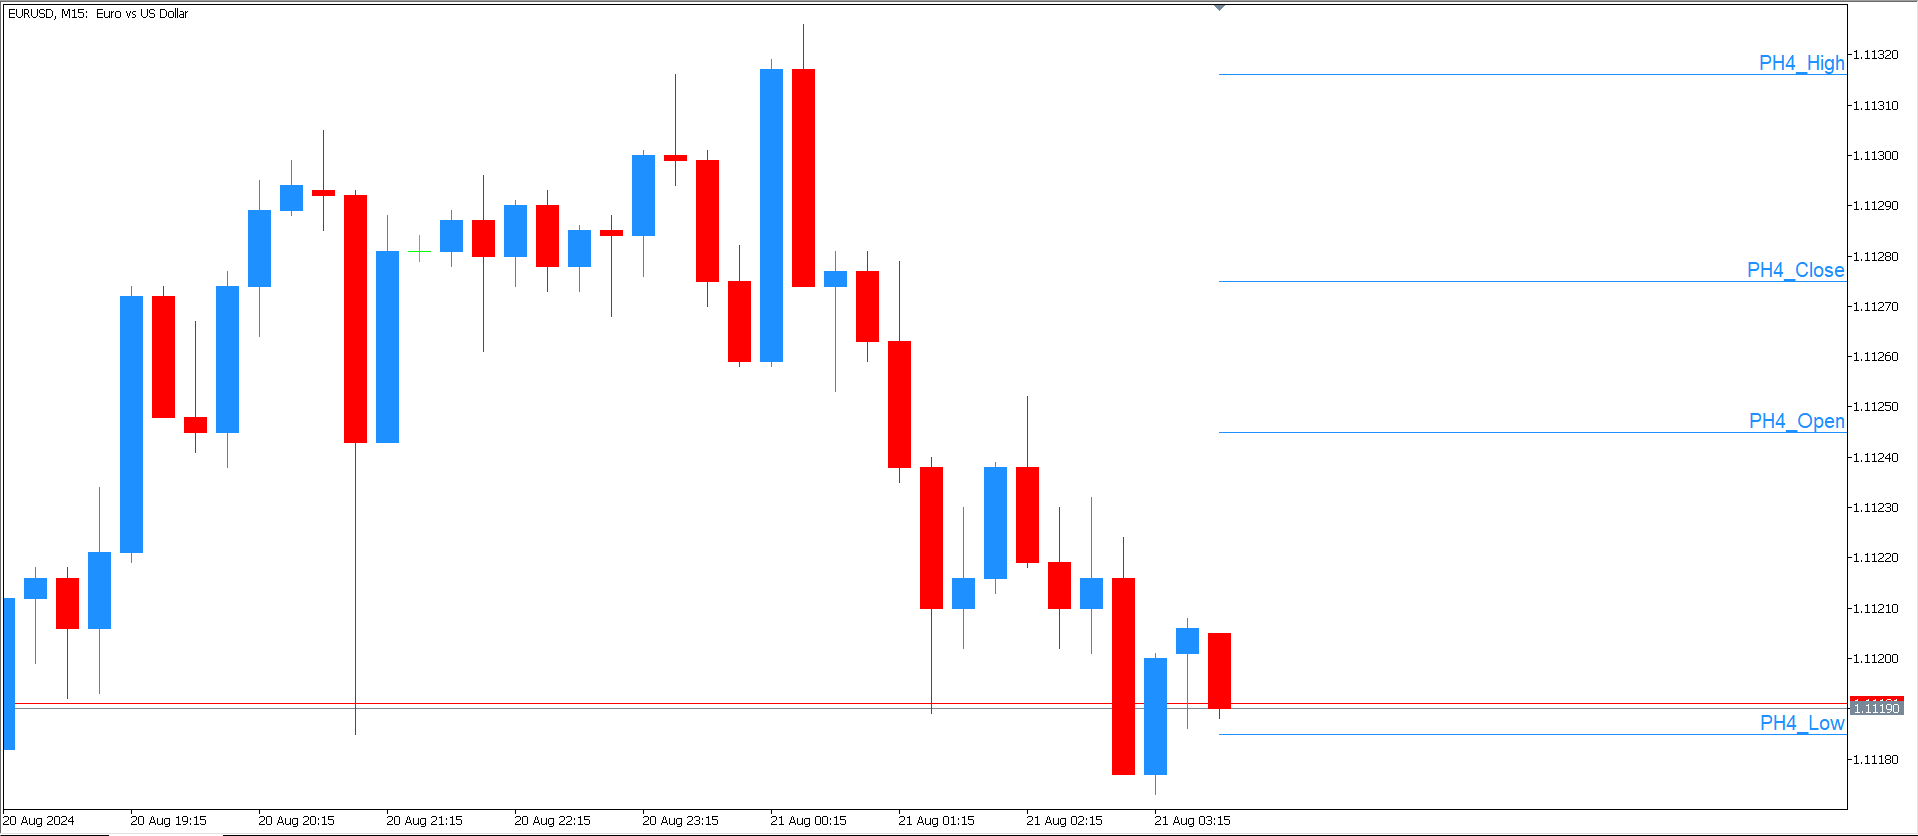
To help the user be comfortable on the chart, each levels can just be displayed in the time frame chosen and the time frames lower than the chosen timeframe,
Wa Previous Candle Levels MT5 will not display the level in the time frame higher than the chosen timeframe.
For example: I decided to display the Previous (Weekly) W1 Candle OHLC levels on the chart, those levels wil be displayed from the timeframe M1 to the timeframe W1, it will not display in the timeframe MN.