HiperCube Renko Candles
- Indicadores
- Adrian Lara Carrasco
- Versión: 1.1
- Actualizado: 21 agosto 2024
Bienvenido a HiperCube Renko Candles
Código del -25% de descuento en Darwinex Zero: DWZ2328770MGM
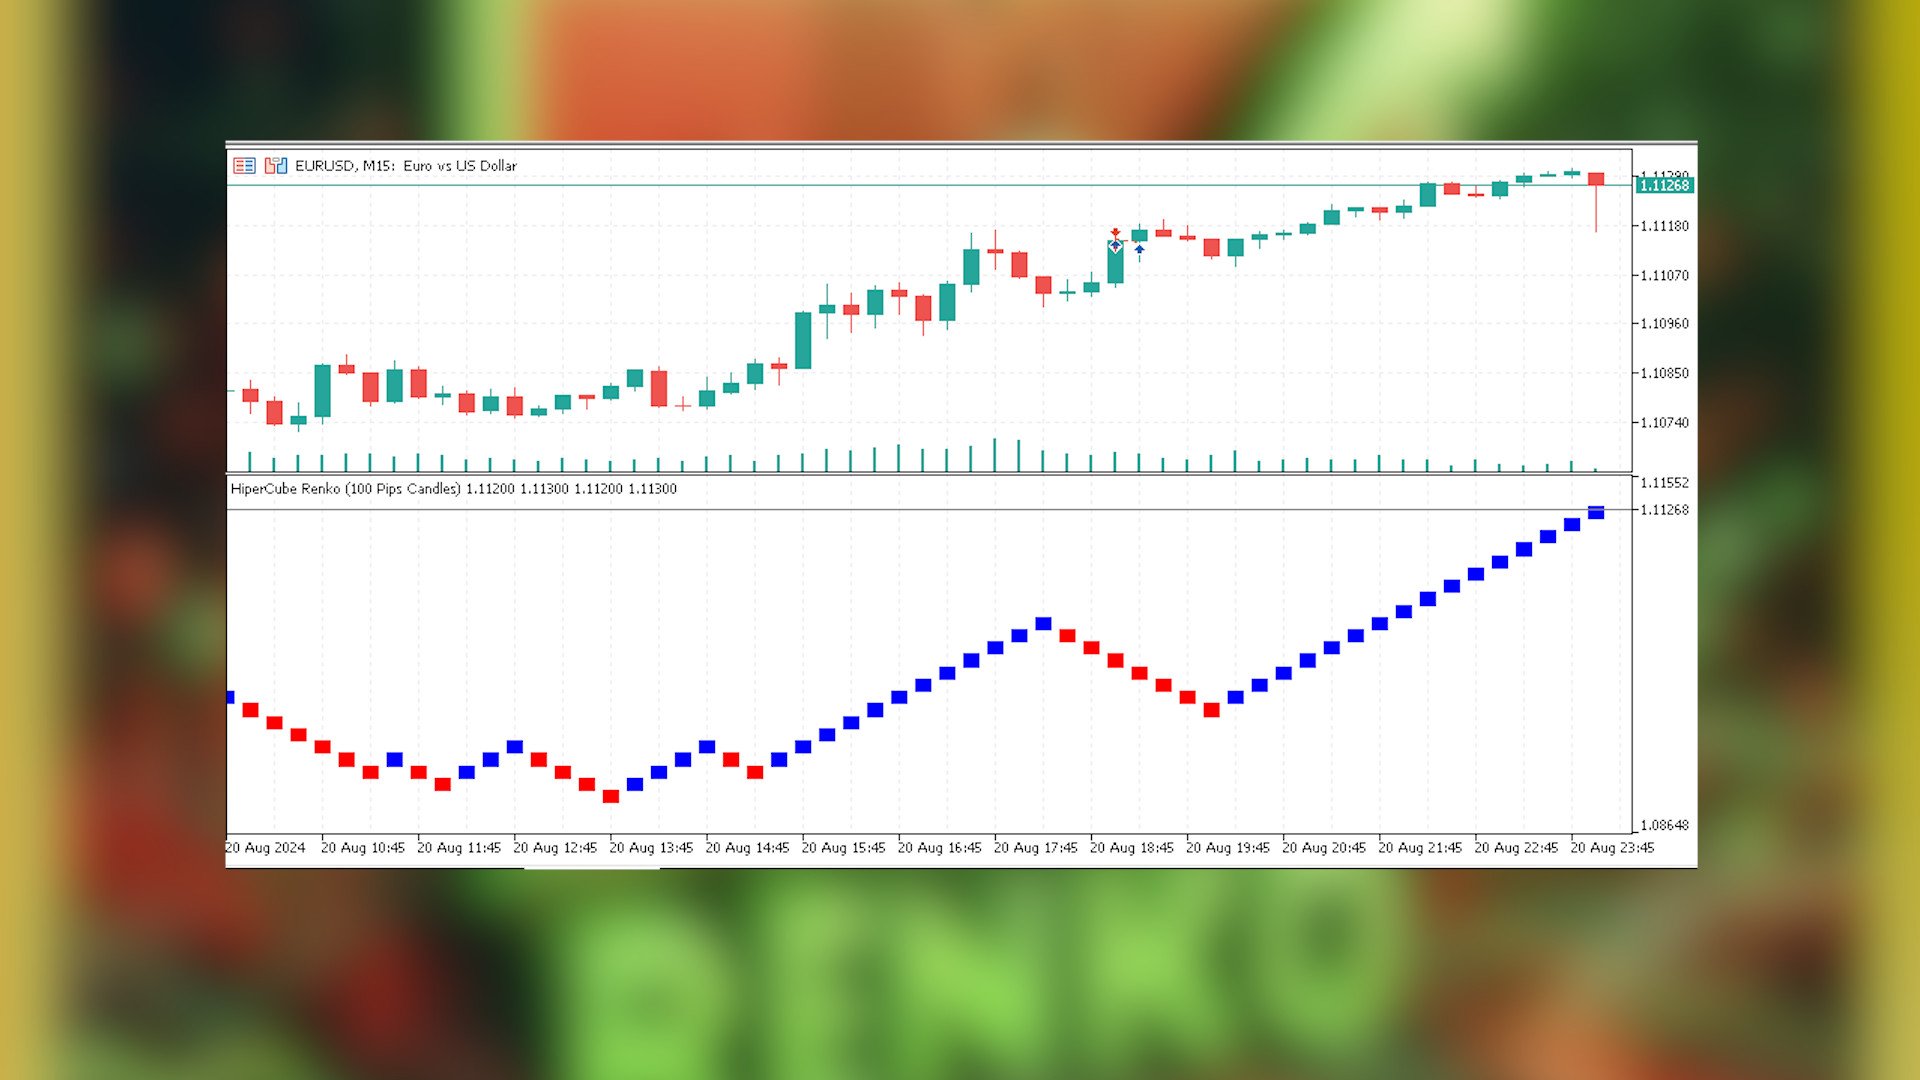
Este indicador le proporciona información real del mercado y lo transforma al estilo de vela Renko.
Definición
Los gráficos Renko son un tipo de gráfico financiero que mide y traza los cambios de precios, utilizando ladrillos (o barras) para representar los movimientos de precios. A diferencia de los gráficos de velas tradicionales, los gráficos Renko no muestran información basada en el tiempo, centrándose únicamente en las fluctuaciones de precios.
Características:
- Indicador en ventanas separadas
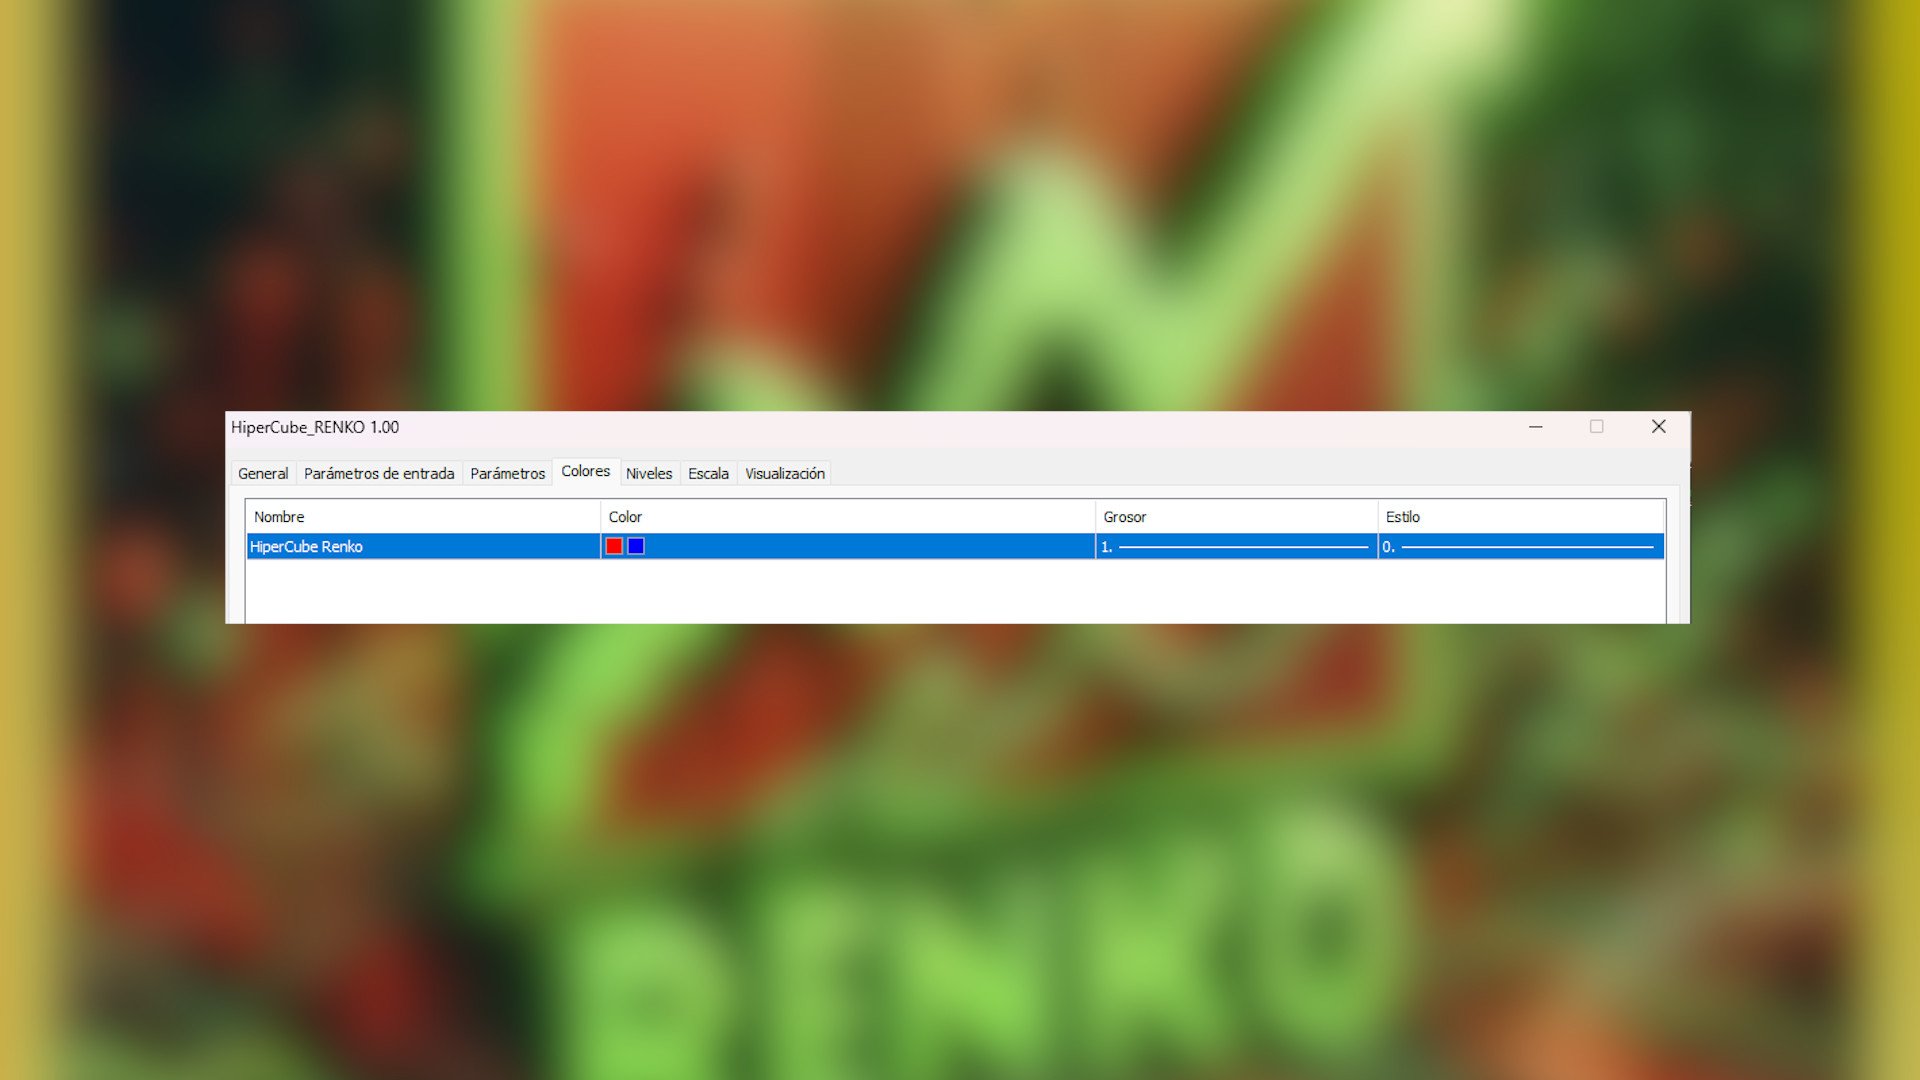
- Personalice los colores de sus velas
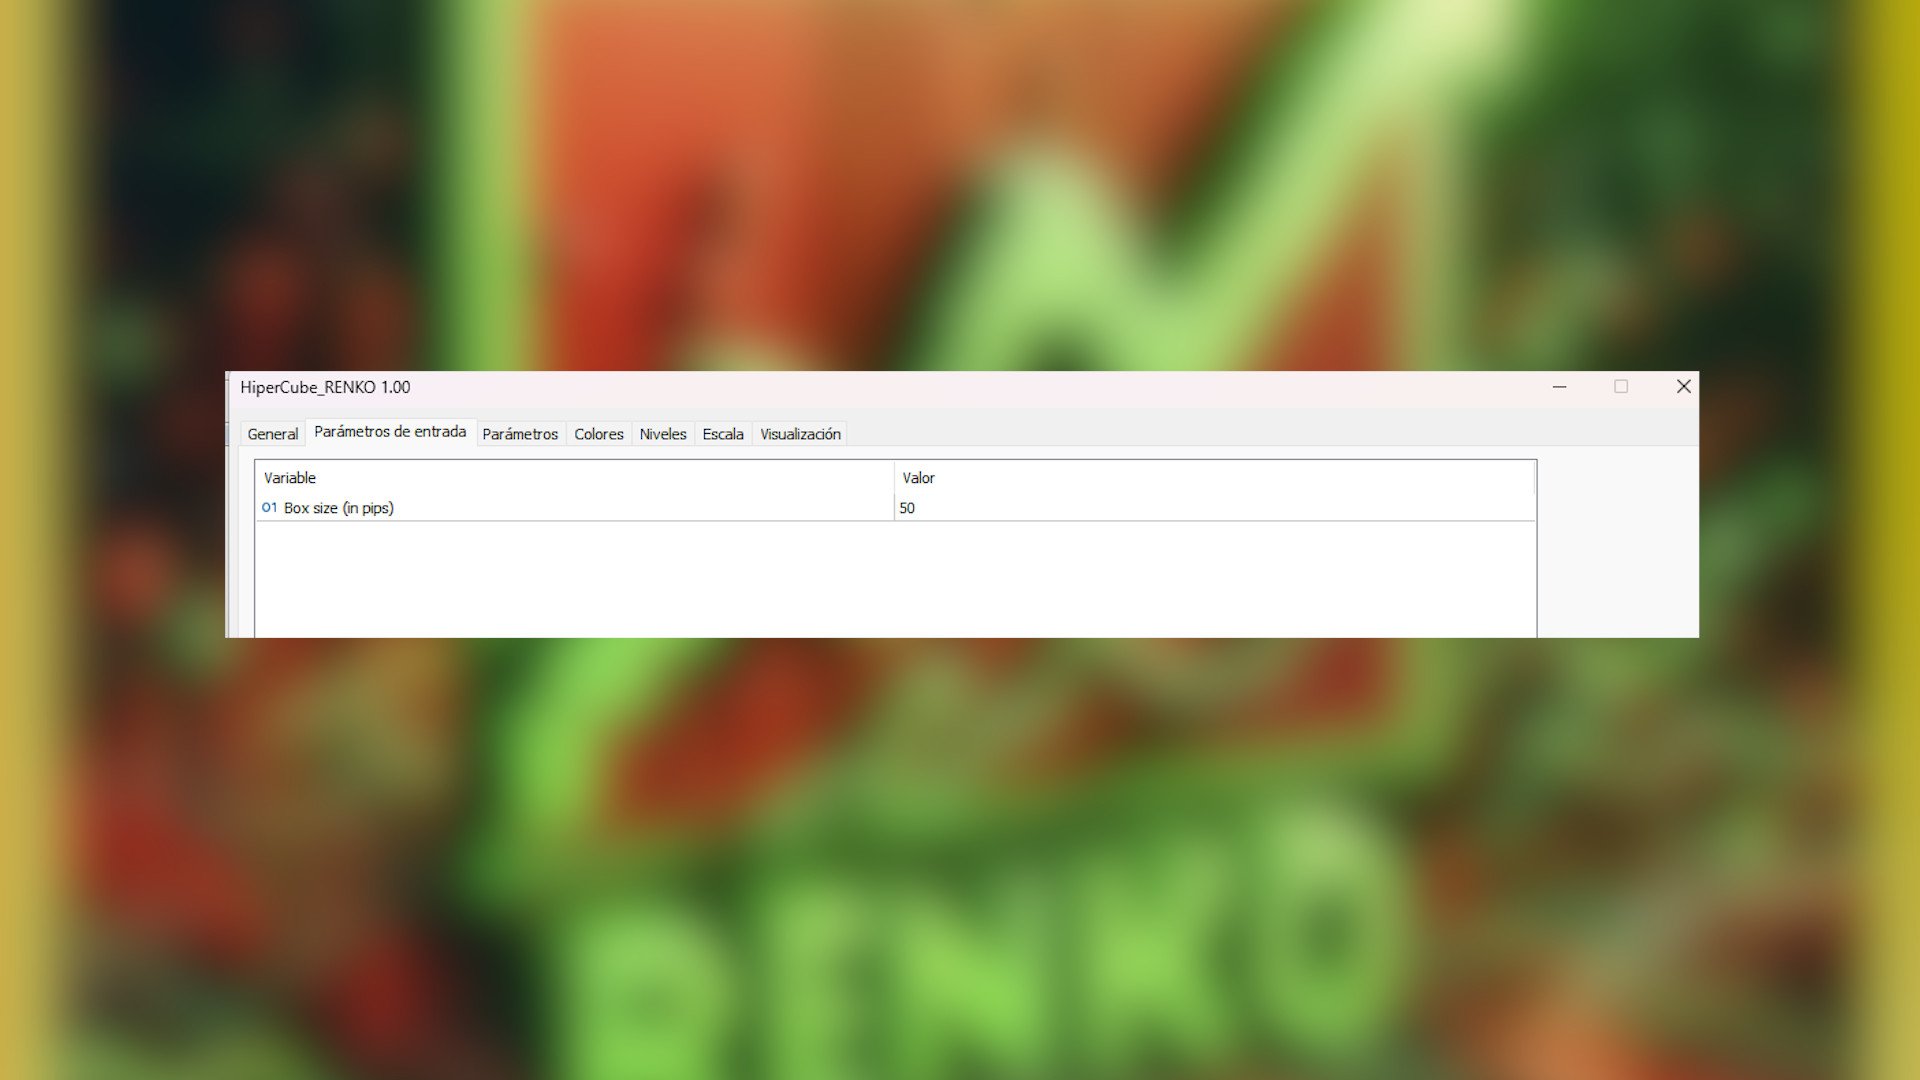
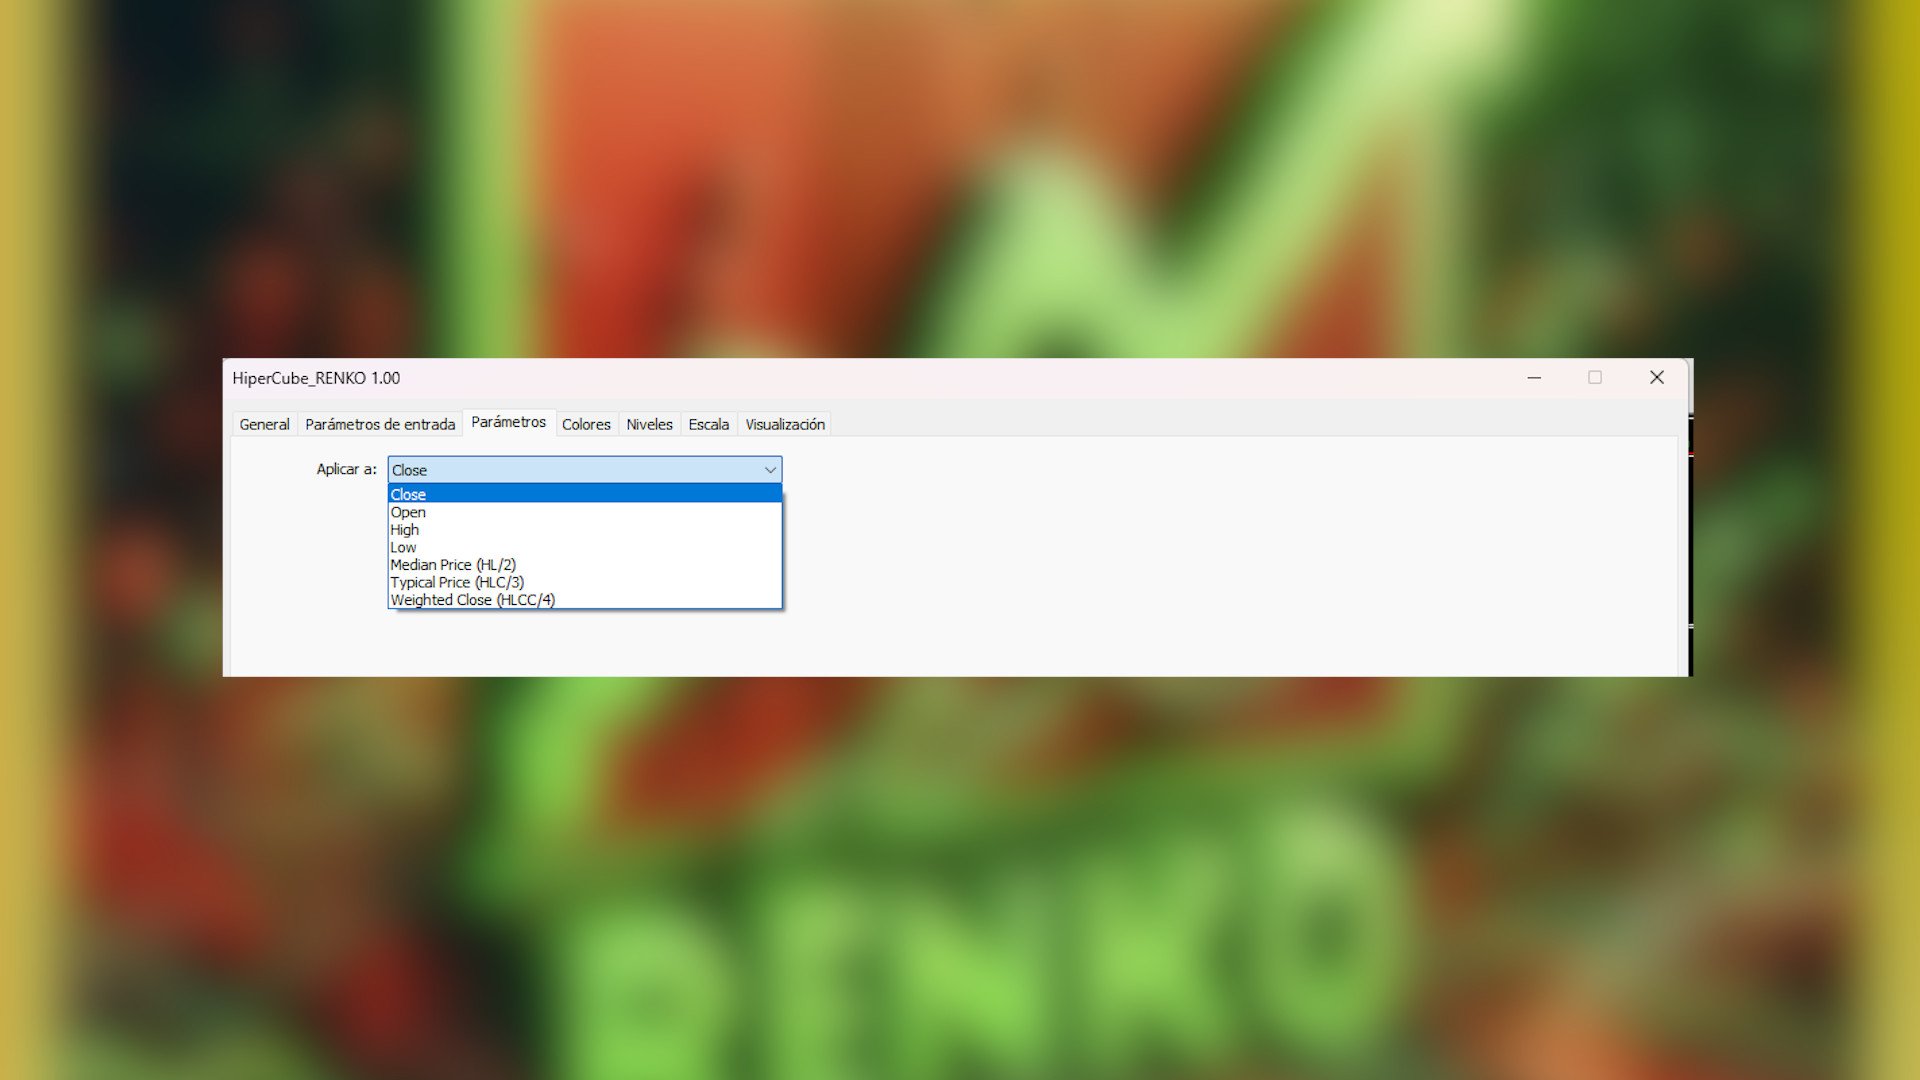
- Tamaño personalizado de velas/ladrillos en pips
- Se utilizó Chatgpt y AI para desarrollarlo.
Ejemplo de estrategia con Renko:
- Identifique la tendencia
- Espere a que se produzca un retroceso y una envolvente con velas Renko
- Coloque su entrada
- SL inferior a la envolvente
- TP en riesgo-recompensa 1:2, 1:3...
Tenga en cuenta que este es un ejemplo y puede ser una estrategia base o nueva, sin embargo, pruébelo antes de usarlo en cuentas reales, esta información es solo para que comprenda cómo usar el indicador de velas Renko de HiperCube