BBTrend
- Indicadores
- Kim Hari
- Versión: 1.0
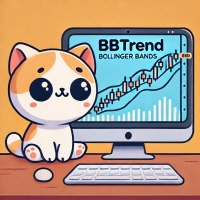
BBTrend is a powerful trend analysis tool designed to provide a clear overview of market volatility and trends at a glance.
This indicator calculates the difference between two Bollinger Bands of different periods,
visually indicating the strength of upward or downward trends to traders.
Clear Trend Visualization: The upward trend is represented in green, and the downward trend in red,
allowing traders to intuitively grasp the direction and strength of the trend.
Standardized Percentage Display: The trend strength is standardized as a percentage,
enabling consistent analysis across various market conditions.
Source - TradingView
