• Información general
  • Comentarios
  • Discusión

Fusionblocks

FusionBlocks: Decode Market Structure

Unlock the full potential of your trading with FusionBlocks, the ultimate MT5 indicator for smart money concepts (SMC) traders. Designed to provide a comprehensive understanding of market structure, FusionBlocks is an indispensable tool for traders looking to enhance their strategy and performance.

Key Features

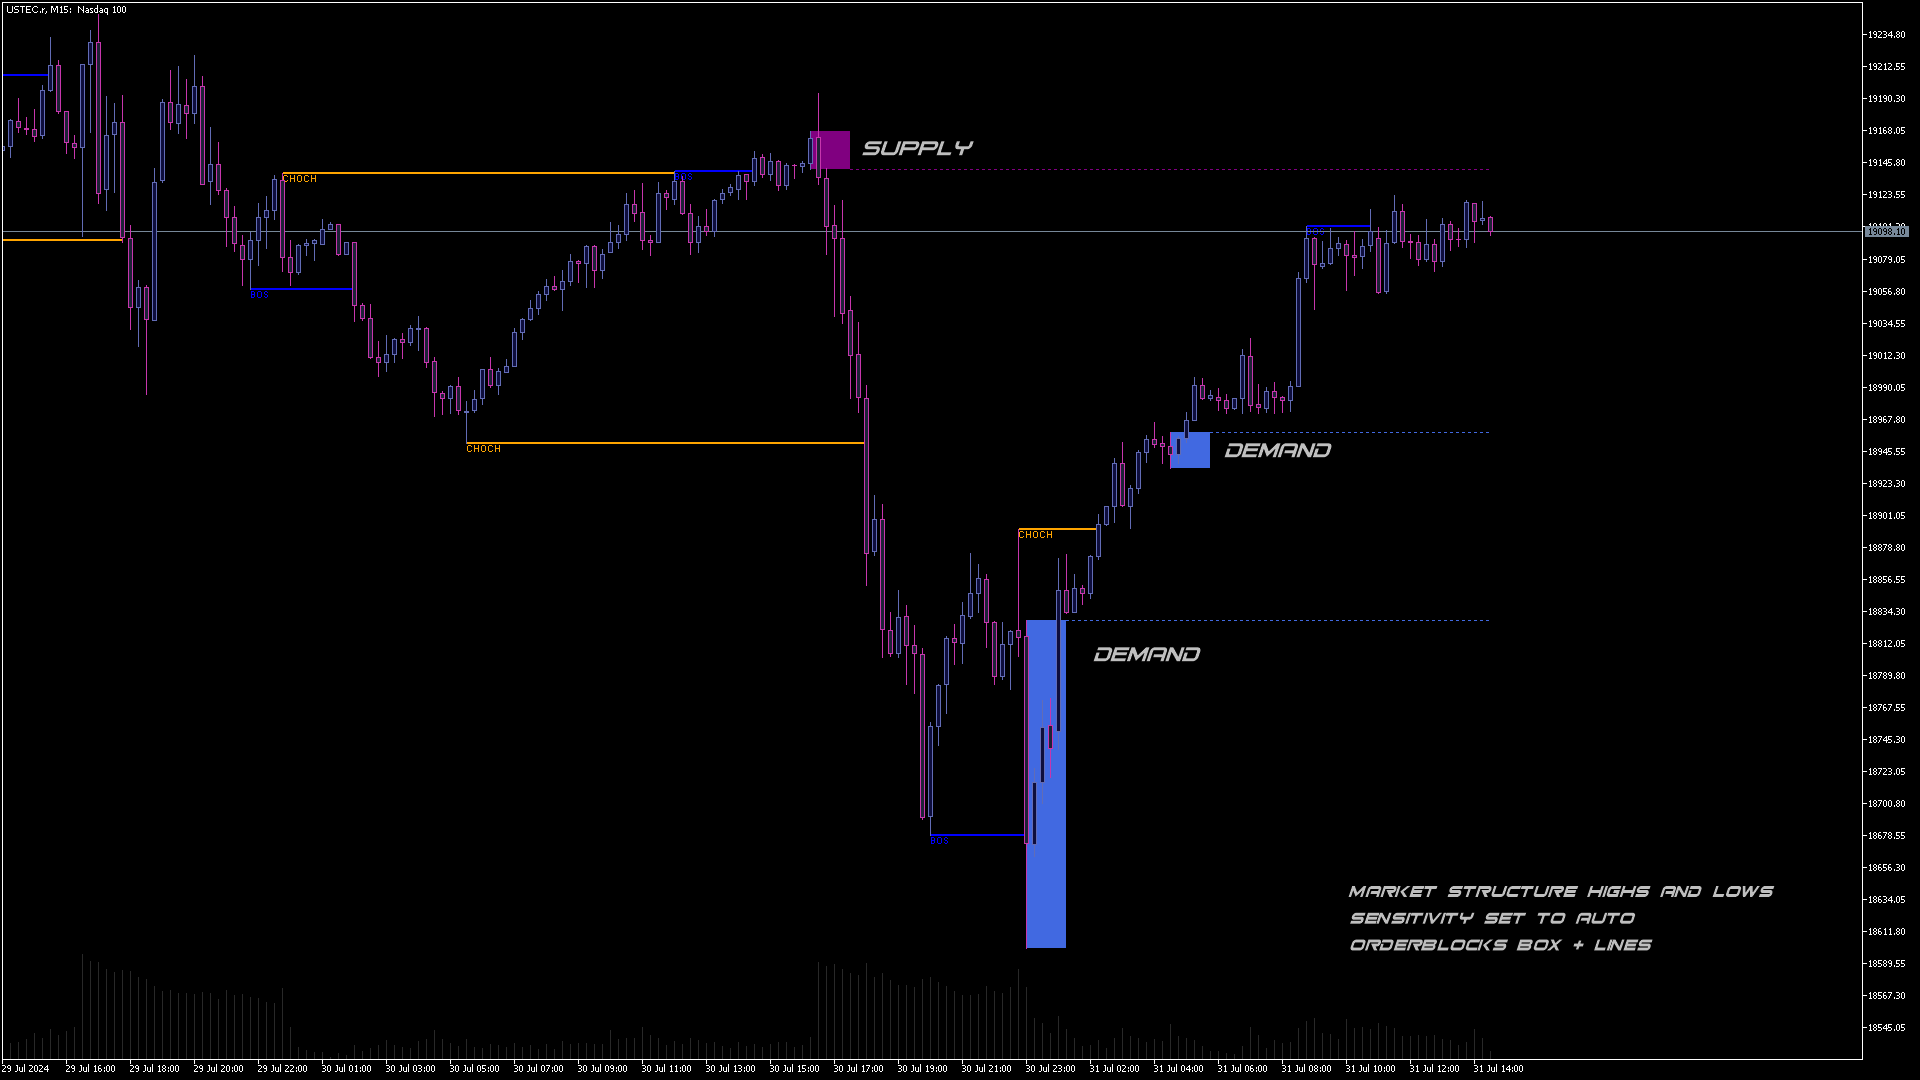
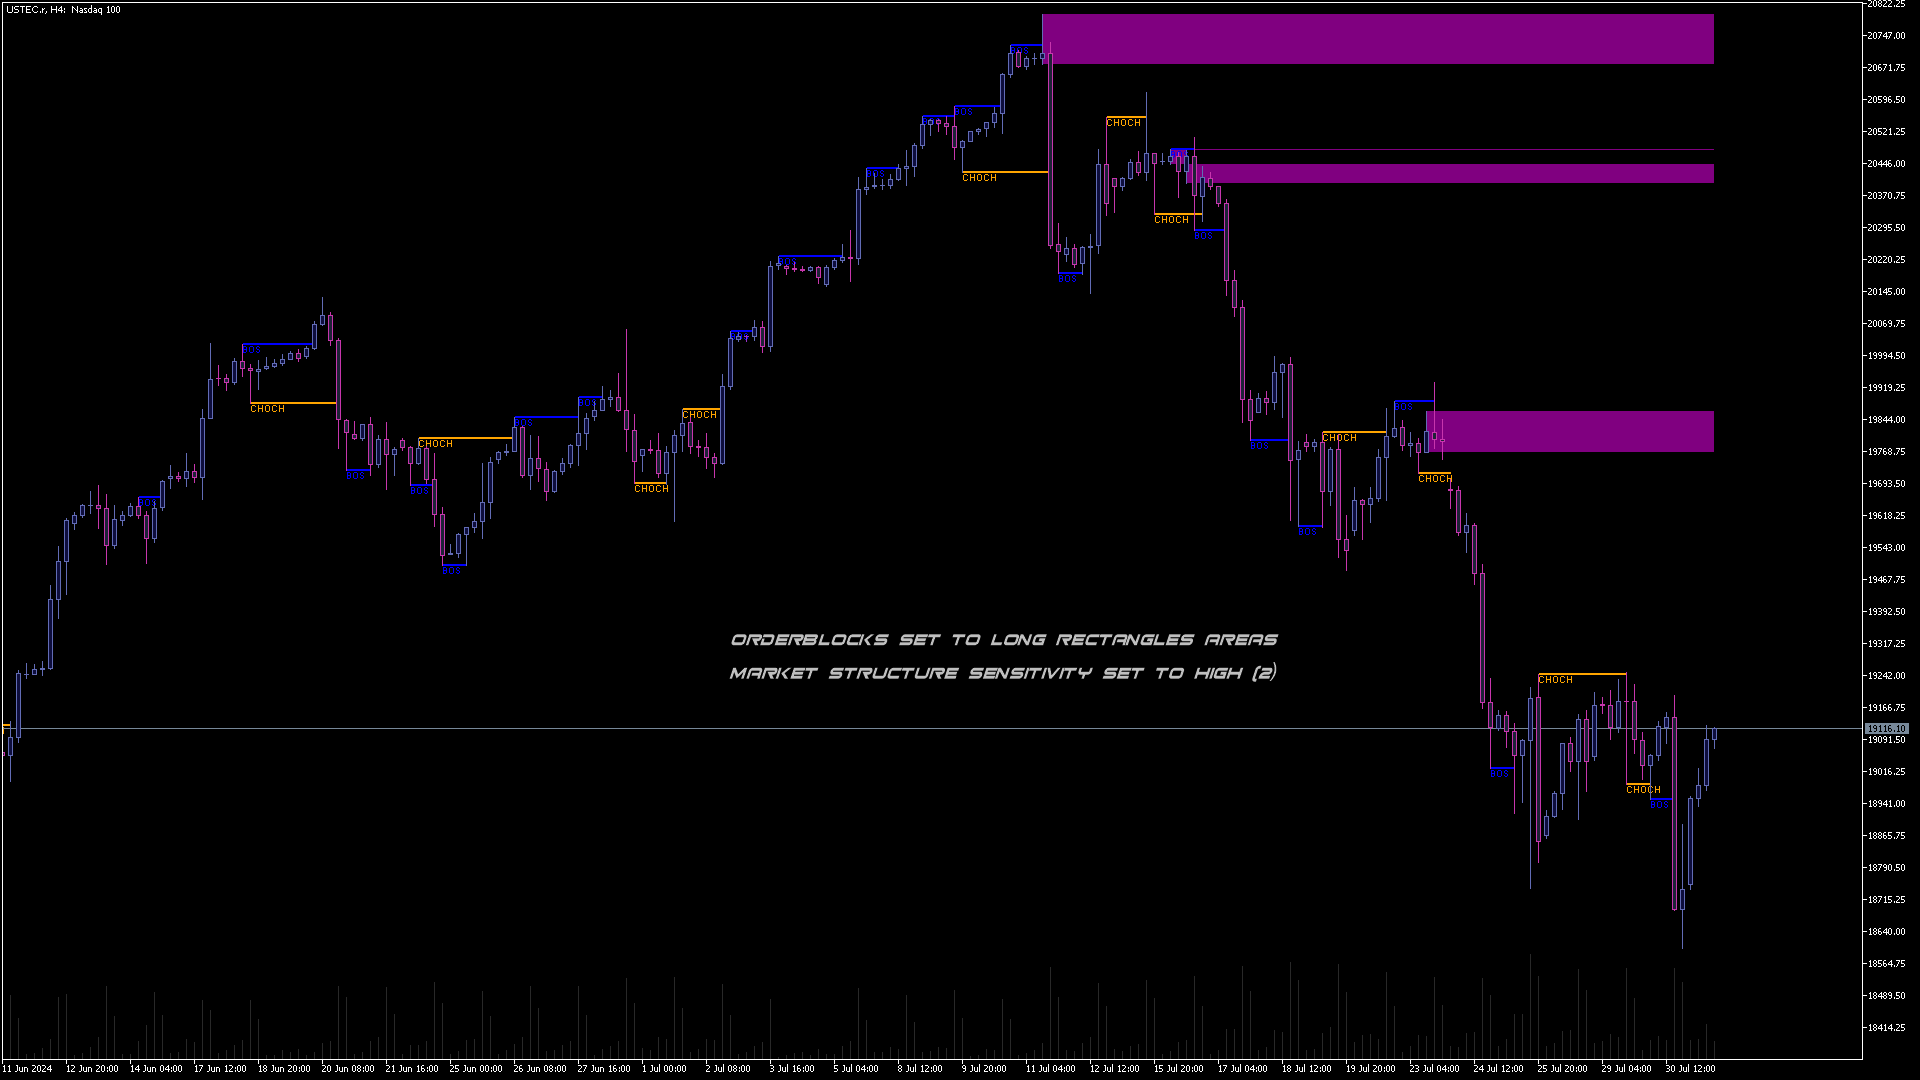
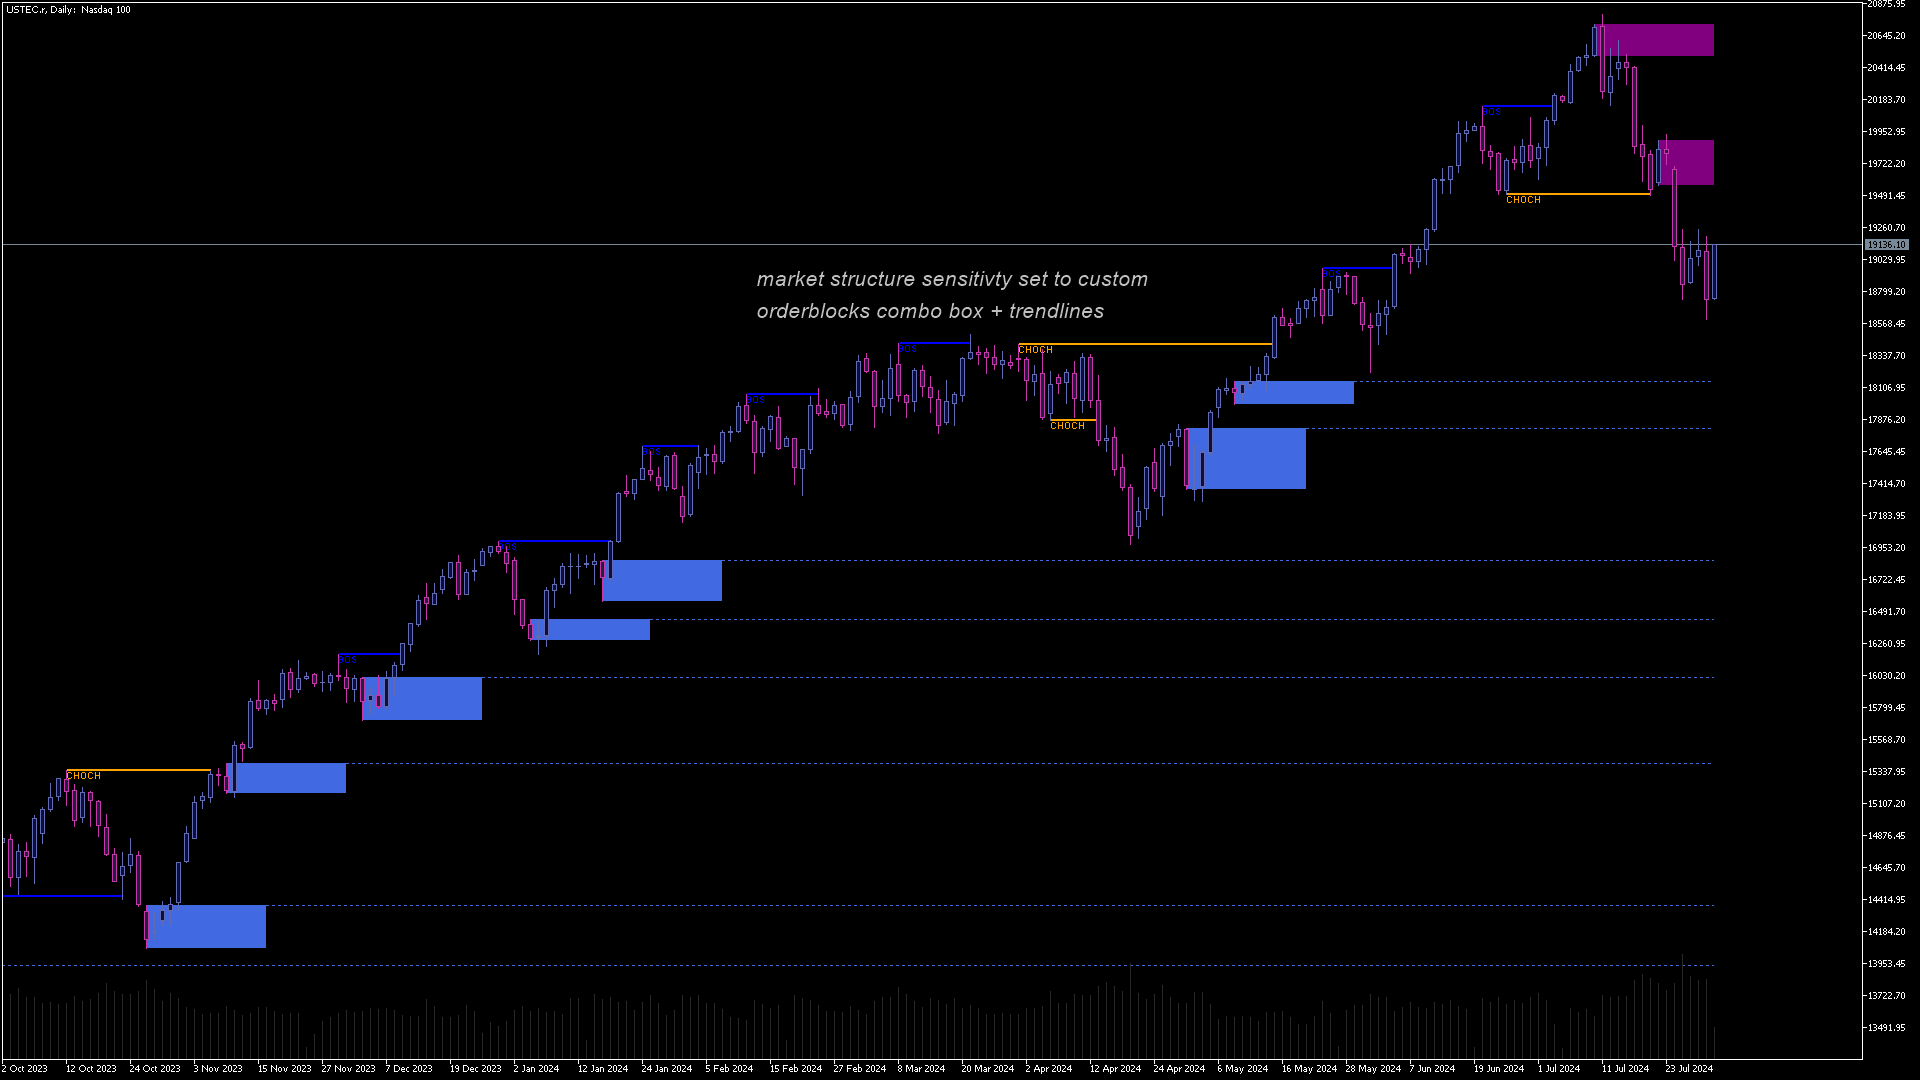
  • Order Block Detection: Automatically identifies and draws order blocks on the chart, helping you pinpoint key areas of interest.
  • Break of Structure (BOS) and Change of Character (CHOCH): Marks these crucial market structure points, allowing you to make informed trading decisions.
  • Customization Options: Tailor the indicator to your preferences with customizable colors and display styles for order blocks—choose between boxes, areas, or a combination of lines and boxes.
  • Fractal Sensitivity: Adjust the sensitivity of highs and lows used for market structure analysis, ensuring the indicator aligns with your trading style.
  • Auto Mode: Seamlessly integrates higher timeframe highs and lows into your current timeframe analysis, providing a clearer picture of the market dynamics.

Why Choose FusionBlocks?

FusionBlocks is more than just an indicator—it's a powerful tool that simplifies complex market data, making it easier for you to set targets and identify potential reversal areas. By decoding market structure, FusionBlocks enables you to trade with confidence and precision.

Experience the difference with FusionBlocks and take your trading to the next level. Decode market structure today and start making more informed trading decisions with ease.

Productos recomendados
The   Smart Divergence Dashboard   is your ultimate tool for identifying high-probability trading opportunities. This cutting-edge indicator is meticulously designed to detect Regular Divergences, offering traders a clear and actionable advantage. MT4 Version -  https://www.mql5.com/en/market/product/120702/ Key Features: Real-time Divergence Detection:   Instantly pinpoints Higher High/Lower Low and Oscillator Higher Low divergences across multiple currency pairs and timeframes using Awesome Os
Owl Smart Levels MT5
Sergey Ermolov
4.07 (28)
Versión MT4  |  FAQ El Indicador Owl Smart Levels es un sistema comercial completo dentro de un indicador que incluye herramientas de análisis de mercado tan populares como los fractales avanzados de Bill Williams , Valable ZigZag que construye la estructura de onda correcta del mercado y los niveles de Fibonacci que marcan los niveles exactos de entrada. en el mercado y lugares para tomar ganancias. Descripción detallada de la estrategia Instrucciones para trabajar con el indicador Asesor de c
The Penta-O is a 6-point retracement harmonacci pattern which usually precedes big market movements. Penta-O patterns can expand and repaint quite a bit. To make things easier this indicator implements a twist: it waits for a donchian breakout in the right direction before signaling the trade. The end result is an otherwise repainting indicator with a very reliable trading signal. The donchian breakout period is entered as an input. [ Installation Guide | Update Guide | Troubleshooting | FAQ | A
Mine Farm is one of the most classic and time-tested scalping strategies based on the breakdown of strong price levels. Mine Farm is the author's modification of the system for determining entry and exit points into the market... Mine Farm - is the combination of great potential with reliability and safety. Why Mine Farm?! - each order has a short dynamic Stop Loss - the advisor does not use any risky methods (averaging, martingale, grid, locking, etc.) - the advisor tries to get
To get access to MT4 version please click here . - This is the exact conversion from TradingView: "Stochastic Momentum Index" By "UCSgears". - This is a popular version of stochastic oscillator on tradingview. - This is a light-load processing and non-repaint indicator. - Buffers are available for the lines on chart. - You can message in private chat for further changes you need. Thanks for downloading
Golden Spikes Detector
Batsirayi L Marango
2.67 (3)
Golden Spikes Detector Este indicador se basa en una estrategia avanzada principalmente para negociar picos en índices de auge y caída. Se implementaron algoritmos complejos para detectar únicamente entradas de alta probabilidad. Alerta sobre posibles entradas de Compra y Venta. Para negociar picos en el corredor Deriv o Binary, solo acepte las alertas Buy Boom y Sell Cash. Se optimizó para cargarse en un período de tiempo de 5 minutos, aunque se realiza un análisis de múltiples períodos de tiem
Noize Absorption Index - is the manual trading system that measures the difference of pressure between bears forces and bulls forces. Green line - is a noize free index that showing curent situation. Zero value of index shows totally choppy/flat market.Values above zero level shows how powerfull bullish wave is and values below zero measures bearish forces.Up arrow appears on bearish market when it's ready to reverse, dn arrow appears on weak bullish market, as a result of reverse expectation.
The indicator detects and displays М. Gartley's Butterfly pattern. The pattern is plotted by the extreme values of the ZigZag indicator (included in the resources, no need to install). After detecting the pattern, the indicator notifies of that by the pop-up window, a mobile notification and an email. The pattern and wave parameters are displayed on the screenshots. The default parameters are used for demonstration purposes only in order to increase the amount of detected patterns. Parameters
¡El nivel Premium es un indicador único con más del 80% de precisión de predicciones correctas! ¡Este indicador ha sido probado por los mejores especialistas en comercio durante más de dos meses! ¡El indicador del autor no lo encontrarás en ningún otro lugar! ¡A partir de las capturas de pantalla, puede ver por sí mismo la precisión de esta herramienta! 1 es ideal para operar con opciones binarias con un tiempo de vencimiento de 1 vela. 2 funciona en todos los pares de divisas, accion
El indicador muestra patrones armónicos en el gráfico   sin repintar   con el mínimo retraso posible. La búsqueda de la parte superior de los indicadores se basa en el principio de onda del análisis de precios. La configuración avanzada le permite elegir parámetros para su estilo de negociación. En la apertura de una vela (barra), cuando se forma un nuevo patrón, se fija una flecha de la dirección probable del movimiento del precio, que permanece sin cambios. El indicador reconoce los siguientes
The standard Bollinger Bands indicator has been improved by integrating additional indications from the Standard Deviation indicator (StdDev), which gives an additional filter for confirming trading signals. In addition, the color of the indicator's lines shows the beginning of a trend, its development and exhaustion. This indicator has a signal block that notifies the trader of the beginning of the trend on any time frame to which it is attached. Settings Type of messages - select the type of
El indicador construye cotizaciones actuales, que se pueden comparar con las históricas y, sobre esta base, hacer un pronóstico de movimiento de precios. El indicador tiene un campo de texto para una navegación rápida a la fecha deseada. Opciones: Símbolo - selección del símbolo que mostrará el indicador; SymbolPeriod - selección del período del cual el indicador tomará datos; IndicatorColor - color del indicador; HorisontalShift: cambio de cotizaciones dibujadas por el indicador
FanTracer
Syed Oarasul Islam
This Indicator draws Fibonacci Fan levels in two different ways. You can select whether to draw Fibonacci Fan levels based on your favourite ZigZag settings or you can let the indicator to draw Fan levels based on given number of bars or candles.  You can also set Mobile and Email notification for your favourite Fan  levels individually. With this indicator you will not have to feel lonely as the it can generate Voice alerts, which will keep you focused on your trading and remove boredom.  Prod
LT Rainbow Trend
Thiago Duarte
5 (1)
Do you, like me, like to trade with the trend? Then this indicator will help you! Rainbow Trend is a trend indicator, which uses several Moving Averages on the chart. It measures different trend strenght zones for different periods: very long term, long term, mid term, short term and very short term. Each zone has its color, and it is possible to have sound alert when the prices leaves a zone and enters another. Its configuration is very simple. If you find any bug or have any suggestions, co
SolarTrade Suite Financial Indicator: Jupiter Market Indicator - ¡Su guía confiable en el mundo de los mercados financieros! Este es un indicador de tendencia que utiliza algoritmos especiales innovadores y avanzados para calcular su valor, y también tiene un diseño agradable a la vista. Es muy fácil entender las lecturas de este indicador: color azul - compra, rojo - venta. Vea nuestros otros productos de la serie SolarTrade Suite en la parte inferior de la descripción. ¿Quiere navegar
Now, you have your own AUTO-CLOSE program ! Once your account target or drawdown hits, all open orders will be closed automatically. ========================================== INPUTS: Account target:   Put the exact account target. Once the equity hits it or went above that, all orders closed. Please add buffer to consider slippage. Use fixed value or dynamic value:   Choose whether you will need a fixed value or dynamic value for drawdown.  DYNAMIC SETTINGS: Equity-based or Balance-based drawdo
An indicator of pattern #31 ("Long Island") from Encyclopedia of Chart Patterns by Thomas N. Bulkowski. The second gap is in the opposite direction. Parameters: Alerts - show alert when an arrow appears   Push - send a push notification when an arrow appears (requires configuration in the terminal) GapSize - minimum gap size in points ArrowType - a symbol from 1 to 17 ArrowVShift - vertical shift of arrows in points   ShowLevels - show levels ColUp - color of an upward line ColDn - color of a
KopierMaschine - локальный копировщик сделок между различными счетами MetaTrader 4 и MetaTrader 5 в любом направлении расположенных на одном компьютере с интуитивно понятным интерфейсом. Направления копирования: MT4 --> MT5 MT4 --> MT4 MT5 --> MT5 MT5 --> MT4 для копирования между терминалами MetaTrader 4 и   MetaTrader   5 необходимо приобрести версию продукта   KopierMaschine  для    MetaTrader  4 Особенности Программа работает в двух режимах Master и Slave На один подчиненный счет можно коп
Ante todo, vale la pena enfatizar que esta Herramienta de Trading es un Indicador No Repintado, No Redibujado y No Retrasado, lo que la hace ideal para el trading profesional. Curso en línea, manual del usuario y demostración. El Indicador de Conceptos de Acción del Precio Inteligente es una herramienta muy potente tanto para traders nuevos como experimentados. Combina más de 20 indicadores útiles en uno solo, combinando ideas avanzadas de trading como el Análisis del Trader del Círculo Inte
Binary Options Assistant (BOA) Multi Currency Dashboard for Binary Options (MT5) . You can use any of the BOA Signals Indicators with the dashboard. Just change the BOA Signals Indicator Name in the dashboard settings to the indicator you want to get signals from. For example: CHILL. BLAZE:  BOA_BLAZE_Indicator_v1   Strategy :   BLW Online Trading Binary Options Strategy (3 Moving Average) LAVA:  BOA_LAVA_Indicator_v1   Strategy:   Lady Trader Binary Options Strategy (Bollinger Bands & Stoc
Candle hunter
Ruslan Khasanov
5 (1)
Indicador para análisis gráfico. Marca los principales patrones de velas japonesas en el gráfico. Por el momento, el siguiente conjunto de patrones está disponible para el comerciante:  - Bearish/Bullish Abandoned Baby;  - Bearish Advance Block;  - Bearish Deliberation;  - Bearish/Bullish Belt Hold;  - Bearish/Bullish Engulfing;  - Bearish Shooting Star;  - Bearish Evening Star;  - Bearish Evening Doji Star;  - Bearish/Bullish Doji Star;    - Bearish/Bullish Tri-Star;  - Bearish Hanging Man;  -
Introduction One of the patterns in "RTM" is the "QM" pattern, also known as "Quasimodo". Its name is derived from the appearance of "Hunchback of Notre-Dame" from Victor Hugo's novel. It is a type of "Head and Shoulders" pattern.   Formation Method   Upward Trend In an upward trend, the left shoulder is formed, and the price creates a new peak higher than the left shoulder peak . After a decline, it manages to break the previous low and move upward again. We expect the pric
Short term extremum
Gennadiy Stanilevych
5 (1)
The indicator determines and marks the short-term lows and highs of the market on the chart according to Larry Williams` book "Long-term secrets to short-term trading". "Any time there is a daily low with higher lows on both sides of it, that low will be a short-term low. We know this because a study of market action will show that prices descended in the low day, then failed to make a new low, and thus turned up, marking that ultimate low as a short-term point. A short-term market high is just
Bullet indicator x
Dorah Zandile Mahesu
The bullet indicator gives accurate direction of the market structure, it will indicate to you the exact direction whether it be the market is in a downtrend or if it's in an uptrend it will give you that information which will inturn benefits you by saving you the time it takes to analyse that structure, this indicator works on a timeframes and it's most favourable on higher timeframes. How it works: -The green arrow will be at the support of the structure indicating buys -The red arrow will
LT Exaustion Oscillator
Thiago Duarte
3.33 (3)
As it name implies, this is an exaustion oscillator. However, you may wonder: what differs you from others oscillators like RSI, Stochastic, CCI etc? The difference is that ours is more powerful and accurate ! Your oscillator filters the nois e made by other oscillators, and shows you only the exact moment to enter the trade. Of course, using it alone, like any other indicator, has its risks. Ideally, reconcile it with technical analysis and/or others indicators. If you have any doubt or suggest
Bienvenido al indicador de reconocimiento Ultimate Harmonic Patterns Este indicador detecta el patrón de Gartley, el patrón de murciélago y el patrón de cifrado en función de HH y LL de la estructura de precios y los niveles de Fibonacci, y cuando se alcanzan ciertos niveles de fib, el indicador mostrará el patrón en el gráfico. Este indicador es una combinación de mis otros 3 indicadores que detecta patrones avanzados Características : Algoritmo avanzado para detectar el patrón con alta precisi
Introducing the Power Trade Plus indicator designed by a small group of traders with a few years of experience trading the market profitably.  The Power Trade Plus is derived from the Power Trade indicator,  the indicator strive in powerful sniper entries and take profit levels,  with an algorithm that's can determine the markets volatility and Provides entries based on the current market volatility. This indicator is much more effective in stock ,currencies and indices.
Order Book, known also as Market Book, market depth, Level 2, - is a dynamically updated table with current volumes of orders to buy and to sell specific financial instument at price levels near Bid and Ask. MetaTrader 5 provides the means for receiving market book from your broker, but in real time only, without access to its history. The indicator OrderBook Cumulative Indicator accumulates market book data online and visualizes them on the chart. In addition, the indicator can show the market
Good Time
Sergey Sapozhnikov
Indicator for Highlighting Any Time Periods such as Trade Sessions or Week Days We do we need it? Looking through the operation results of my favorite Expert Advisor in the strategy tester I noticed that most deals it opened during the Asian session were unprofitable. It would be a great idea to see it on a graph, I thought. And that was the time I bumped into the first problem - viewing only the Asian session on a chart. And hiding all the others. It is not a problem to find the work schedule o
PipFinite Strength Meter MT5
Karlo Wilson Vendiola
5 (1)
How To Determine If The Market is Strong Or Weak? Strength Meter uses an Adaptive Algorithm That Detect Price Action Strength In 4 Important Levels! This powerful filter gives you the ability to determine setups with the best probability. Features Universal compatibility to different trading systems Advance analysis categorized in 4 levels Level 1 (Weak) - Indicates us to WAIT. This will help avoid false moves Weak Bullish - Early signs bullish pressure Weak Bearish - Early signs bearish pre
Los compradores de este producto también adquieren
TPSpro RFI Levels MT5
Roman Podpora
4.67 (9)
反转第一脉冲水平 (RFI)     指示     俄羅斯     -        ESP   Recomendamos utilizar con   el indicador -   TPSpro 趋势专业版 -   MT5版本 Un elemento clave importante en el comercio son las zonas o niveles a partir de los cuales se toman decisiones para comprar o vender un instrumento comercial. A pesar de los intentos de los grandes actores de ocultar su presencia en el mercado, inevitablemente dejan rastros. Nuestra tarea era aprender a encontrar estos rastros e interpretarlos correctamente. Funciones principales:
TPSproTREND PrO MT5
Roman Podpora
4.89 (9)
TPSpro TREND PRO  - is a trend indicator that automatically analyzes the market and provides information about the trend and each of its changes, as well as giving signals for entering trades without redrawing! The indicator uses each candle, analyzing them separately. referring to different impulses - up or down impulse. Exact entry points into transactions for currencies, crypto, metals, stocks, indices!  Version MT4               DETAILED DESCRIPTION               R ecommended to use with an
Atomic Analyst MT5
Issam Kassas
4.56 (18)
En primer lugar, vale la pena enfatizar que este Indicador de Trading no repinta, no redibuja y no se retrasa, lo que lo hace ideal tanto para el trading manual como para el automatizado. Manual del usuario: configuraciones, entradas y estrategia. El Analista Atómico es un Indicador de Acción del Precio PA que utiliza la fuerza y el impulso del precio para encontrar una mejor ventaja en el mercado. Equipado con filtros avanzados que ayudan a eliminar ruidos y señales falsas, y aumentan el poten
Primero que todo, vale la pena enfatizar que este Sistema de Trading es un Indicador No Repintado, No Redibujado y No Retrasado, lo que lo hace ideal tanto para el trading manual como para el automatizado. Curso en línea, manual y descarga de ajustes preestablecidos. El "Sistema de Trading Inteligente MT5" es una solución completa de trading diseñada para traders nuevos y experimentados. Combina más de 10 indicadores premium y presenta más de 7 estrategias de trading robustas, lo que lo convie
Quantum Trend Sniper
Bogdan Ion Puscasu
4.79 (48)
Introduciendo       Indicador Quantum Trend Sniper   , el innovador indicador MQL5 que está transformando la forma en que identificas y negocias los cambios de tendencia. Desarrollado por un equipo de comerciantes experimentados con experiencia comercial de más de 13 años,       Indicador de francotirador de tendencia cuántica       está diseñado para impulsar su viaje comercial a nuevas alturas con su forma innovadora de identificar cambios de tendencia con una precisión extremadamente alta.
Este es un genial indicador para MT5 que ofrece señales precisas para entrar en una transacción sin redibujar. Se puede aplicar a cualquier activo financiero: fórex, criptomonedas, metales, acciones, índices. Nos dará valoraciones bastante precisas y nos dirá cuándo es mejor abrir y cerra una transacción. Eche un vistazo  al vídeo  (6:22), ¡contiene un ejemplo de procesamiento de una sola señal que ha amortizado el indicador! La mayoría de los tráders mejoran sus resultados comerciales durante l
FX Power MT5 NG
Daniel Stein
5 (5)
Obtenga su actualización diaria del mercado con detalles y capturas de pantalla a través de nuestro Morning Briefing aquí en mql5 y en Telegram ! FX Power MT5 NG es la nueva generación de nuestro popular medidor de fuerza de divisas, FX Power. ¿Y qué ofrece este medidor de fuerza de nueva generación? Todo lo que le encantaba del FX Power original PLUS Análisis de fuerza de ORO/XAU Resultados de cálculo aún más precisos Períodos de análisis configurables individualmente Límite de cálculo persona
Advanced Supply Demand MT5
Bernhard Schweigert
4.5 (14)
¡Actualmente con 33% de descuento! ¡La mejor solución para cualquier tráder principiante o experto! Este indicador es una herramienta comercial única, de alta calidad y asequible, porque incorpora una serie de características patentadas y una nueva fórmula. Con esta actualización, podrá mostrar zonas de doble marco temporal. No solo podrá mostrar un marco temporal más alto, sino también mostrar ambos, el marco temporal del gráfico MÁS el marco temporal más alto: MOSTRANDO ZONAS ANIDADAS. A todos
Was: $249  Now: $99   Market Profile defines a number of day types that can help the trader to determine market behaviour. A key feature is the Value Area, representing the range of price action where 70% of trading took place. Understanding the Value Area can give traders valuable insight into market direction and establish the higher odds trade. It is an excellent addition to any system you may be using. Inspired by Jim Dalton’s book “Mind Over Markets”, this indicator is designed to suit the
MetaForecast M5
Vahidreza Heidar Gholami
5 (2)
MetaForecast predice y visualiza el futuro de cualquier mercado basándose en las armonías de los datos de precios. Aunque el mercado no siempre es predecible, si existe un patrón en el precio, MetaForecast puede predecir el futuro con la mayor precisión posible. En comparación con otros productos similares, MetaForecast puede generar resultados más precisos al analizar las tendencias del mercado. Parámetros de entrada Past size (Tamaño del pasado) Especifica el número de barras que MetaForecas
Difícil de encontrar y escasa en frecuencia, las divergencias son uno de los escenarios comerciales más confiables. Este indicador busca y escanea las divergencias regulares y ocultas automáticamente usando su oscilador favorito. [ Guía de instalación | Guía de actualización | Solución de problemas | FAQ | Todos los productos ] Fácil de comerciar Encuentra divergencias regulares y ocultas Admite muchos osciladores bien conocidos Implementa señales comerciales basadas en rupturas Muestra n
FX Volume MT5
Daniel Stein
4.93 (14)
Obtenga su actualización diaria del mercado con detalles y capturas de pantalla a través de nuestro Morning Briefing aquí en mql5 y en Telegram ! FX Volume es el PRIMER y ÚNICO indicador de volumen que proporciona una visión REAL del sentimiento del mercado desde el punto de vista de un bróker. Proporciona una visión impresionante de cómo los participantes institucionales del mercado, como los brokers, están posicionados en el mercado Forex, mucho más rápido que los informes COT. Ver esta info
How to use Pair Trading Station Pair Trading Station is recommended for H1 time frame and you can use it for any currency pairs. To generate buy and sell signal, follow few steps below to apply Pair Trading Station to your MetaTrader terminal. When you load Pair Trading Station on your chart, Pair Trading station will assess available historical data in your MetaTrader platforms for each currency pair. On your chart, the amount of historical data available will be displayed for each currency pai
Trend Hunter MT5
Andrey Tatarinov
5 (1)
Trend Hunter es un indicador de tendencias para trabajar en los mercados Forex, criptomonedas y CFD. Una característica especial del indicador es que sigue con confianza la tendencia, sin cambiar la señal cuando el precio perfora ligeramente la línea de tendencia. El indicador no se vuelve a dibujar; aparece una señal para ingresar al mercado después del cierre de la barra. Al avanzar a lo largo de una tendencia, el indicador muestra puntos de entrada adicionales en la dirección de la tendenc
Este tablero muestra los últimos   patrones armónicos   disponibles para los símbolos seleccionados, por lo que ahorrará tiempo y será más eficiente /   versión MT4 . Indicador gratuito:   Basic Harmonic Pattern Columnas del indicador Symbol:   aparecerán los símbolos seleccionados Trend :   alcista o bajista Pattern :   tipo de patrón (gartley, mariposa, murciélago, cangrejo, tiburón, cifrado o ABCD) Entry :   precio de entrada SL:   precio de stop loss TP1:   1er precio de toma de benefici
PZ Day Trading MT5
PZ TRADING SLU
2.83 (6)
Este indicador detecta reversiones de precios en forma de zig-zag, utilizando solo análisis de acción de precios y un canal donchian. Ha sido diseñado específicamente para el comercio a corto plazo, sin repintar ni pintar en absoluto. Es una herramienta fantástica para comerciantes astutos con el objetivo de aumentar el tiempo de sus operaciones. [ Guía de instalación | Guía de actualización | Solución de problemas | FAQ | Todos los productos ] Increíblemente fácil de comerciar Proporciona
Gold TMAF MTF - es el mejor indicador técnico bursátil. El algoritmo del indicador analiza el movimiento del precio de un activo y refleja la volatilidad y las posibles zonas de entrada. Las mejores señales del indicador: - Para VENTA = límite superior rojo de TMA2 por encima del límite superior rojo de TMA1 + indicador fractal rojo por encima + flecha amarilla de señal SR en la misma dirección. - Para COMPRA = límite inferior azul de TMA2 por debajo del límite inferior azul de TMA1 + i
Ahora $ 147 (aumentando a $ 499 después de algunas actualizaciones) - Cuentas ilimitadas (PC o Mac) Manual de usuario de RelicusRoad + Videos de capacitación + Acceso al grupo privado de Discord + Estado VIP UNA NUEVA MANERA DE VER EL MERCADO RelicusRoad es el indicador comercial más poderoso del mundo para divisas, futuros, criptomonedas, acciones e índices, y brinda a los comerciantes toda la información y las herramientas que necesitan para mantenerse rentables. Brindamos análisis téc
Gold ATR MTF: este es un excelente indicador técnico de acciones. El algoritmo del indicador ATR (Average True Range) analiza el movimiento del precio del activo y refleja la volatilidad dibujando los niveles correspondientes en porcentajes específicos (%) del precio de apertura del período de tiempo especificado (D1). Los indicadores (rojo y/o azul D1 H4) de la dirección del movimiento del precio del símbolo y las señales de flecha son ayudas adicionales y esenciales para una negociación y/o e
Golden Spikes Premium
Kwaku Bondzie Ghartey
Golden Spikes Detector Acknowledgement and Dedications:  The name of this indicator was Inspired by an Original; Mr Grant Koopman; a Knowledgeable and experienced Synthetics trader. I dedicate this indicator to Mr Grant.  Overview: The Golden Spikes Premium is a groundbreaking trading indicator meticulously crafted for the Boom and Crash indices on the Deriv market. Tailored to meet the needs of discerning traders, this powerful tool operates exclusively on the one-minute timeframe, providin
Este panel descubre y muestra las zonas de   Oferta   y   Demanda   en el gráfico, tanto en modo scalping como a largo plazo, dependiendo de su estrategia de trading para los símbolos seleccionados. Además, el modo de escáner del tablero le ayuda a comprobar todos los símbolos deseados de un vistazo y no perder ninguna posición adecuada /   Versión MT4 Indicador gratuito:   Basic Supply Demand Características Le permite ver las oportunidades de negociación en   múltiples pares de divisa
Gold Venamax MT5
Sergei Linskii
3.5 (2)
Gold Venamax : este es el mejor indicador técnico de acciones. El algoritmo del indicador analiza el movimiento del precio de un activo y refleja la volatilidad y las posibles zonas de entrada. Características del indicador: Este es un súper indicador con Magia y dos bloques de flechas de tendencia para un comercio cómodo y rentable. El botón rojo para cambiar de bloque se muestra en el gráfico. La magia se establece en la configuración del indicador, por lo que puede instalar el indicador
ADR Scalping Indicator MT5
Robert Mathias Bernt Larsson
5 (2)
Este es fácilmente el indicador más pasado por alto que le brinda más información sobre la acción del precio. Es el único indicador que uso yo mismo. Este indicador le brinda información sobre cuánto se moverá el precio hoy y en qué dirección es más probable. ADR significa rango diario promedio. Si opera o especula intradía, debe conocer el rango de cuánto se moverá el precio. Digamos que el precio se ha movido la mitad de lo normal para el día, y está en la parte inferior de la acción de
XQ Indicator MetaTrader 5
Marzena Maria Szmit
5 (1)
Step into the realm of Forex trading with confidence and precision using XQ, a cutting-edge Forex indicator designed to elevate your trading game to unprecedented heights. Whether you're a seasoned trader or just stepping into the world of currency exchange, XQ Forex Indicator empowers you with the insights and signals needed to make informed trading decisions. The signal conditions are a combination of three indicators, and XQ Forex Indicator only display  medium and long-term trends . The ind
¿Cansado de trazar líneas de soporte y resistencia? La resistencia de soporte es un indicador de marco de tiempo múltiple que detecta y traza automáticamente los soportes y las líneas de resistencia en el gráfico con un giro muy interesante: a medida que los niveles de precios se prueban con el tiempo y aumenta su importancia, las líneas se vuelven más gruesas y oscuras. [ Guía de instalación | Guía de actualización | Solución de problemas | FAQ | Todos los productos ] Mejora tu análisis técnic
Matrix Arrow Indicator MT5
Juvenille Emperor Limited
5 (12)
Matrix Arrow Indicator MT5   es una tendencia única 10 en 1 que sigue un indicador   100% sin repintado   de marcos temporales múltiples que se puede usar en todos los símbolos/instrumentos:   divisas ,   materias primas ,   criptomonedas ,   índices ,   acciones .  Matrix Arrow Indicator MT5  determinará la tendencia actual en sus primeras etapas, recopilando información y datos de hasta 10 indicadores estándar, que son: Índice de movimiento direccional promedio (ADX) Índice de canales de prod
Blahtech Supply Demand MT5
Blahtech Limited
4.54 (13)
Was: $299  Now: $99   Supply Demand uses previous price action to identify potential imbalances between buyers and sellers. The key is to identify the better odds zones, not just the untouched ones. Blahtech Supply Demand indicator delivers functionality previously unavailable on any trading platform. This 4-in-1 indicator not only highlights the higher probability zones using a multi-criteria strength engine, but also combines it with multi-timeframe trend analysis, previously confirmed swings
TrendMaestro5
Stefano Frisetti
note: this indicator is for METATRADER4, if you want the version for METATRADER5 this is the link:  https://www.mql5.com/it/market/product/108106 TRENDMAESTRO ver 2.4 TRENDMAESTRO recognizes a new TREND in the bud, he never makes mistakes. The certainty of identifying a new TREND is priceless. DESCRIPTION TRENDMAESTRO identifies a new TREND in the bud, this indicator examines the volatility, volumes and momentum to identify the moment in which there is an explosion of one or more of these data a
Gartley Hunter Multi
Siarhei Vashchylka
5 (8)
Gartley Hunter Multi - An indicator for searching for harmonic patterns simultaneously on dozens of trading instruments and on all possible timeframes. Manual (Be sure to read before purchasing) | Version for MT4 Advantages 1. Patterns: Gartley, Butterfly, Shark, Crab. Bat, Alternate Bat, Deep Crab, Cypher 2. Simultaneous search for patterns on dozens of trading instruments and on all possible timeframes 3. Search for patterns of all possible sizes. From the smallest to the largest 4. A
KT Momentum Arrows MT5
KEENBASE SOFTWARE SOLUTIONS
5 (2)
KT Momentum Arrows Indicator is based on a momentary breakout which is calculated using the bands deviation and emerging volatility in a certain direction. A buy signal is generated when the price closes above the upper band and a sell signal is generated when the price closes below the lower band. A magnitude coefficient is used as the input which affects the band deviation and volatility at the same time. The coefficient value should be carefully selected and analyzed based on the instrument a
Otros productos de este autor
Dynamic Range and Target Indicator: Your Reliable Trading Partner Introducing an innovative indicator that revolutionizes how you analyze markets and make trading decisions. Whether you're a beginner seeking clear guidance or an experienced trader looking to enhance your strategy, this tool is designed to meet your needs.   Key Features: 1. Dynamic Range Determination: The indicator continuously analyzes the market, identifying the most recent significant price ranges. 2. Clear Suppor
As traders, we know that identifying price contractions and consolidations is crucial for profitable trading. Fortunately, we have a powerful tool at our disposal. The indicator to trade price consolidation is designed to identify price contraction and alerts us on formation. It does this by analyzing historical price data and identifying price action patterns. The algorithm then uses this information to mark the zone , potential targets and liquidity lines, giving us valuable insights into mark
PA Analyzer
Darko Licardo
5 (2)
With PA analyzer you will see a different perspective of price action , once you have unlocked the full potential of it, this tool will be essential  part of your trading system. PA Analyzer enables market price analysis and automatically marks support and resistance in all time frames. This indicator makes it easy to see whether the price is in range or trend, and generates dynamic profit take targets for the current time frame and the next higher time frame. This allows you to find target co
TrendXplorer indicator is designed to provide valuable insights into market trends, helping you navigate the dynamic world of trading with confidence. Key Features: Accurate Trend Analysis: TrendXplorer utilizes a special algorithm to analyze trends combined with price action. This enables easier trend detection and is less prone to change during price manipulation. Built-in Risk Calculator: Take control of your risk management with TrendXplorer's built-in risk calculator. This feature assesses
Filtro:
No hay comentarios
Respuesta al comentario