Trendlines with breaks
- Indicadores
- Muhammad Hassaan
- Versión: 3.0
- Activaciones: 5
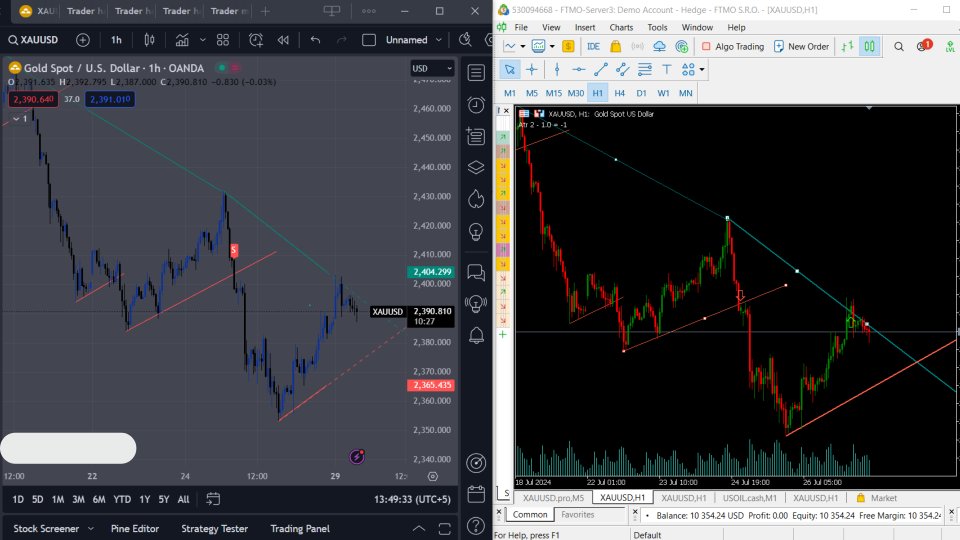
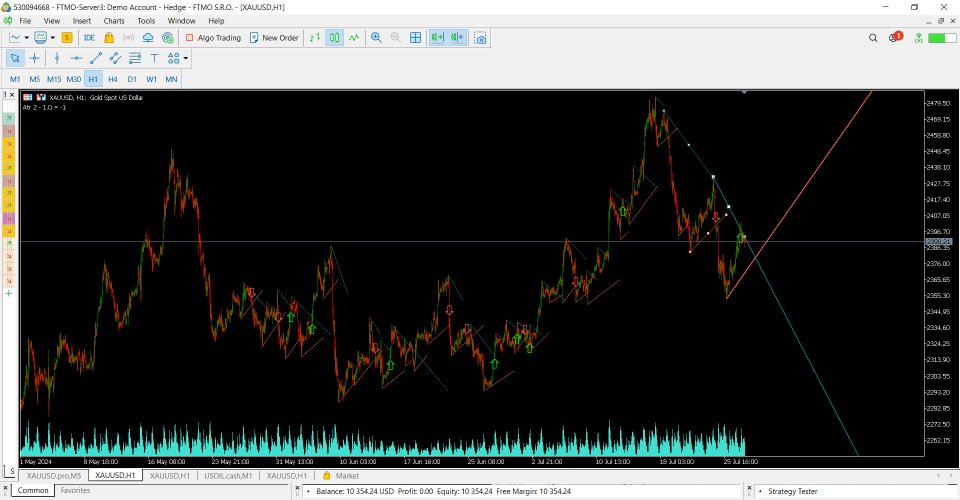
The trendlines with breaks indicator return pivot point based trendlines with highlighted breakouts. Users can control the steepness of the trendlines as well as their slope calculation method.
Trendline breakouts occur in real-time and are not subject to backpainting. Trendlines can however be subject to repainting unless turned off from the user settings.
The indicator includes integrated alerts for trendline breakouts.
Any valid trendlines methodology can be used with the indicator, users can identify breakouts in order to infer future price movements.
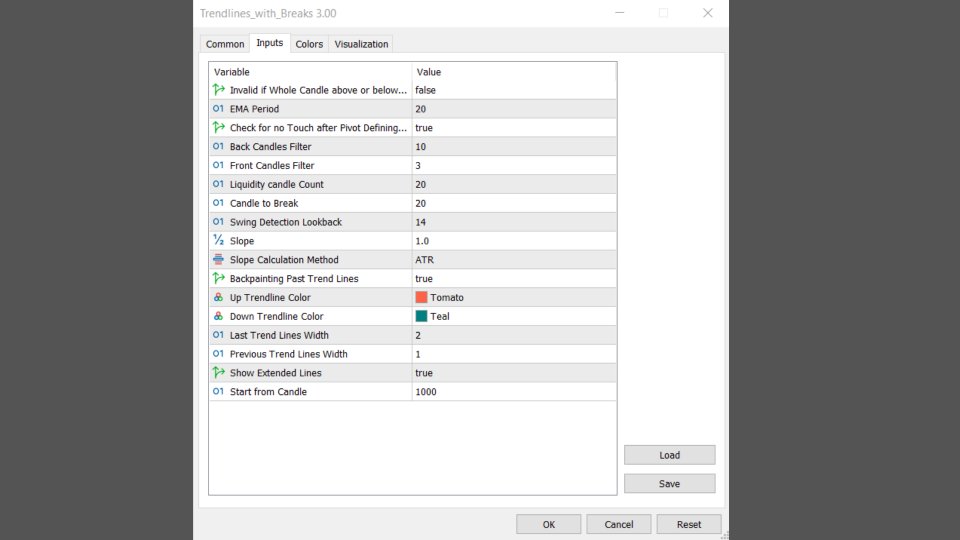
The calculation method of the slope greatly affects the trendline's behaviors. By default, an average true range is used, returning a more constant slope amongst trendlines. Other methods might return trendlines with significantly different slopes.
Stdev makes use of the standard deviation for the slope calculation, while Linreg makes use of the slope of a linear regression.
- Length: Pivot points period
- Slope: Slope steepness, values greater than 1 return a steeper slope. Using a slope of 0 would be equivalent to obtaining levels.
- Slope Calculation Method: Determines how the slope is calculated.
- Backpaint: Determine whether trendlines are backpainted, that is offset to past.


