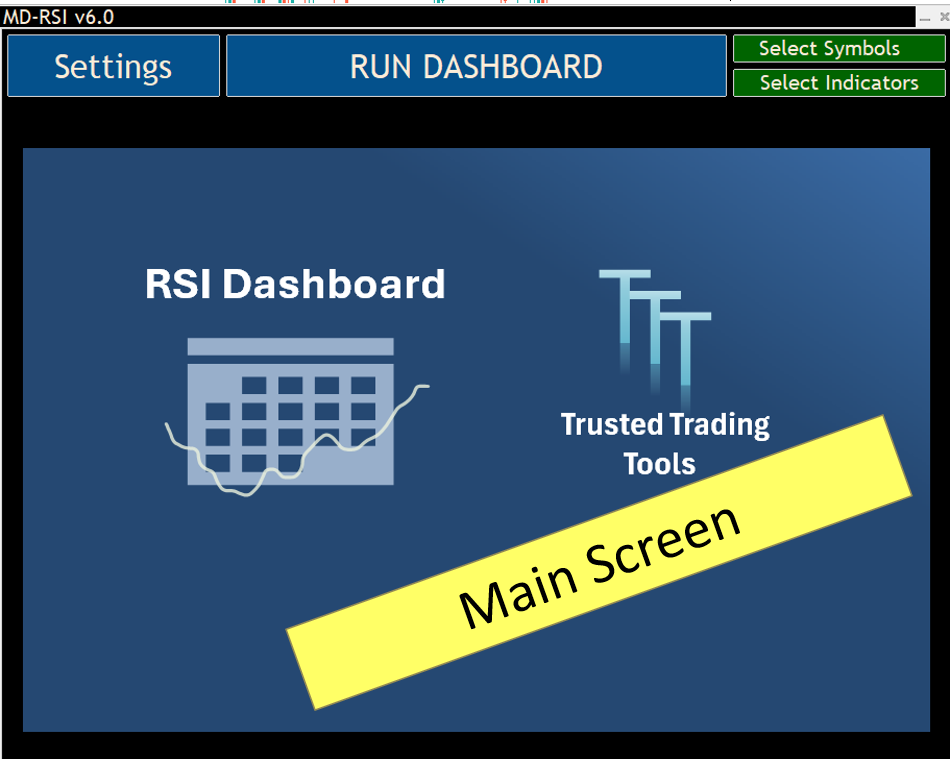
RSI Dashboard MT5 by TTT
- Indicadores
- Paul Anscombe
- Versión: 9.0
- Actualizado: 7 agosto 2024
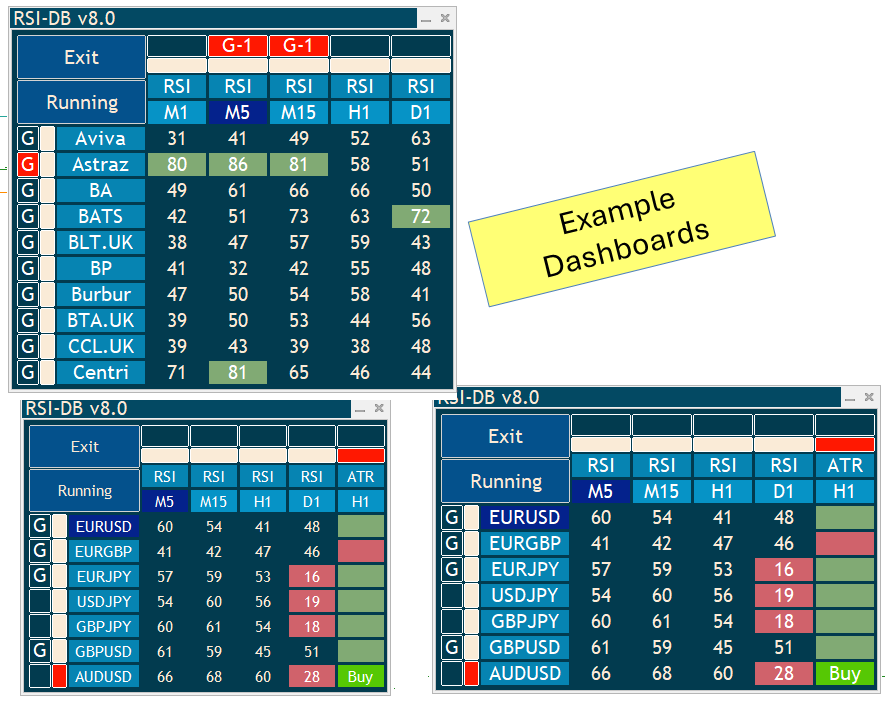
Amazing RSI + ATR Dashboard
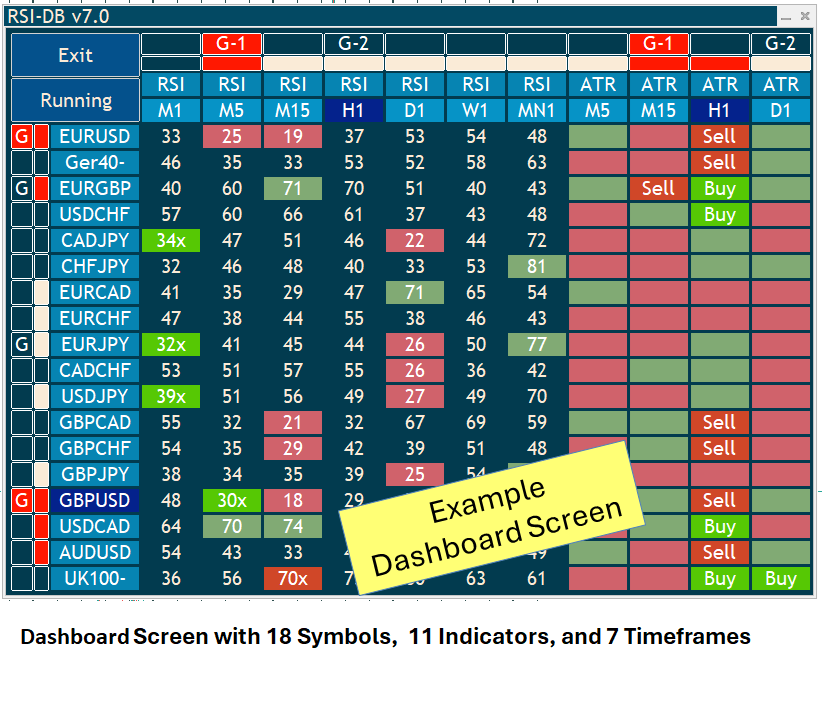
Indicators are useful for traders, but when you put them into a dashboard and can scan 28 symbols at once they become even better, and when you can also combine different indicators and timeframes to give you synchronized alerts they become awesome.
When this product gets 20 reviews I will add another indcator free to this dashboard as a thank you. This easy to use dashboard provides you with the RSI and ATR indicators, use them individually or together to create powerful combination alerts. So when you want to know that the ATR is bullish on H1 and the RSI is oversold on the M5 at the same time for example, then this is dashboard for you.
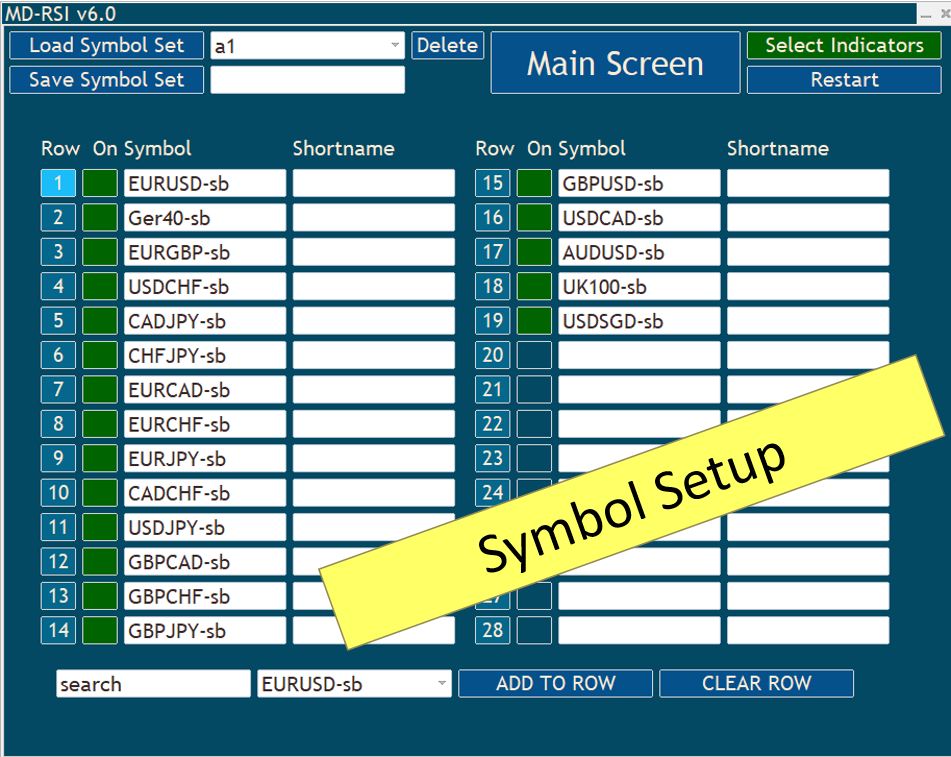
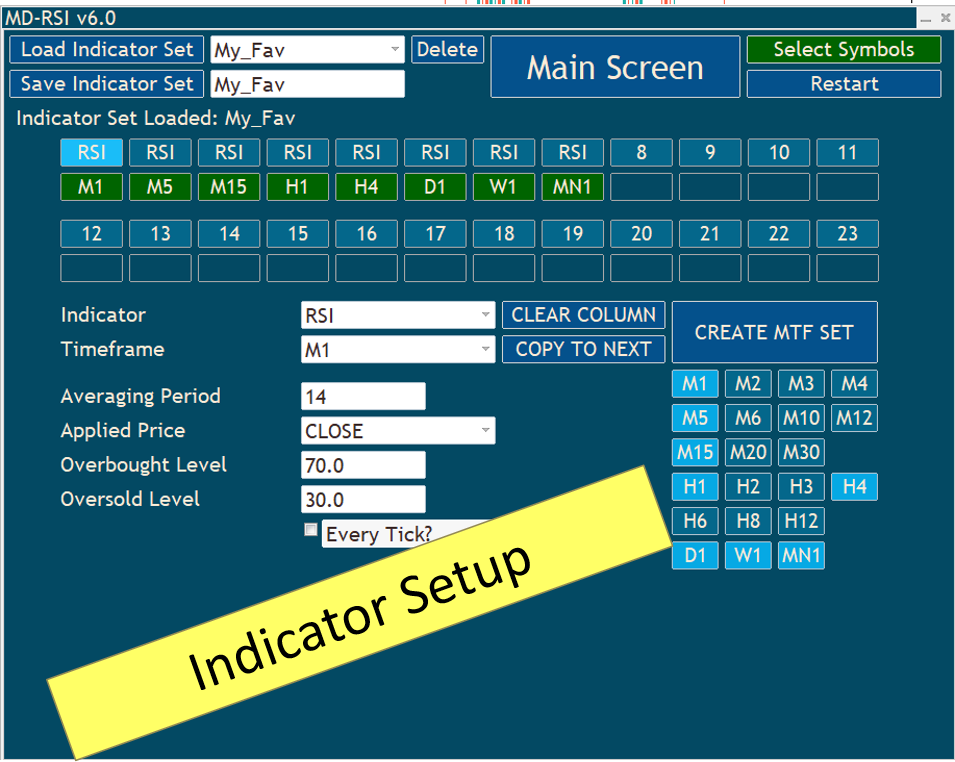
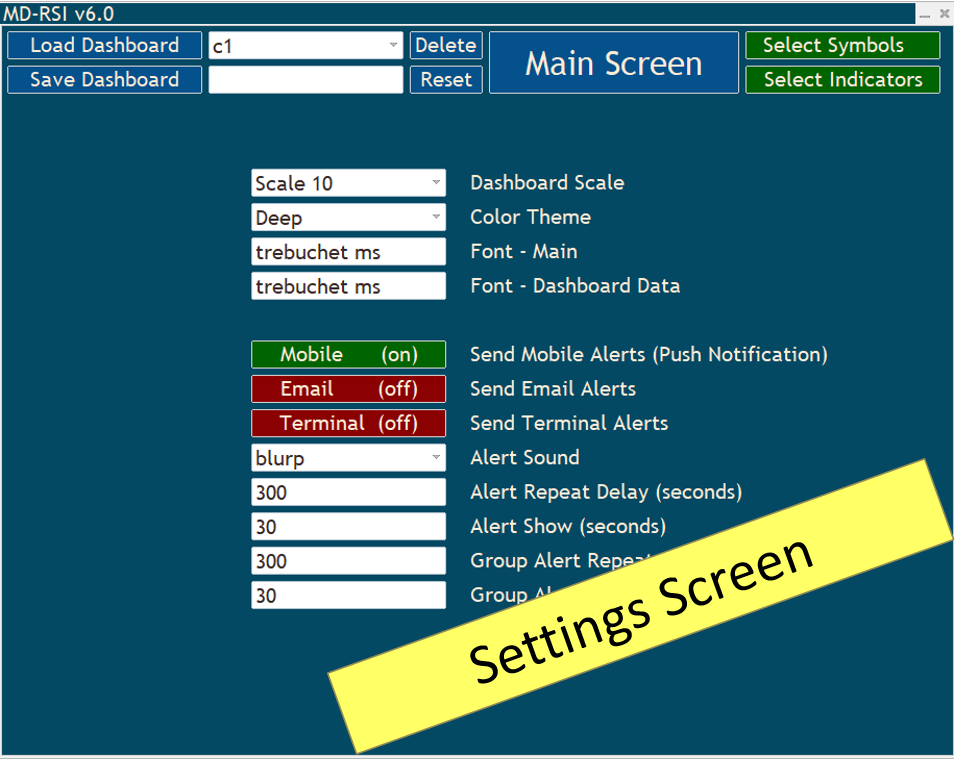
No more entering endless input paramaters to setup a dashboard, this dashboard has a full GUI interface, allowing you to create your own dashboard quickly and simply.
Each dashboard can be upto 28 Symbols x 24 indicators.
Each indicator can have it's own settings, thresholds and timeframe.
Create Individual or Group Alerts to be informed when your chosen indicators are aligned for any symbol.
Dashboard Features
- Unlimited symbol sets - create and save sets of symbols
- Unlimited indicator sets - create and save sets of indicators
- Unlimited dashboards - save unlimited number of dashboards
- Built in trading strategy alerts
- Individual Alerts
- Group Alerts - use upto 9 groups
- Alerts – Audible, Visual, Terminal, Email, Mobile
- 21 different alert sounds to choose from
- 7 different display scales to suit every user and chart size
- Control chart from dashboard (timeframe, symbol and indicator)
- Dashboard resizes automatically to save screen space.
- Easy to use graphical interface
- Multiple immersive color themes (customizable)
- Supports High Definition Monitors (UHD)
- Unique mobile alert process to comply with MQL limits across all our products.
- Full manual with detailed Trading Strategy Alerts guide
We hope you enjoy using this free product, but if you want a massive choice of indicators in a dashboard then check out our Mega Dashboard product, find it in our products link below.
|
When this product gets 10 reviews I will add another indcator free to this dashboard as a thank you |
|---|
Links:
All our products --> Trusted Trading Tools
Download the manual here --> RSI Dashbaord Manual
#tags #dashboard #scanner #rsi #atr #panel #trusted #trading #tools

Thank you very much. I use RSI for trading and I am very happy because I got acquainted with the tool and indicator that you made available. It is very practical. Wishing you more health and success