Chart Patterns All in One
- Indicadores
- Davit Beridze
- Versión: 2.6
- Actualizado: 14 noviembre 2024
- Activaciones: 5
Pruebe "Chart Patterns All in One" en modo demo y obtenga un bono. Envíeme un mensaje después de probarlo en modo demo para recibir su bono.
Deja un comentario después de la compra para recibir 8 indicadores de alta calidad como bono.
El indicador Chart Patterns All-in-One ayuda a los traders a visualizar varios patrones de gráficos comúnmente utilizados en el análisis técnico. Este indicador apoya la identificación de posibles comportamientos del mercado, pero no garantiza rentabilidad. Se recomienda probar el indicador en modo demo antes de comprar.
Oferta actual: Descuento del 50% en el indicador "Chart Patterns All in One".
Patrones incluidos:
-
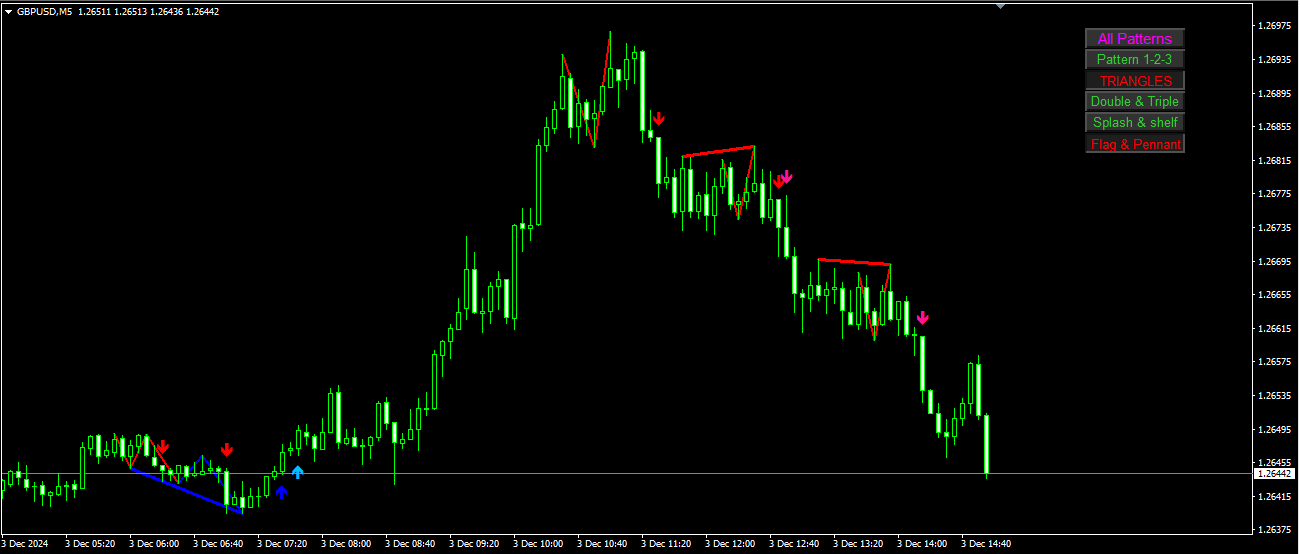
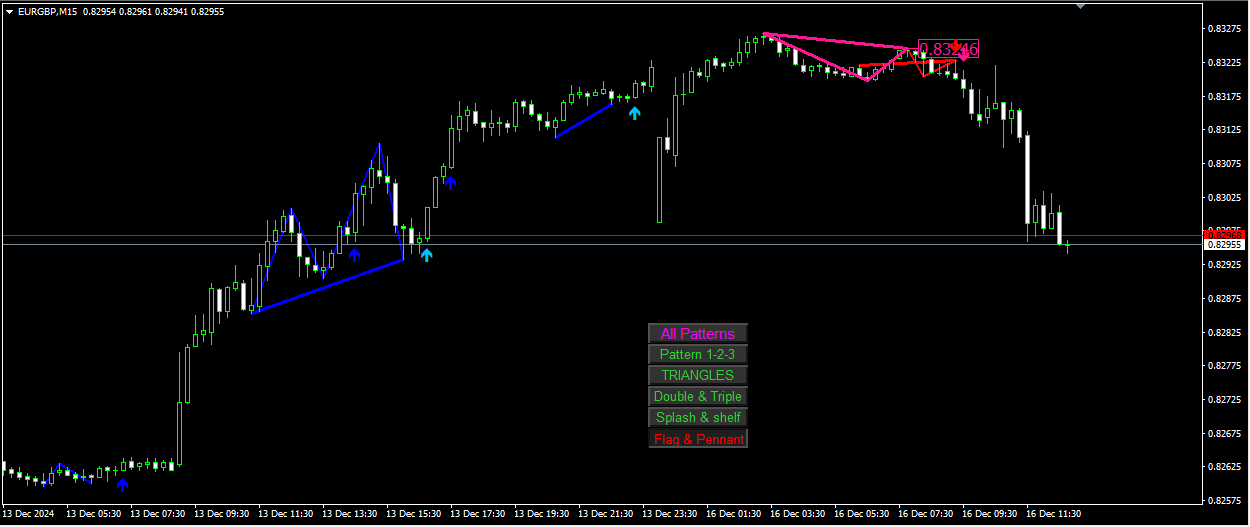
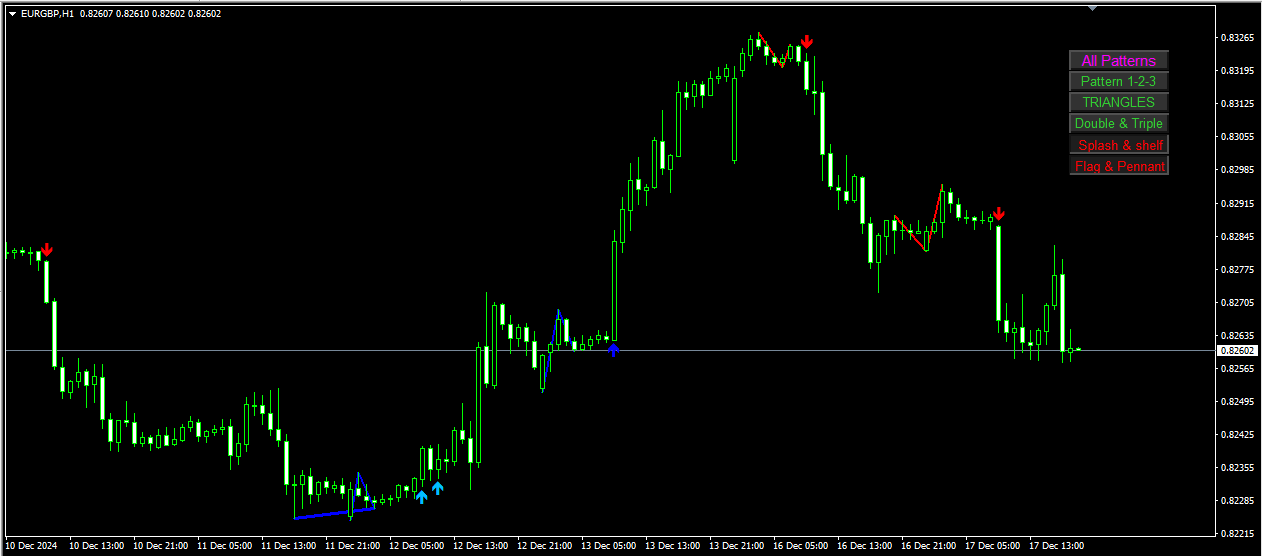
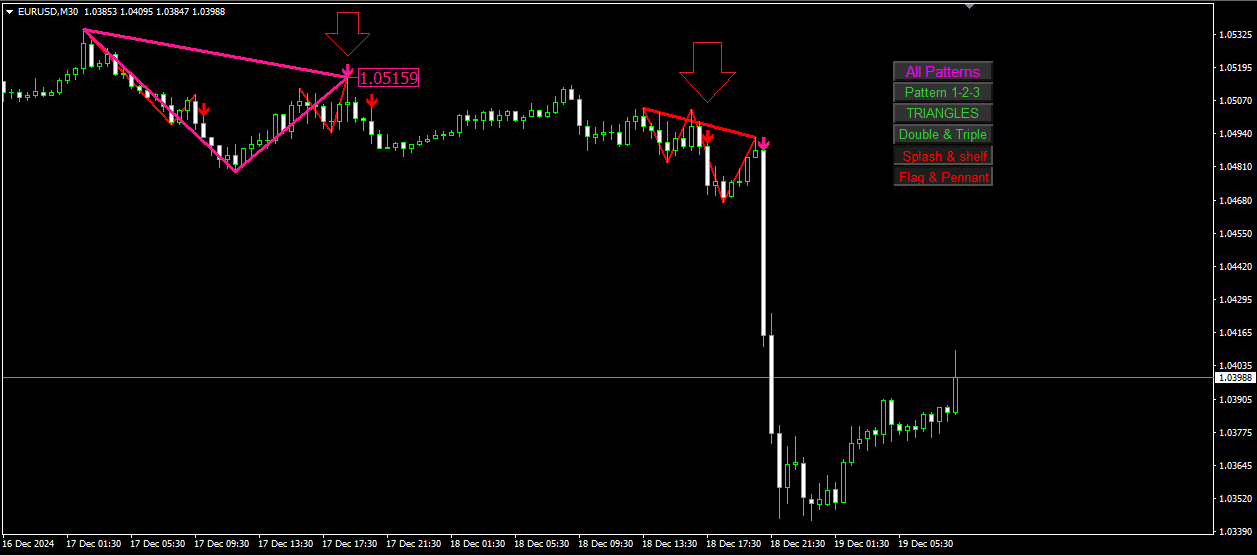
Patrón 1-2-3: Detecta reversiones del mercado utilizando tres puntos clave (máximos o mínimos).
- Compra: Dos mínimos consecutivos seguidos por un máximo más bajo.
- Venta: Dos máximos consecutivos seguidos por un mínimo más alto.
- Visualización: Líneas y flechas conectan los puntos identificados.
-
Doble techo y doble suelo: Indica posibles reversiones cuando el precio forma dos máximos consecutivos (Doble techo) o dos mínimos consecutivos (Doble suelo) que son aproximadamente iguales.
- Doble techo: Reversión bajista.
- Doble suelo: Reversión alcista.
- Visualización: Líneas conectan los picos o valles, y flechas marcan los puntos de reversión.
-
Triple techo y triple suelo: Similar al doble techo/suelo, pero con tres máximos o mínimos consecutivos, lo que indica una señal de reversión más fuerte.
- Triple techo: Reversión bajista.
- Triple suelo: Reversión alcista.
- Visualización: Líneas y flechas marcan el patrón.
-
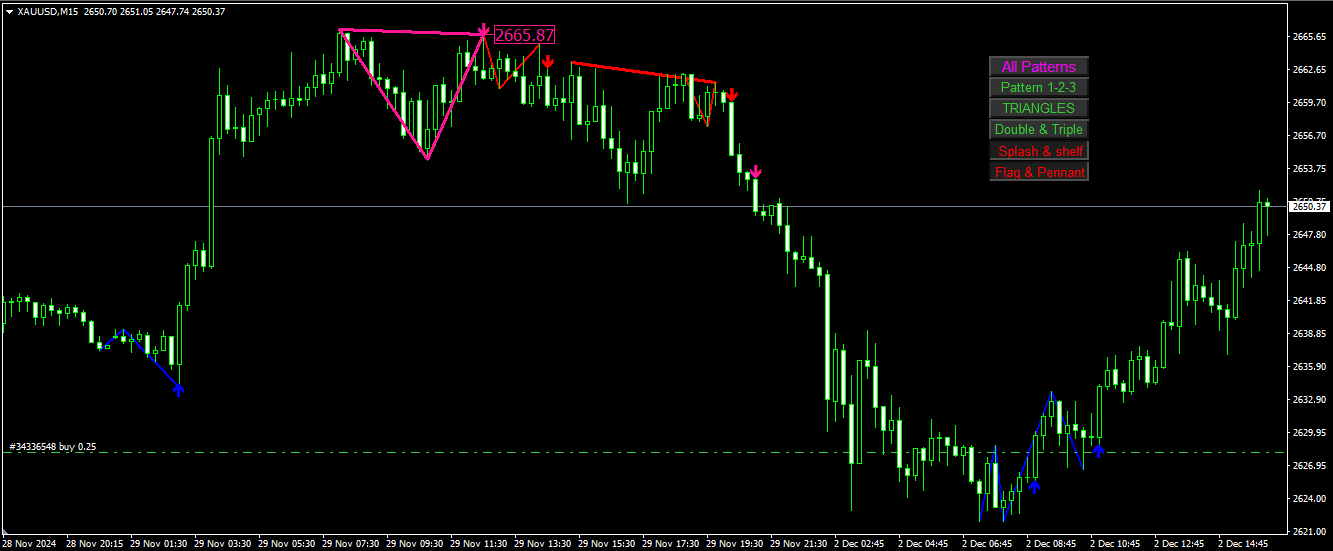
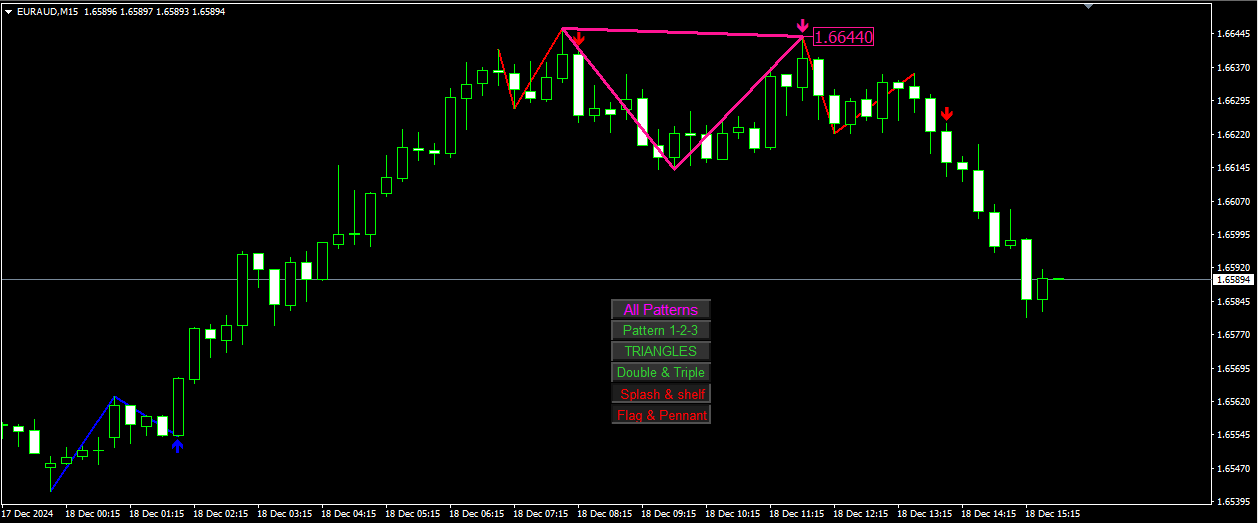
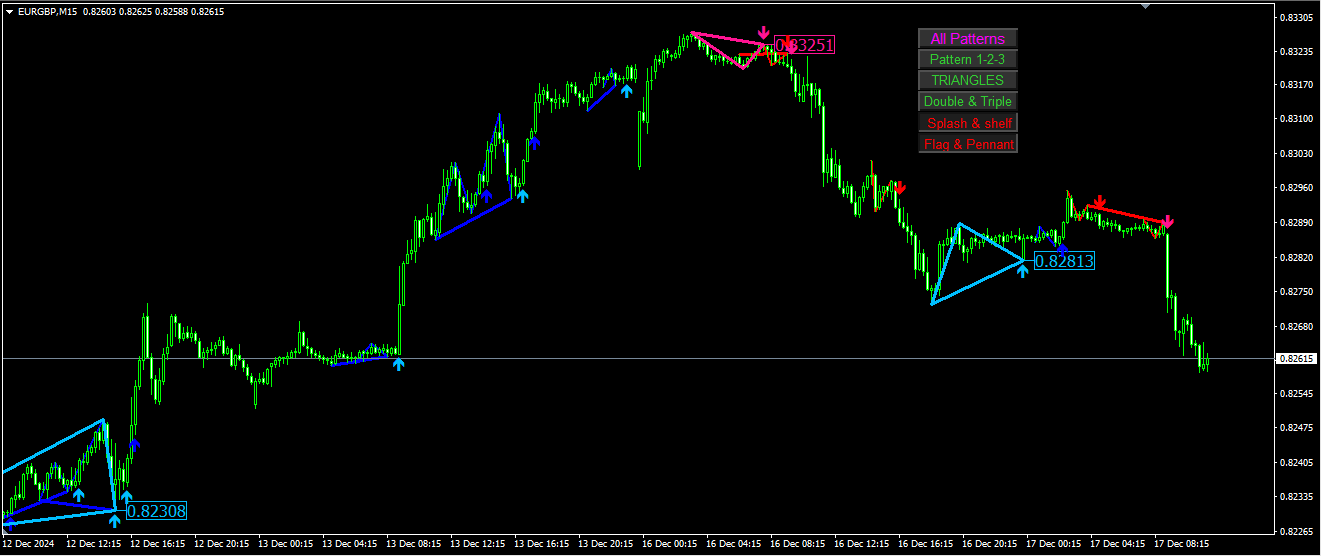
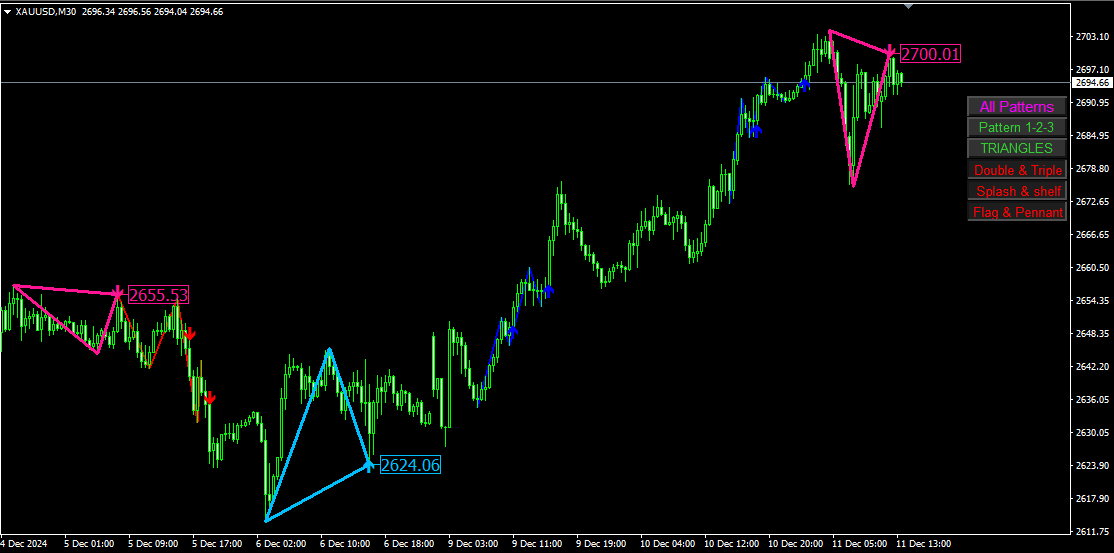
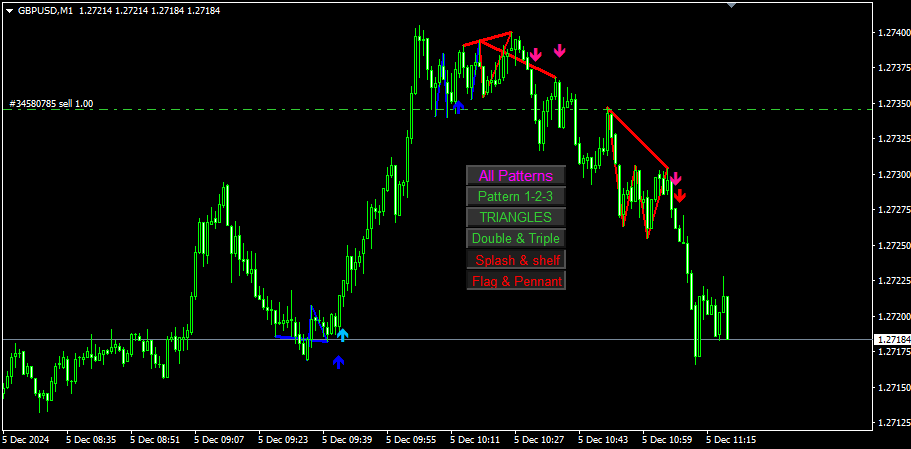
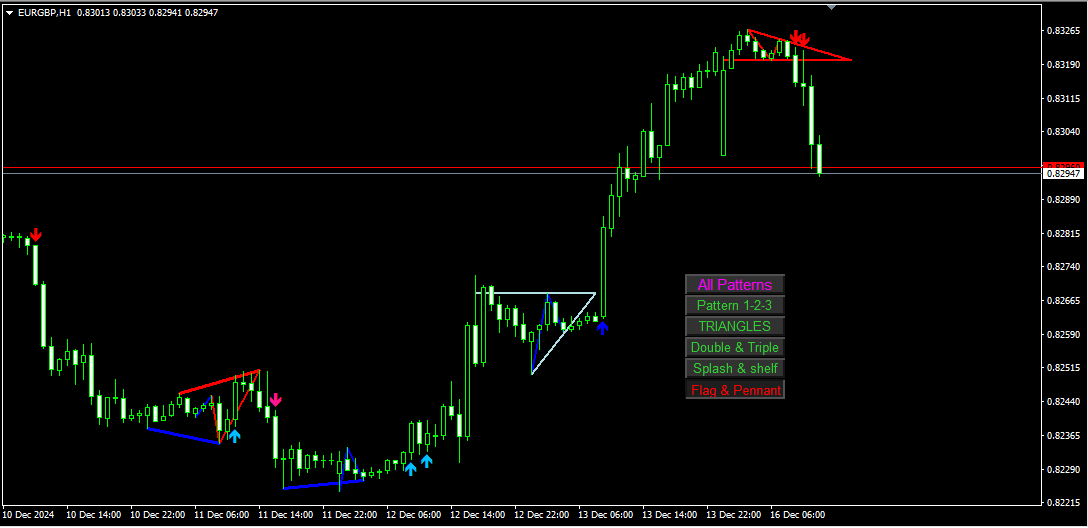
Triángulos: Identifican períodos de consolidación antes de que continúe la tendencia (basados en Zig-Zag, pueden aparecer tarde o desaparecer ocasionalmente).
- Triángulo ascendente: Continuación alcista.
- Triángulo descendente: Continuación bajista.
- Visualización: Los triángulos se dibujan en el gráfico con flechas que marcan los puntos de ruptura.
- A pesar de las posibles demoras o desapariciones debido al Zig-Zag, este patrón sigue siendo efectivo. Para más detalles, mira el video.
-
Splash y Shelf: Identifica movimientos bruscos de precios (Splash) seguidos de fases de consolidación (Shelf), lo que puede indicar rupturas potenciales.
- Splash: Movimiento brusco.
- Shelf: Consolidación después del Splash.
- Visualización: Líneas de tendencia y horizontales para los patrones Splash y Shelf.
-
Bandera y banderín: Patrones de continuación a corto plazo que señalan una breve pausa antes de que la tendencia continúe.
- Bandera alcista: Continuación de la tendencia alcista.
- Bandera bajista: Continuación de la tendencia bajista.
- Banderín: Patrón de continuación que forma un pequeño triángulo simétrico.
- Visualización: Formas y flechas indican el patrón y los puntos de ruptura.
Características:
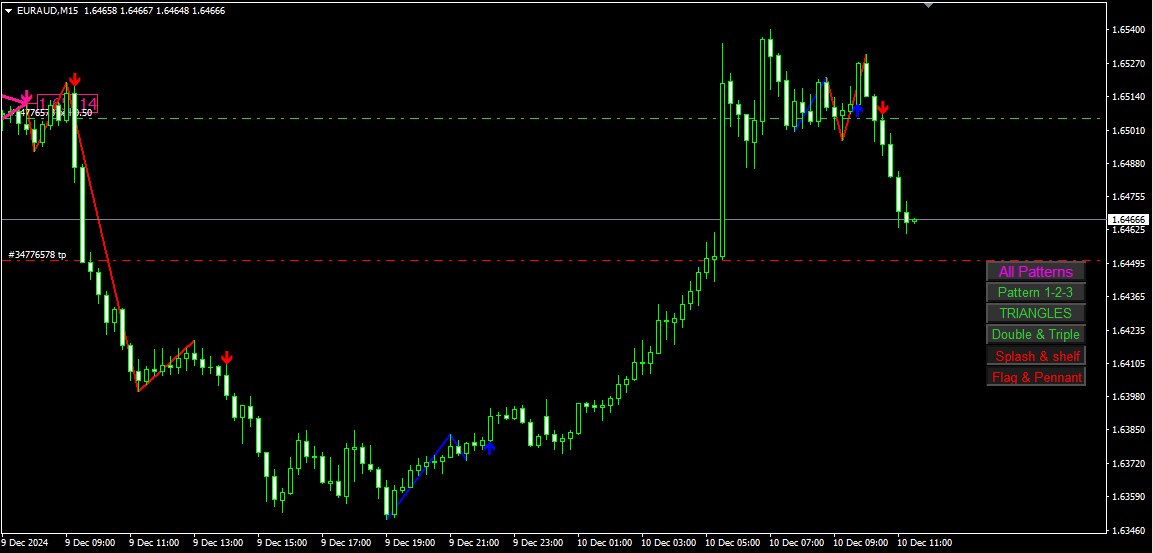
- Alternar patrones: Activa o desactiva fácilmente los patrones con botones en el gráfico.
- Configuraciones personalizables: Ajusta colores, anchos de línea y configuraciones específicas de los patrones.
- Alertas y notificaciones: Configura alertas cuando se detectan patrones.
Visualización:
- Líneas y flechas: Representación visual clara de los patrones.
- Botones interactivos: Alterna la visibilidad de los patrones directamente en el gráfico.
Este indicador todo en uno simplifica el análisis de múltiples patrones de gráficos, ofreciendo una herramienta flexible y personalizable para los usuarios de MT4.


It is a very accurate indicator. I really love it!!