Stats Dashboard
- Utilidades
- Apex Software Ltd
- Versión: 1.3
- Actualizado: 1 octubre 2024
Resumen
Utiliza el Panel de Estadísticas para seguir, analizar y mejorar tu rendimiento en el trading. Visualiza una selección de estadísticas clave en varios periodos, incluyendo diario, semanal, mensual y personalizado. Identifica fácilmente tus instrumentos con mejor y peor desempeño usando el gráfico interactivo de líneas.
El EA no se ejecuta en el probador de estrategias. Contáctanos para una prueba gratuita.
Estadísticas Mostradas:
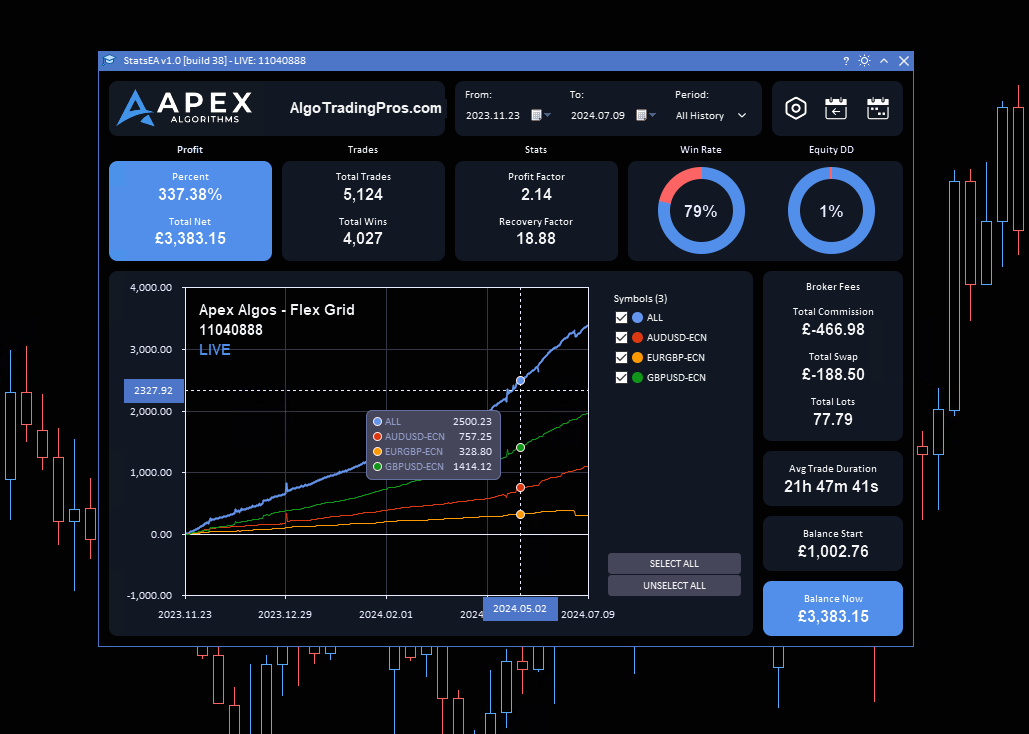
- Beneficio - % de Beneficio y Total Neto $
- Operaciones - Total de Operaciones y Ganadas
- Estadísticas - Factor de Beneficio y Factor de Recuperación
- Porcentaje de Ganancias
- Reducción - Reducción de Capital % y Reducción de Saldo %
- Comisiones del Broker - Comisión Total y Total de Tarifas Swap
- Total de Lotes Operados y Duración Promedio de la Operación
- Saldo Inicial y Saldo Actual
Características Principales
- Métricas Detalladas de Beneficio y Rendimiento
- Análisis de Datos en Tiempo Real
- Informes Resumidos Diarios
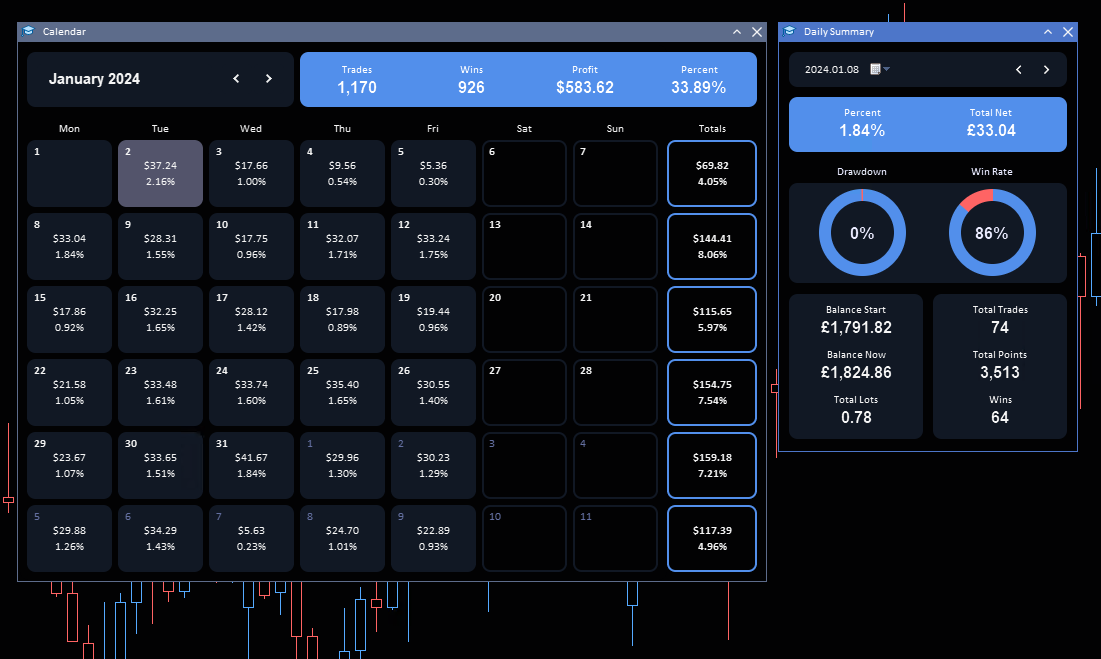
- Vista del Calendario Mensual
- Filtrado por Algoritmos Específicos (Números Mágicos)
Análisis de Datos en Tiempo Real
- Acceso a Datos de Trading en Tiempo Real: Mantente actualizado con los últimos movimientos del mercado y el rendimiento de tus operaciones.
- Toma Decisiones Informadas Basadas en Análisis del Mercado en Vivo: Utiliza datos actualizados para tomar decisiones de trading rápidas y precisas.
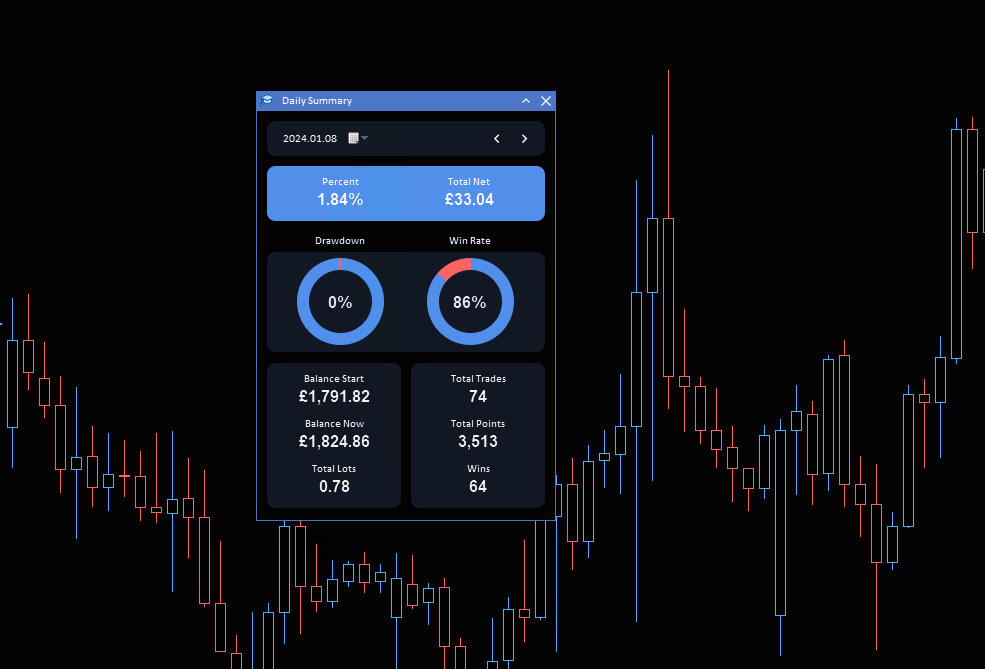
Informes Resumidos Diarios
- Mantente Informado con Resúmenes Diarios de Rendimiento: Revisa tus actividades diarias con informes detallados al final del día para asegurar que estás alineado con tus objetivos.
- Métricas Exhaustivas: Sigue indicadores clave de rendimiento como el total de operaciones, porcentaje de ganancias, factor de beneficio y más para entender mejor tu comportamiento y resultados en el trading.
Filtrado por Algoritmos Específicos
- Filtra Operaciones Usando Números Mágicos: Aísla y evalúa cómo están rindiendo los diferentes algoritmos o estrategias de trading.
- Filtros Personalizables en el Gráfico: En el gráfico, puedes filtrar datos por todos los símbolos de trading, seleccionar múltiples símbolos o enfocarte en pares de trading específicos, en cualquier rango de fechas.
Esta herramienta está diseñada para simplificar tu experiencia de trading y ayudarte a obtener mejores resultados.


Great product! High-quality, easy to use, and works as expected. Sleek design and excellent value for the price. I’m very satisfied and would definitely recommend it!