Support and Resistance Malaysian
- Indicadores
- Pierre Paul Amoussou
- Versión: 1.0
- Activaciones: 10
Support and Resistance Malaysian es un indicador personalizado diseñado para mostrar niveles de soporte y resistencia en un gráfico. Estos niveles se basan en la teoría de soporte y resistencia de Malasia, que define los niveles no como áreas, sino como niveles de precio específicos derivados de los picos y valles del gráfico de líneas.
Características:
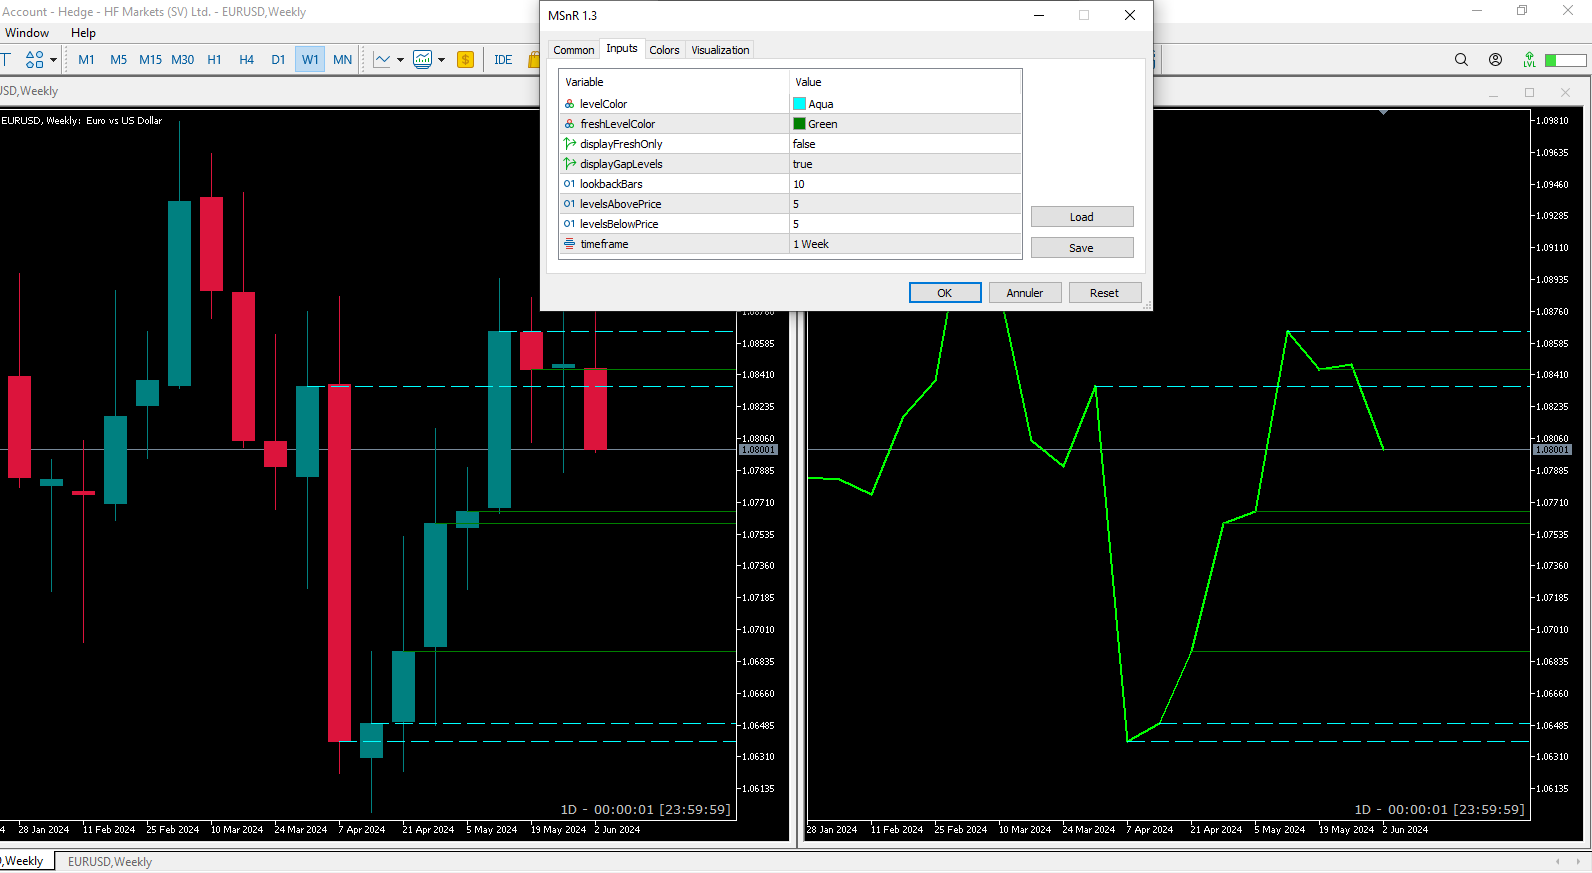
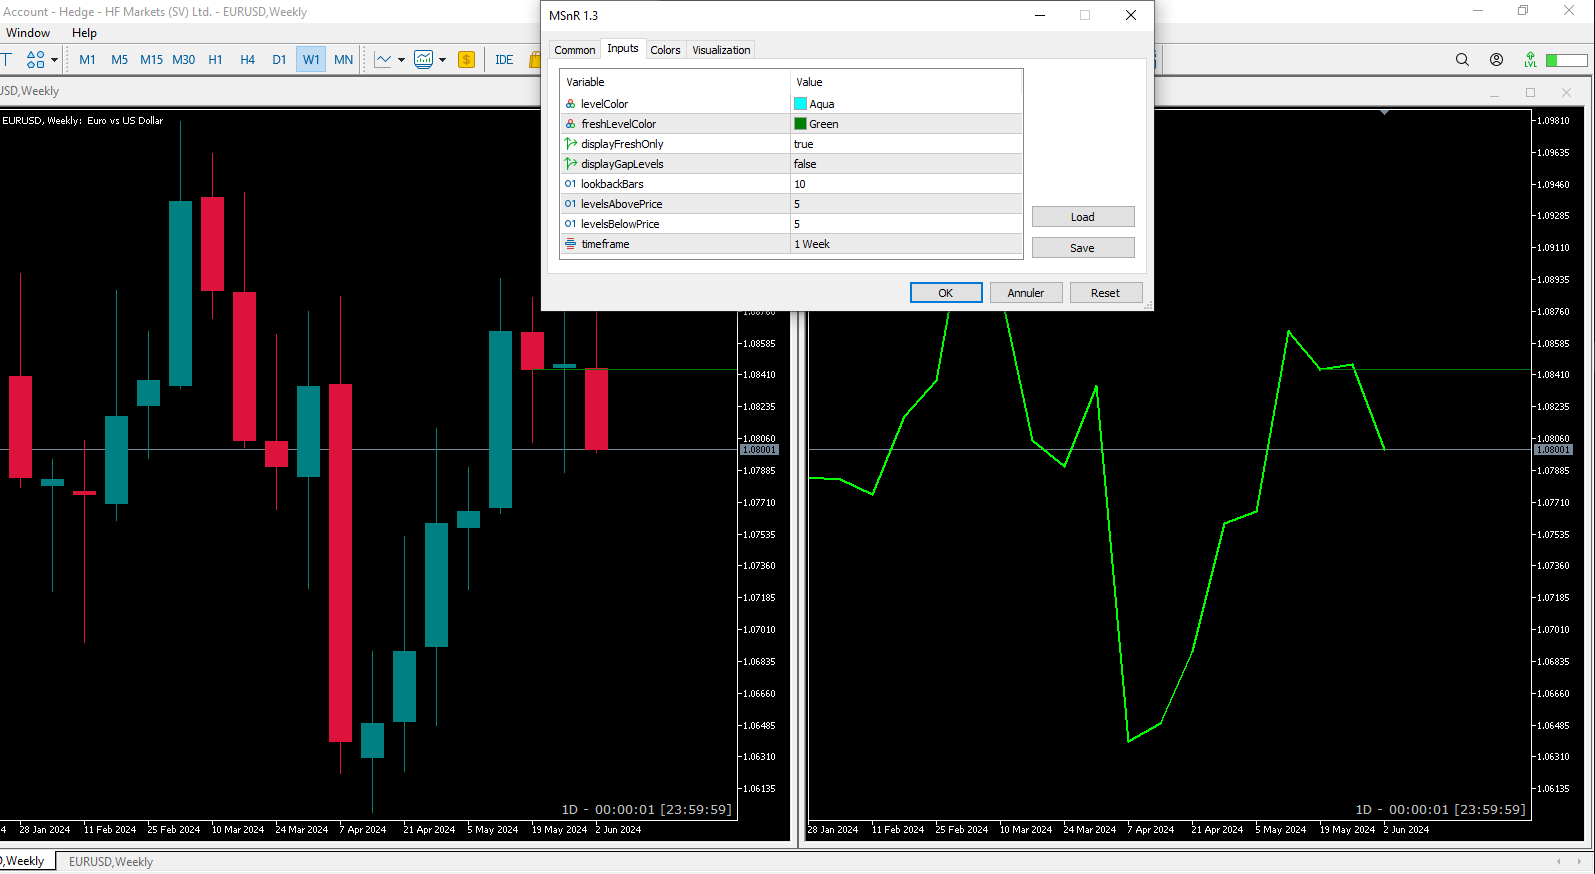
- Tres tipos de niveles: A-Level, V-Level y Nivel de brecha.
- Indicación de frescura para los niveles: los niveles frescos son más significativos que los niveles no frescos.
- Colores y estilos personalizables para los niveles frescos y no frescos.
- Opción para mostrar solo niveles frescos o todos los niveles.
- Período de retroceso ajustable y número de niveles por encima y por debajo del precio actual.
- Admite múltiples marcos de tiempo.
Uso:
Los traders pueden usar MSnR Lines para identificar posibles niveles de soporte y resistencia para tomar decisiones comerciales. Los niveles frescos se consideran más significativos y pueden ofrecer mejores oportunidades comerciales.