AC Fix
- Indicadores
- Sabina Fik
- Versión: 1.0
- Activaciones: 5
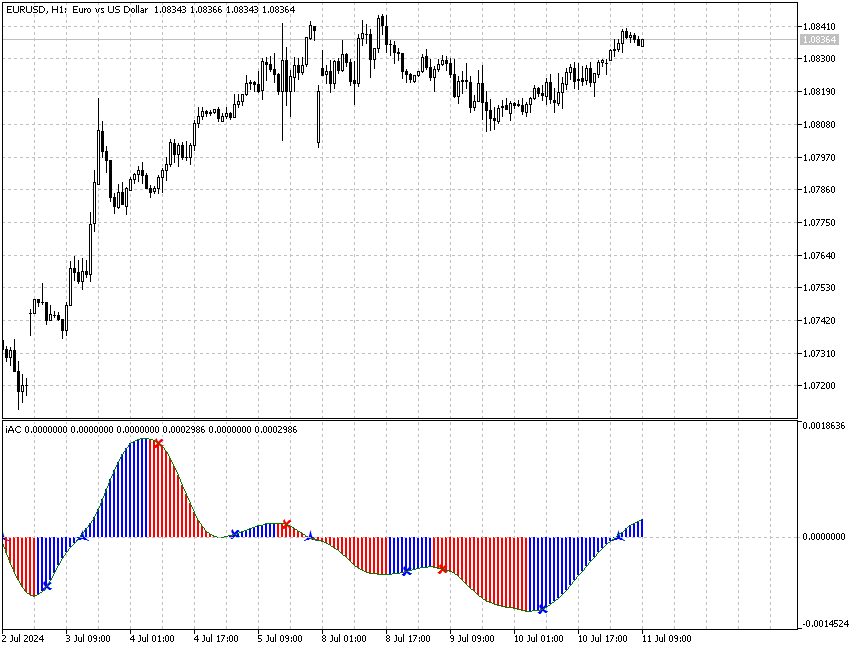
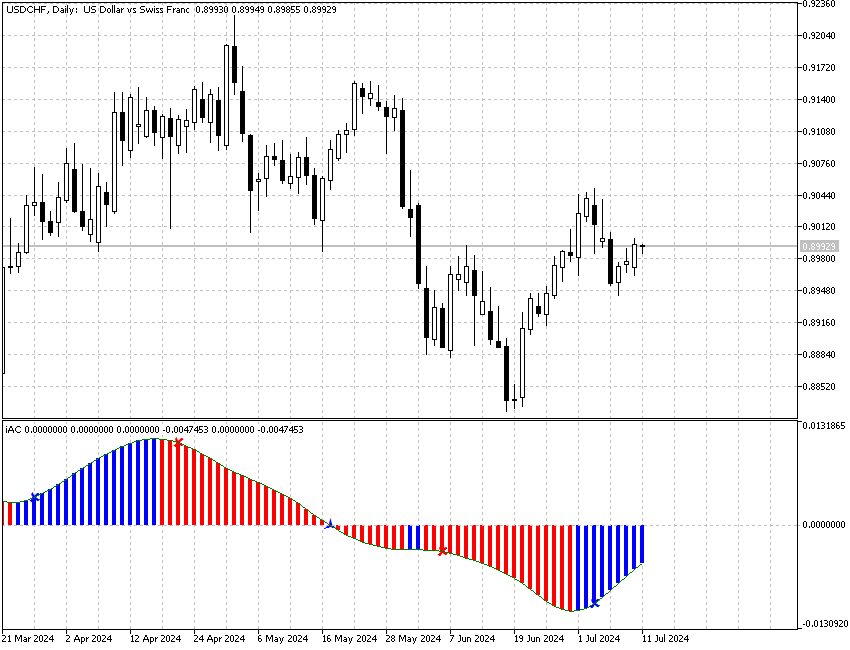
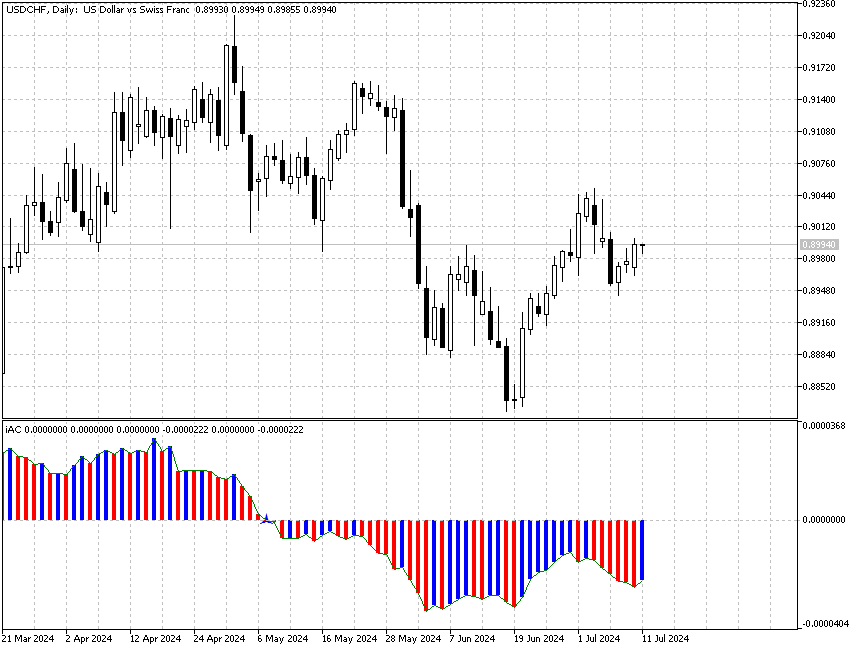
The Accelerator Oscillator (AC) technical indicator measures the acceleration or deceleration of the current market strength. It is designed to identify potential trend reversal points and is used to determine the moment of buying or selling assets. The indicator helps traders make decisions based on changes in market dynamics.
This implementation of the indicator is its creative version. Since the standard version is very limited by its built-in settings, this implementation has significantly more expanded functionality. Let's consider this further.
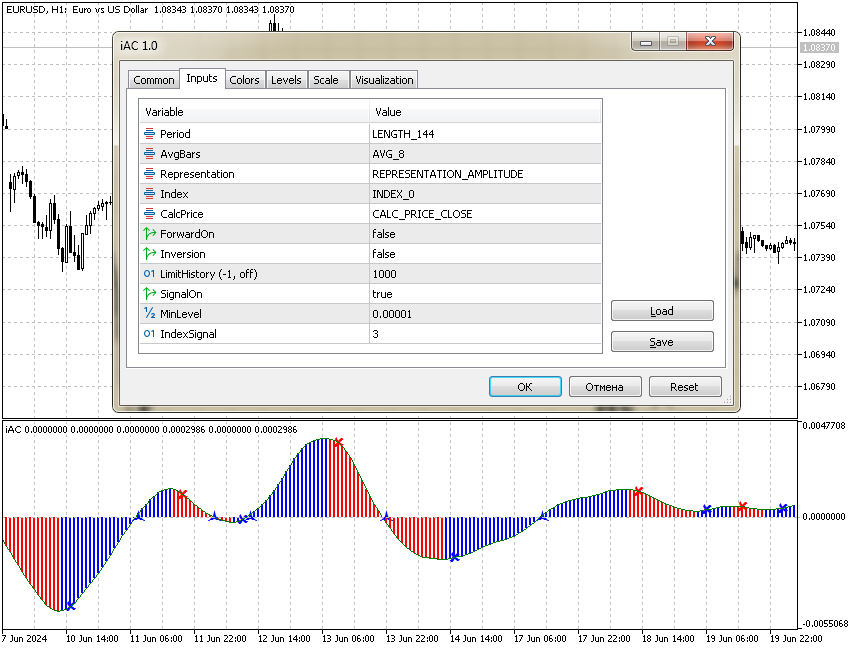
Indicator Parameters
Period - Number of bars for calculation. Possible options:
- LENGTH_1 = 1
- LENGTH_2 = 2
- LENGTH_3 = 3
- LENGTH_5 = 5
- LENGTH_8 = 8
- LENGTH_13 = 13
- LENGTH_21 = 21
- LENGTH_34 = 34
- LENGTH_39 = 39
- LENGTH_55 = 55
- LENGTH_89 = 89
- LENGTH_144 = 144
- LENGTH_233 = 233
- LENGTH_377 = 377
- LENGTH_610 = 610
AvgBars - Smoothing of the final line of the indicator. Possible options:
- AVG_1 = 1
- AVG_2 = 2
- AVG_3 = 3
- AVG_5 = 5
- AVG_8 = 8
- AVG_13 = 13
- AVG_21 = 21
- AVG_34 = 34
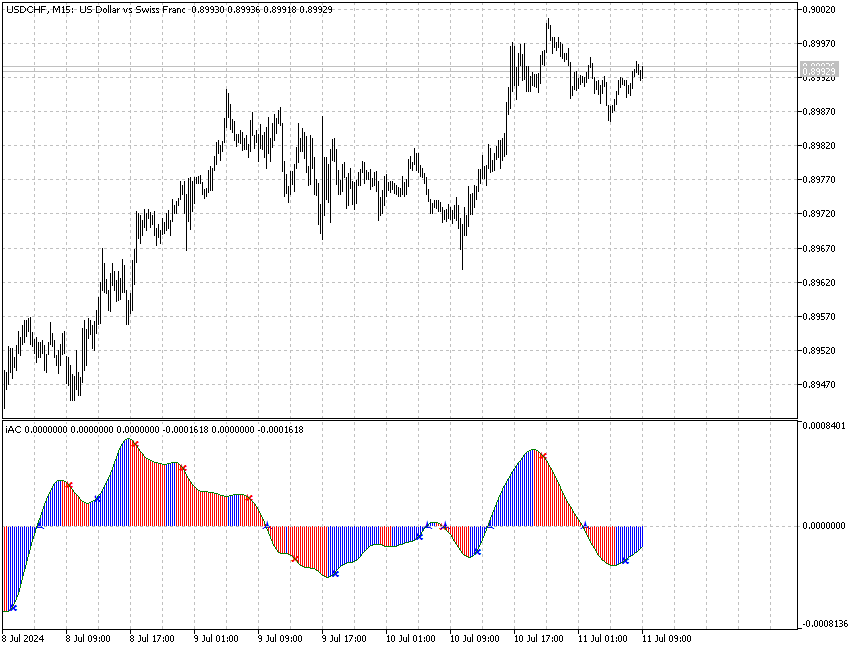
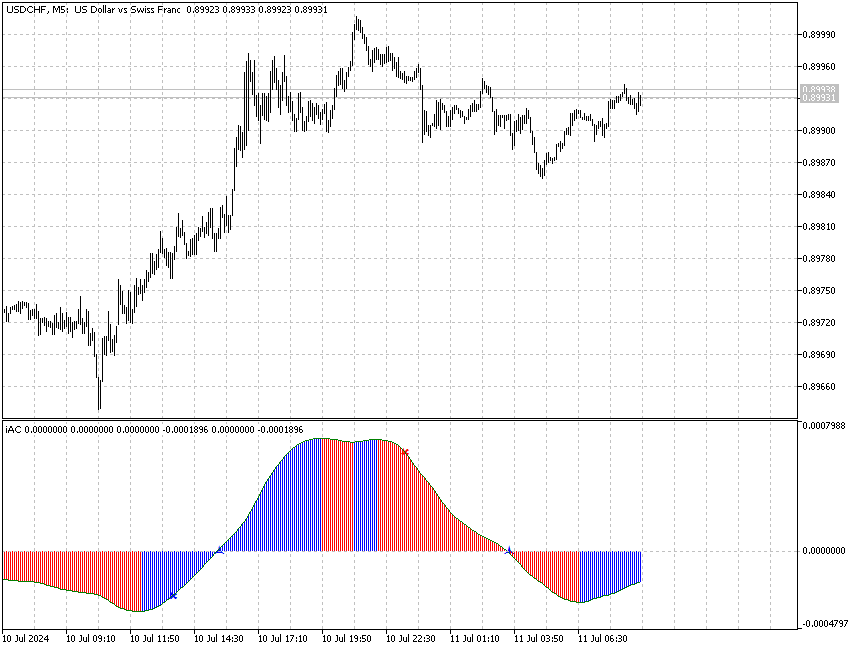
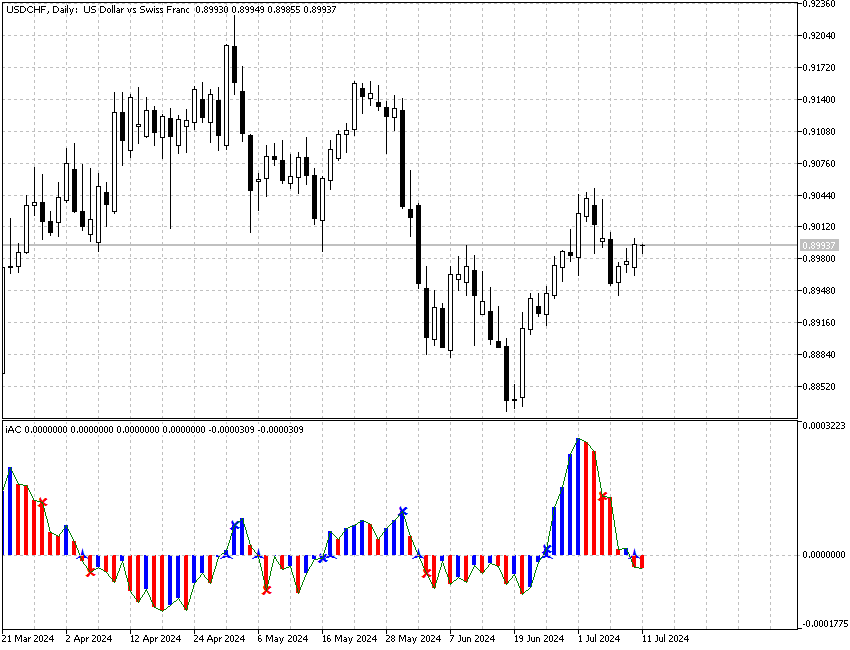
Representation - Possible methods of projecting the indicator. Possible options:
- REPRESENTATION_AMPLITUDE
- REPRESENTATION_SPEED
- REPRESENTATION_ACCELERATION
Amplitude
Amplitude is the maximum distance that an object oscillates from its equilibrium position. Visually, it can be represented as the distance from the central point (mean position) to the extreme point of the object's trajectory. If we consider a pendulum, the amplitude is the greatest deviation of the pendulum from the vertical.
Speed
Speed is how fast an object moves. Geometrically, speed indicates the direction and magnitude of an object's movement at each moment in time. In the case of oscillations, speed is highest when the object passes through the mean position (equilibrium position) and zero when the object is at the extreme points (maximum deviations).
Acceleration
Acceleration is how quickly the speed of an object changes. Geometrically, this can be imagined as an arrow that always points toward the mean position. In the case of oscillations, acceleration is highest at the extreme points (when the object is farthest from the mean position) and zero when the object passes through the mean position.
Visualization on the Example of a Pendulum
- Amplitude is the maximum height that the pendulum rises from its lowest point (equilibrium position).
- Speed is how fast the pendulum moves. It is highest when the pendulum passes through the lowest point and lowest (zero) when the pendulum reaches the highest points.
- Acceleration is the force that pulls the pendulum back to the mean position. It is highest at the extreme points and absent at the mean point.
These concepts are interrelated and describe different aspects of the movement of an oscillating object.
Additional Indicator Parameters
Index - The index from which to start the calculation
CalcPrice - Apply to price
ForwardOn - Allow forward calculation on history (the latest bars will not be displayed). Function created for research.
Inversion - Chart inversion.
LimitHistory - History limit for indicator display.
SignalOn - Ability to display signal points.
MinLevel - Delta of the price of the last two bars when calculating signal points.
IndexSignal - How many bars should consecutively fall or rise to fix the signal.