• Información general
  • Comentarios
  • Discusión

GO Trend MultiTimeFrame

El indicador "GoTrend Multi-Timeframe" es una herramienta imprescindible para los traders que buscan una forma rápida y eficiente de evaluar la tendencia general y específica de un par de divisas en diferentes marcos de tiempo.

Este indicador permite a los traders obtener una visión clara y completa de la dirección del mercado con tan solo un vistazo, optimizando así su toma de decisiones y mejorando la efectividad de sus estrategias de trading.

Características Principales:

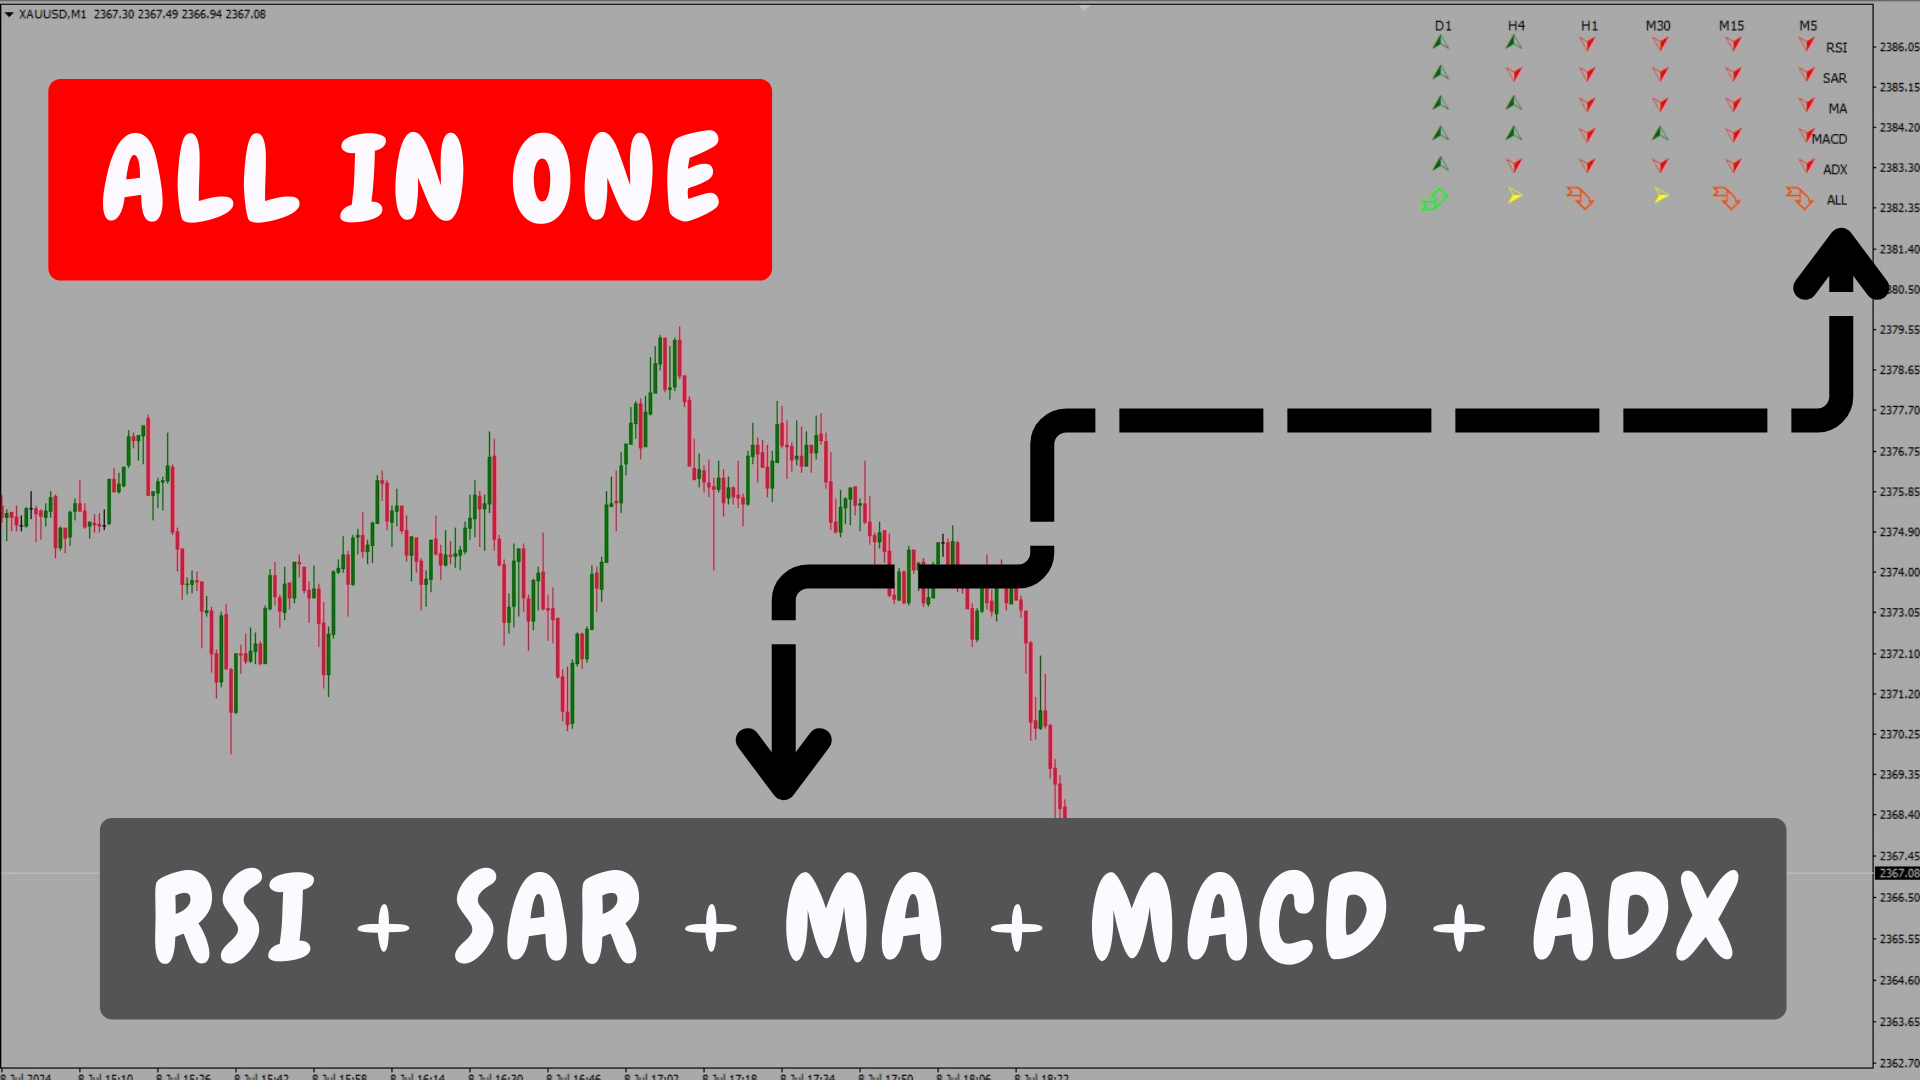
  1. Análisis Multimarcos de Tiempo: Este indicador proporciona un análisis exhaustivo de seis marcos de tiempo diferentes: M5, M15, M30, H1, H4 y D1, permitiendo a los traders entender la tendencia en cada uno de estos períodos.
  2. Indicadores Técnicos Integrados: El indicador utiliza cinco indicadores técnicos robustos: RSI, SAR, MA, MACD y ADX, para determinar la dirección de la tendencia en cada marco de tiempo.
  3. Visualización Clara e Intuitiva: Las señales se muestran en la esquina que prefieras del gráfico principal mediante símbolos y colores intuitivos. Esto permite a los traders evaluar la situación del mercado de un vistazo.
  4. Señal Combinada: Además de las señales individuales de cada indicador, el "GoTrend Multi-Timeframe" ofrece una señal combinada que resume la tendencia general del mercado para ese par.

Beneficios para el Trading:

  1. Visión Rápida y Clara de la Tendencia: Con este indicador, los traders pueden obtener una visión rápida y clara de la dirección de la tendencia en múltiples marcos de tiempo, lo que es crucial para tomar decisiones informadas y oportunas.
  2. Optimización de Entradas y Salidas: Las señales de compra y venta en diferentes marcos de tiempo ayudan a los traders a optimizar sus puntos de entrada y salida, aumentando la probabilidad de éxito en sus operaciones.
  3. Reducción del Ruido del Mercado: Al centrarse en las señales de tendencia de múltiples marcos de tiempo, los traders pueden filtrar el ruido del mercado y evitar falsas entradas, mejorando así su gestión del riesgo.
  4. Facilidad de Uso: La configuración del indicador es sencilla y los resultados se muestran de forma clara, lo que facilita su uso incluso para traders principiantes.

Uso del Indicador:

  • Evaluación de la Tendencia: Antes de tomar una decisión de trading, los traders pueden verificar la tendencia en los seis marcos de tiempo diferentes. Si la mayoría de los marcos de tiempo muestran una señal de compra o venta, esto proporciona una confirmación sólida de la dirección del mercado.
  • Estrategia de Entradas y Salidas: Utilice las señales individuales para identificar puntos óptimos de entrada y salida. Por ejemplo, una señal de compra en varios marcos de tiempo puede indicar un buen momento para entrar en una posición larga.
  • Gestión de Operaciones: La señal combinada "ALL" ofrece una vista general de la tendencia de ese par, ayudando a los traders a mantener sus posiciones en la dirección correcta de la tendencia o a abrir nuevos trades en el mismo sentido de la tendencia general.

Configuración del Indicador:

  • Posición en el Gráfico: El indicador se muestra en la esquina del gráfico principal con ajustes personalizables para el espaciado y tamaño de los símbolos.
  • Colores Personalizables: Los colores de las señales de "compra", "venta" y "no señal" son personalizables para adaptarse a las preferencias visuales del trader.


Limitación de Alarmas:

Este indicador no tiene ni puede tener alarmas debido a su diseño flexible que se adapta a todo tipo de trading. Esto incluye operar en un solo marco de tiempo, en marcos de tiempo cruzados, o utilizando un marco de tiempo mayor para determinar la tendencia y luego buscar entradas en marcos de tiempo inferiores. Las alarmas fijas no serían adecuadas para la naturaleza versátil y adaptativa del "GoTrend Multi-Timeframe".


"GoTrend Multi-Timeframe" es el aliado perfecto para cualquier trader que quiera facilitar su toma de decisiones y optimizar sus operaciones. Con una visualización clara y un análisis profundo de la tendencia en múltiples marcos de tiempo, este indicador proporciona la información necesaria para un entendimiento mas veloz de la situacion del par que esta operando y por consecuente tomar decisiones de trading más acertivas.


Descripcion de los Parámetros de Entrada:

  1. scaleX (Valor: 60): Define la distancia horizontal entre las señales mostradas en el gráfico. Este valor ajusta el espacio entre los íconos para una visualización clara y organizada.

  2. scaleY (Valor: 25): Define la distancia vertical entre las señales mostradas en el gráfico. Este valor ajusta el espacio entre los íconos para evitar superposiciones y asegurar una lectura fácil.

  3. offSetX (Valor: 45): Establece la distancia horizontal desde el borde izquierdo del gráfico hasta el primer ícono de señal. Permite posicionar las señales en el lugar deseado del gráfico.

  4. offSetY (Valor: 20): Establece la distancia vertical desde el borde superior del gráfico hasta el primer ícono de señal. Permite posicionar las señales en el lugar deseado del gráfico.

  5. fontSize (Valor: 15): Tamaño de la fuente de los íconos de señal. Este valor determina qué tan grandes o pequeños se verán los íconos en el gráfico.

  6. corner (Valor: 2): Define en qué esquina del gráfico se posicionarán las señales. Los valores pueden ser:

    • 0: Esquina superior izquierda
    • 1: Esquina superior derecha
    • 2: Esquina inferior izquierda
    • 3: Esquina inferior derecha
  7. symbolCodeBuy (Valor: 217): Código del símbolo que representa una señal de compra. Este código corresponde a un carácter específico en la fuente "Wingdings".

  8. symbolCodeSell (Valor: 218): Código del símbolo que representa una señal de venta. Este código corresponde a un carácter específico en la fuente "Wingdings".

  9. symbolCodeNoSignal (Valor: 216): Código del símbolo que representa la ausencia de señal. Este código corresponde a un carácter específico en la fuente "Wingdings".

  10. allBuy (Valor: 200): Código del símbolo que representa una señal combinada de compra. Este código corresponde a un carácter específico en la fuente "Wingdings".

  11. allSell (Valor: 202): Código del símbolo que representa una señal combinada de venta. Este código corresponde a un carácter específico en la fuente "Wingdings".


Colores de las Señales:

  1. signalBuyColor (Strong Up) - (Color: DarkGreen): Color del símbolo que indica una señal de compra fuerte.

  2. signalSellColor (Strong Down) - (Color: Red): Color del símbolo que indica una señal de venta fuerte.

  3. noSignalColor (No Signal) - (Color: Goldenrod): Color del símbolo que indica que no hay señal.

  4. allSellColor (Color: OrangeRed): Color del símbolo que indica una señal combinada de venta.

  5. allBuyColor (Color: Lime): Color del símbolo que indica una señal combinada de compra.

  6. textColor (Color: Black): Color del texto que describe los periodos de tiempo (M5, M15, M30, H1, H4, D1) y los nombres de los indicadores (RSI, SAR, MA, MACD, ADX, ALL).


Estos parámetros permiten personalizar la apariencia en función del color del gráfico que prefiera utilizar cada trader. 


Productos recomendados
PDP indicator is used for: defining price probability distributions. This allows for a detailed representation of the channel and its borders and forecast the probability of a price appearing at each segment of its fluctuations; defining the channel change moment. Operation principles and features PDP analyzes a quote history on lower timeframes and calculates a price probability distribution on higher ones. Forecast algorithms allow the indicator to calculate probability distributions and m
Time Levels
Yurij Izyumov
4.27 (11)
The indicator is designed for displaying the following price levels on the chart: Previous day's high and low. Previous week's high and low. Previous month's high and low. Each of the level types is customizable. In the indicator settings, you set line style, line color, enable or disable separate levels. The version of the exact same indicator but only with sound alerts there - Time Levels with Alerts . Configurations ----Day------------------------------------------------- DayLevels - enable
FREE
Adaptive SSA
Jean Francois Le Bas
SSA stands for ' Singular Spectrum Analysis '. It combines elements of classical time series decomposition, statistics, multivariate geometry, dynamical systems and signal processing. SSA decomposes time series into a sum of components (ETs), with each component representing a lower smoothing, using several SVD ( Singular Value Decompositions ). It is a powerful filtering process used in many fields of research (climatology, biomedical, aerospace, etc), where high quality forecasting and smoo
Big Figure Indicator
Vonjinirina Alfred Randrianiaina
"BIG FIGURE INDICATOR" identifica y dibuja automáticamente líneas horizontales en los gráficos de precios en niveles específicos, como números enteros o medios números (por ejemplo, 1.0000 o 1.5000 en el comercio de divisas). Estos niveles se consideran psicológicamente significativos porque representan números redondos en los que los grandes traders e inversores pueden centrarse, lo que lleva a posibles niveles de soporte o resistencia. El indicador de gran número puede ayudar a los traders a
FREE
Beautiful
Tatiana Savkevych
The Beautiful indicator shows potential market reversal points. The intelligent algorithm of the indicator detects the trend well, filters out market noise and generates input signals and exit levels. Uses just one parameter for settings. Simple, visual and efficient trend detection. The indicator does not redraw and does not lag. You can set up message alerts as sound or email. Works on all currency pairs and on all timeframes. Ready-made trading system.
MQLTrend
Mohammad Reza Aghaei
This tool helps you to control the situation at other times and include them in your trades when analyzing the market  This tool scans the market and reports the movement of the market at different times With the help of this tool, you can prevent many wrong analyzes With the help of this tool, you can have an overview of the market in the shortest time and save your time
FREE
OVERVIEW The Vector Candle Zones Render indicator automatically renders boxes for vector candle zones that are yet to be recovered. The indicator is an implementation of an existing PVA candles indicator. Combine it with PVSRA and MarketMakerMethod strategy. FEATURES Software: MetaTrader4 - MT4 - 600+ build Timeframes: Multi-Timeframe Markets: Forex/Cryptos/Energies/Bonds/Metals/Indices/Futures/Commodities Customizable style parameters: Change Color style Chan
MT Scanner
Niravkumar Maganbhai Patel
4 (3)
This indicator helps you to Scan symbols which are in the Market Watch Window  and filter out trends with alerts. It works based on the effective indicator "SUPERTREND" which is used by many traders for trading: When box color changes to " Green " or " Red " color, it indicates you for trend change for long and short entry. And also you will get alerted on screen. When it changes to " Green ", it indicates you that trend is going upwards, and you can take the long entry. If the color changes to
FREE
Trend Star
Ivan Simonika
5 (1)
The indicator ignores sharp fluctuations and market noise and tracks market trends with absolute reliability. It is suitable for trading on small timeframes and on large ones, it ignores sudden price spikes or price movement corrections due to the reduction of market noise around the average price value. For calculations, the indicator uses indicators: iLow, iHigh, iMA, iATR. Since the output signal relies on reliable indicators, it is also reliable. You can configure both a sound signal and se
Extremum Reverse Bar
Yurij Izyumov
3.55 (11)
This indicator has been created for finding the probable reversal points of the symbol price. A small candlestick reversal pattern is used it its operation in conjunction with a filter of extremums. The indicator is not redrawn! If the extremum filter is disabled, the indicator shows all points that have a pattern. If the extremum filter is enabled, the condition works – if the history Previous bars 1 candles back contains higher candles and they are farther than the Previous bars 2 candle, such
FREE
Unveil the Secret to Trading with Joker's TrendMaster!  Ready to outperform the markets with a proven and reliable strategy? Look no further! Introducing Joker's TrendMaster, the revolutionary indicator crafted by Yuri Congia! With Joker's TrendMaster, you'll gain access to a powerful combination of advanced technical analysis and unique strategic insights. Limited-time Special Opportunity: Seize the moment! Be among the first 10 (Purchasing 1/10) to seize this unique opportunity, and not
FREE
Lisek Stochastic
Darius Hans Lischka
3 (7)
Lisek Stochastic   oscillator indicator with Alarm, Push Notifications and e-mail  Notifications. The Stochastic indicator is a momentum indicator that shows you how strong or weak the current trend is. It helps you identify overbought and oversold market conditions within a trend. The Stochastic indicator is lagging indicator, which means it don't predict where price is going, it is only providing data on where price has been !!! How to trade with Stochastic indicator: Trend following: As lon
FREE
Real Channel
Vitalii Zakharuk
The key difference between the Real Channel indicator and other channel indicators (for example, from the same Bollinger) is that the Real Channel takes into account not simple moving averages, but twice smoothed ones, which, on the one hand, makes it possible to more clearly determine the market movement, and on the other hand makes the indicator less sensitive. Real Channel is a non-redrawing channel indicator based on moving averages.
Super trend is one of the best trend indicators in metatrader 4 (MT4). Triple SuperTrend indicator is an indicator that consist of three super trend indicator that can be aranged. This indicator is built by mql4 language and doesn't provided by MT4 platform. Highly recommended using EMA SuperTrend Strategy Indicator if you want to get better result in here: https://www.mql5.com/en/market/product/91664 This indicator is easy to use, power full and has many benefits, there are: Using three ind
FREE
TrendPlus
Sivakumar Subbaiya
4.21 (14)
Trend Plus   Trendplus  Indicator   Time Frame: Suitable for any time frame.  Purpose: Trend Prediction. Blue and red candle indicate the buy and sell call respectively. Buy: When the blue candle is formed buy call is initiated. close the buy trades when the next red candle will formed.   Sell: When the Red candle is formed Sell call is initiated. close the Sell trades when the next blue candle will formed.   Happy trade!!
FREE
Ska ZigZag BuySell
NKATEKO VUKOSI LEROY MASANGO
Ska ZigZag BuySell indicator determines the overbought and oversold regions within a trend. The indicator determines the overbought region by the candlestick high and the oversold region by the candlestick low. This indicator only gives signals with arrow and audible alerts each and every time when a new candlestick appear. To utilize the full strategy i recommend using "Ska ZigZag BuySell" together with "Ska ZigZag Line". The Ska ZigZag Line indicator is available for free. NOTE: Indicator is h
Elephant Candle
David Leander Tschacher
The Elephant Candle is an indicator for MT4. It draws arrows when strong bullish or bearish candles appear. Strong candles frequently initiate a new trend. The arrows can be used in expert advisors. This indicator can improve already existing trading strategies. The indicator is very fast and doesn't repaint. Inputs Period Candle Multiplier Candle Niceness [%] Arrow Size Enable Alert Enable Push Notification Enable Email
Doonchian
Andriy Sydoruk
The Doonchian channel consists of two channel displays. Channel lines are determined by a simple and reliable algorithm. The channel is preferably used for trading inside the channel. The indicator does not redraw and does not lag; simple algorithms are the basis of the work. It works on all currency pairs and on all timeframes. As always a warning, we must not forget that the approach must be comprehensive, the indicator signals require additional information to enter the market.
The indicator trades during horizontal channel breakthroughs. It searches for prices exceeding extreme points or bouncing back, monitors night flat and defines targets using customizable Fibo levels with a sound alert, which can be disabled if necessary. The indicator allows you to create a horizontal channel between the necessary extreme points in visual mode quickly and easily. It automatically applies your selected Fibo levels to these extreme points (if the appropriate option is enabled in t
The Sentiment Ratio indicator gauges current Market Sentiment between -100% and 100%, where lower than -40% is considered Bearish and higher than 40% is Bullish. The channel between the two is considered Neutral. The indicator has been a very useful filter tool for signals within a trading system. Example call function:  int SentimentIndicator(double triggerLevel)//Return sentiment if trigger level is activated {   double sentimentRatio=iCustom(NULL,0,"Sentiment Ratio",0,0,0);   if(sentimentRa
FREE
Smart Channel is a non-redrawing channel indicator based on moving averages. The indicator is used to identify trends in financial markets and indicates the direction of price movement. Smart Channel, in fact, is a miniature trading strategy, since, regardless of the construction methods, it uses the tactics of rebounding from the boundaries of the built channel, and the boundaries themselves are used as guidelines for the correct placement of stop loss and take profit orders. The key diffe
Drawing Pack
John Louis Fernando Diamante
4 (1)
This indicator provides several drawing tools to assist in various methods of chart analysis. The drawings will keep their proportions (according to their handle trendline) across different chart scales, update in real time, and multiple drawings are supported. # Drawing Option Description  1 Grid box draggable boxed grid, user defines rows x colums, diagonal ray option  2 Grid partial or fullscreen grid, sized by handle line  3 Grid flex a diagonal grid, sized and sloped by handle line
This indicator will provide you with everything you need in order to overcome losses due to human emotions. The indicator determines the moments of a trend reversal and the direction of its movements. This development is equipped with the most modern, adaptable trading algorithms. The main secret of short-term trading is to have information on when to enter a deal. The indicator works great on all timeframes and informs the trader about the most successful moments of buying or selling a currency
Free automatic Fibonacci is an indicator that automatically plots a Fibonacci retracement based on the number of bars you select on the BarsToScan setting in the indicator. The Fibonacci is automatically updated in real time as new highest and lowest values appears amongst the selected bars. You can select which level values to be displayed in the indicator settings. You can also select the color of the levels thus enabling the trader to be able to attach the indicator several times with differe
FREE
The indicator is a set of parameters for setting three moving averages (fast, medium and slow), which can be used to analyze the market. This indicator provides the ability to analyze market trends and make trading decisions based on the intersections of various moving averages. It also supports audio alerts for timely notification of trading signals. LengthFaster: Sets the number of candles used to calculate the faster moving average. A value of 5 means using price data from the last 5 can
T3IndiFast
Ridwan Kureemun
Supporting file (2 of 2) for T3 Cloud MA Trend indicator derived from T3 moving averages. The cloud is bounded by a fast T3 and slow T3 lines. Buying/Selling opportunities above/below cloud. The fast and slow T3 MA lines can also be used as dynamic support/resistance for more aggressive entries. Use default values for best settings. The number of look back bars is user defined. This indicator can be used in combination with other strategies such as price action. Suitable for all time frames. P
FREE
T3IndiSlow
Ridwan Kureemun
Supporting file (1 of 2) for T3 Cloud MA Trend indicator derived from T3 moving averages. The cloud is bounded by a fast T3 and slow T3 lines. Buying/Selling opportunities above/below cloud. The fast and slow T3 MA lines can also be used as dynamic support/resistance for more aggressive entries. Use default values for best settings. The number of look back bars is user defined. This indicator can be used in combination with other strategies such as price action. Suitable for all time frames. P
FREE
SpectorChart
Sergii Krasnyi
5 (1)
Este indicador cambia continuamente el color de los bordes y cuerpos de las velas, así como el color de los volúmenes en tiempo real. El indicador es fácil de usar. La paleta de colores es variada. Este producto es una solución gráfica, por lo que es difícil describir lo que hace mediante texto, es más fácil verlo descargándolo, además el producto es gratuito. El indicador es adecuado para los bloggers que quieren crear una hermosa imagen de un gráfico para la edición de vídeo o comerciantes qu
FREE
Advanced SSA
Jean Francois Le Bas
SSA stands for 'Singular Spectrum Analysis'. It combines elements of classical time series decomposition, statistics, multivariate geometry, dynamical systems and signal processing. SSA decomposes time series into a sum of components (ETs), with each component representing a lower smoothing, using several SVD (Singular Value Decompositions). It is a powerful filtering process used in many fields of research (climatology, biomedical, aerospace, etc), where high quality forecasting and smoothin
The Icarus Reversals(TM) FREE Indicator is a powerful tool to identify high-probability reversal points, across all instruments.  The Reversals Indicator provides traders and investors with a simple-to-use and highly dynamic insight into points of likely price-action reversals.  Generated by a unique proprietary code-set, the Reversals Indicator (FREE version) generates long and short trade signals, which can be customised for key inputs and colourisation. Settings of the Icarus Reversals FREE h
FREE
Los compradores de este producto también adquieren
Atomic Analyst
Issam Kassas
5 (3)
En primer lugar, vale la pena enfatizar que este Indicador de Trading no repinta, no redibuja y no se retrasa, lo que lo hace ideal tanto para el trading manual como para el automatizado. Manual del usuario: configuraciones, entradas y estrategia. El Analista Atómico es un Indicador de Acción del Precio PA que utiliza la fuerza y el impulso del precio para encontrar una mejor ventaja en el mercado. Equipado con filtros avanzados que ayudan a eliminar ruidos y señales falsas, y aumentan el poten
Scalper Inside PRO
Alexey Minkov
4.75 (59)
An exclusive indicator that utilizes an innovative algorithm to swiftly and accurately determine the market trend. The indicator automatically calculates opening, closing, and profit levels, providing detailed trading statistics. With these features, you can choose the most appropriate trading instrument for the current market conditions. Additionally, you can easily integrate your own arrow indicators into Scalper Inside Pro to quickly evaluate their statistics and profitability. Scalper Inside
TPSpro RFI Levels
Roman Podpora
4.86 (21)
Reversal First Impulse levels (RFI)    INSTRUCTIONS        RUS       -       ENG              R ecommended to use with an indicator   -   TPSpro  TREND PRO -  Version MT5 A key element in trading is zones or levels from which decisions to buy or sell a trading instrument are made. Despite attempts by major players to conceal their presence in the market, they inevitably leave traces. Our task was to learn how to identify these traces and interpret them correctly. Main functions: Displaying activ
Quantum Breakout Indicator PRO
Bogdan Ion Puscasu
4.96 (26)
Introduciendo       Quantum Breakout PRO   , el innovador indicador MQL5 que está transformando la forma en que comercia con Breakout Zones. Desarrollado por un equipo de operadores experimentados con experiencia comercial de más de 13 años,   Quantum Breakout PRO   está diseñado para impulsar su viaje comercial a nuevas alturas con su innovadora y dinámica estrategia de zona de ruptura. El indicador de ruptura cuántica le dará flechas de señal en las zonas de ruptura con 5 zonas objetivo de
GOLD Impulse with Alert
Bernhard Schweigert
4.56 (9)
Este indicador es una super combinación de nuestros 2 productos Advanced Currency IMPULSE with ALERT  +   Currency Strength Exotics . ¡Funciona para todos los marcos de tiempo y muestra gráficamente el impulso de fuerza o debilidad para las 8 divisas principales más un Símbolo! Este Indicador está especializado en mostrar la aceleración de la fuerza de la divisa para cualquier símbolo como Oro, Pares Exóticos, Materias Primas, Índices o Futuros. Es el primero de su clase, cualquier símbol
TPSproTREND PrO
Roman Podpora
4.78 (18)
TPSpro TRENDPRO  - is a trend indicator that automatically analyzes the market and provides information about the trend and each of its changes, as well as giving signals for entering trades without redrawing! The indicator uses each candle, analyzing them separately. referring to different impulses - up or down impulse. Exact entry points into transactions for currencies, crypto, metals, stocks, indices!  -  Version MT5               DETAILED DESCRIPTION                R ecommended to use with
Cycle Sniper
Elmira Memish
4.41 (37)
NEW YEAR SALE PRICE FOR LIMITED TIME!!! Please contact us after your purchase and we will send you the complimentary indicators to complete the system Cycle Sniper is not a holy grail but when you use it in a system which is explained in the videos, you will feel the difference. If you are not willing to focus on the charts designed with Cycle Sniper and other free tools we provide, we recommend not buying this indicator. We recommend watching the videos about the indiactor and system before pu
¡Actualmente 20% OFF ! ¡La mejor solución para cualquier novato o trader experto! Este software funciona con 28 pares de divisas. Se basa en 2 de nuestros principales indicadores (Advanced Currency Strength 28 y Advanced Currency Impulse). Proporciona una gran visión general de todo el mercado de divisas. Muestra los valores de Advanced Currency Strength, la velocidad de movimiento de las divisas y las señales para 28 pares de divisas en todos los (9) marcos temporales. Imagine cómo mejorar
RelicusRoad Pro
Relicus LLC
4.73 (140)
Ahora $ 147 (aumentando a $ 499 después de algunas actualizaciones) - Cuentas ilimitadas (PC o Mac) Manual de usuario de RelicusRoad + Videos de capacitación + Acceso al grupo privado de Discord + Estado VIP UNA NUEVA MANERA DE VER EL MERCADO RelicusRoad es el indicador comercial más poderoso del mundo para divisas, futuros, criptomonedas, acciones e índices, y brinda a los comerciantes toda la información y las herramientas que necesitan para mantenerse rentables. Brindamos análisis téc
Indicator : RealValueIndicator Description : RealValueIndicator is a powerful tool designed specifically for trading on the EURUSD pair. This indicator analyzes all EUR and USD pairs, calculates their real currency strength values, and displays them as a single realistic value to give you a head start on price. This indicator will tell you moves before they happen if you use it right. RealValueIndicator allows you to get a quick and accurate overview of the EURUSD currency pair tops and bottoms,
Introduciendo       Indicador Quantum Trend Sniper   , el innovador indicador MQL5 que está transformando la forma en que identificas y negocias los cambios de tendencia. Desarrollado por un equipo de comerciantes experimentados con experiencia comercial de más de 13 años,       Indicador de francotirador de tendencia cuántica       está diseñado para impulsar su viaje comercial a nuevas alturas con su forma innovadora de identificar cambios de tendencia con una precisión extremadamente alta.
JULY OFFER 80% OFF next price for unlimited version will be 17000$. This is the only time you can get this institutional and professional indicator at this price for unlimited version. Don't dare to miss this. The tool I am about to introduce to you you can't compare it with other tools due to its strategy and accuracy level in predicting the next price directional movement . This tool is designed for serious traders who have decided to make a difference through trading. Be the next person to wi
TrendMaestro
Stefano Frisetti
5 (3)
note: this indicator is for METATRADER4, if you want the version for METATRADER5 this is the link:  https://www.mql5.com/it/market/product/108106 TRENDMAESTRO ver 2.4 TRENDMAESTRO recognizes a new TREND in the bud, he never makes mistakes. The certainty of identifying a new TREND is priceless. DESCRIPTION TRENDMAESTRO identifies a new TREND in the bud, this indicator examines the volatility, volumes and momentum to identify the moment in which there is an explosion of one or more of these data a
FX Volume
Daniel Stein
4.61 (36)
Obtenga su actualización diaria del mercado con detalles y capturas de pantalla a través de nuestro Morning Briefing aquí en mql5 y en Telegram ! FX Volume es el PRIMER y ÚNICO indicador de volumen que proporciona una visión REAL del sentimiento del mercado desde el punto de vista de un bróker. Proporciona una visión impresionante de cómo los participantes institucionales del mercado, como los brokers, están posicionados en el mercado Forex, mucho más rápido que los informes COT. Ver esta info
Currency Strength Exotics
Bernhard Schweigert
4.88 (33)
¡ACTUALMENTE 20% DE DESCUENTO ! ¡La mejor solución para cualquier operador novato o experto! Este indicador está especializado en mostrar la fuerza de la divisa para cualquier símbolo como Pares Exóticos, Materias Primas, Índices o Futuros. Es el primero de su clase, cualquier símbolo se puede añadir a la 9 ª línea para mostrar la verdadera fuerza de la moneda de Oro, Plata, Petróleo, DAX, US30, MXN, TRY, CNH etc. Se trata de una herramienta de trading única, de alta calidad y asequible por
Entry Points Pro
Yury Orlov
4.7 (226)
Este es un genial indicador para MT4 que ofrece señales precisas para entrar en una transacción sin redibujar. Se puede aplicar a cualquier activo financiero: fórex, criptomonedas, metales, acciones, índices. Nos dará valoraciones bastante precisas y nos dirá cuándo es mejor abrir y cerra una transacción. Eche un vistazo  al vídeo  (6:22), ¡contiene un ejemplo de procesamiento de una sola señal que ha amortizado el indicador! La mayoría de los tráders mejoran sus resultados comerciales durante l
AT Forex Indicator MT4
Marzena Maria Szmit
5 (2)
The AT Forex Indicator MT4 is a sophisticated trading tool designed to provide traders with a comprehensive analysis of multiple currency pairs. This   powerful indicator   simplifies the complex nature of the forex market, making it accessible for both novice and experienced traders. AT Forex Indicator uses   advanced algorithms   to detect trends, patterns and is an essential tool for traders aiming to enhance their forex trading performance. With its robust features, ease of use, and reliabl
NAM Order Blocks
NAM TECH GROUP, CORP.
5 (1)
Indicador de detección de Order Blocks multitimeframe para MT4. Características - Panel de control totalmente personalizable, proporciona una interacción completa. - Oculta y muestra el panel de control donde quieras. - Detecta OB en múltiples marcos de tiempo. - Permite seleccionar la cantidad de OB para mostrar. - Interfaz de usuario de diferentes OBs. - Diferentes filtros de OBs (regulares, rejection y sin capitalizar). - Alerta de proximidad de OBs. - Líneas ADR High y Low. - Servicio de not
MTF Supply Demand Zones
Georgios Kalomoiropoulos
4.83 (23)
Próxima generación de zonas de oferta y demanda automatizadas. Algoritmo nuevo e innovador que funciona en cualquier gráfico. Todas las zonas se crean dinámicamente de acuerdo con la acción del precio del mercado. DOS TIPOS DE ALERTAS --> 1)CUANDO EL PRECIO LLEGA A UNA ZONA 2)CUANDO SE FORMA UNA NUEVA ZONA No obtienes un indicador inútil más. Obtiene una estrategia comercial completa con resultados probados.     Nuevas características:     Alertas cuando el precio llega a la z
ZeusArrow Smart Liquidity Finder  Smart Liquidity Finder is Ai controlled indicator based on the Idea of Your SL is My Entry. It scan and draws the major Liquidity areas on chart partitioning them with Premium and Discount Zone and allows you find the best possible trading setups and help you decide the perfect entry price to avoid getting your Stop Loss hunted . Now no more confusion about when to enter and where to enter. Benefit from this one of it's kind trading tool powered by Ai an trade
Welcome to the world of SMC (Smart Money Concepts) Trading, where we empower traders with the tools and knowledge to make smarter trading decisions. Our latest addition to our suite of trading tools is the SMC Trading Pro indicator, version 1.0. Key Features: Major Market Structure Identification with BODY break. Order Block must be in Major Swing ( not Small Swing ). Order Block with Fair Value Gap Detection. Order Block in Discount | Premium zone. Filter for only Bullish, Bearish or All Order
¡¡ACTUALMENTE 26% DE DESCUENTO !! Este indicador es una super combinación de nuestros dos indicadores principales ( Advanced Currency Strength 28   &  Advanced Currency IMPULSE with ALERT ). Muestra los valores de la Fuerza de la Divisa para TICK-UNIDADES y señales de alerta para 28 pares de divisas. Se pueden utilizar 11 Tick-Units diferentes. Son 1, 2, 3, 4, 5, 6, 10, 12, 15, 20 y 30 segundos. La barra de Tick-Unit en la sub-ventana se mostrará y se desplazará hacia la izquierda cuando haya
This indicator uses support and resistance, volume and some special formula to calculate the volume to filter the candles. If the volume reaches a specific value, And at the same time, Candle breaks the support/resistance line, There would be a signal and we can enter the market. Signals appear when the current candle closes. then you can enter the trade when a new candle appears. Please don't forget to follow your money management plan. MT5 Version Support/Resistance Breakout MT5 :   https:
Volume by Price MT4
Brian Collard
4.71 (14)
The Volumebyprice.com Indicator for MetaTrader 4 features Volume Profile and Market Profile TPO (Time Price Opportunity). Volume and TPO histogram bar and line charts. Volume Footprint charts. TPO letter and block marker collapsed and split structure charts. Static, dynamic and flexible range segmentation and compositing methods with relative and absolute visualizations. Session hours filtering and segment concatenation with Market Watch and custom user specifications. Graphical layering, posit
FxBears Powers
Rachid Lafhil
3 (2)
️️ Attention:      The price will soon be raised to what it was before ($500).      No more losses with this indicator, test it for years ago and see if there is losses in one day results. but before testing it please see the explaining video down here.    FxBears Powers is working on all forex pairs, metals, commodities, futures, indices, energies, crypto, and everything...and on all timeframes from M1 to MN.   It's based on supply and demand zones, price action, and some internal indicators,
EZT Trend
Tibor Rituper
4 (1)
El indicador de tendencia EZT le mostrará la tendencia, el retroceso y las oportunidades de entrada. Se encuentran disponibles filtrado opcional y todo tipo de alertas. Se agregan alertas por correo electrónico y notificaciones automáticas. También estamos desarrollando un EA basado en este indicador, que estará disponible pronto. Es un indicador multifuncional que consta de dos histogramas de color y una línea. Es una representación visual de la dirección y la fuerza de una tendencia; tambié
30% DISCOUNT ! DISCOUNT ! DISCOUNT ONLY FOR 5 USERS at125$ valid for 1 day only.Grab it The PERFECT TREND HIT creates   BUY and SELL  perfect trend   arrow signals based on ADX EMA AND RSI And all filters inbuilt with accurate trend entries. Furthermore, the indicator and template display the trend direction, strength, and trade recommendation for independent price charts. ROCK WITH THE TREND Moreover, it shows the final trade recommendation to BUY or SELL with all filters and displays that info
A. ¿Qué es A2SR ?   * Es un indicador técnico líder (sin repintado, sin retraso). -- Guía : -- en https://www.mql5.com/en/blogs/post/734748/page4#comment_16532516 -- y https://www.mql5.com/en/users/yohana/blog A2SR tiene una técnica especial para determinar los niveles de Soporte (demanda) y Resistencia (oferta). A diferencia de la forma ordinaria que vimos en la red, A2SR tiene un concepto original para determinar los niveles reales de SR. La técnica original no se tomó de Internet y tampoco
Gold Channel is a volatility-based indicator, developed with a specific timing algorithm for the XAUUSD pair, which consists of finding possible corrections in the market. This indicator shows two outer lines, an inner line (retracement line) and an arrow sign, where the theory of the channel is to help identify overbought and oversold conditions in the market. The market price will generally fall between the boundaries of the channel. If prices touch or move outside the channel it is a tra
Enigmera
Ivan Stefanov
5 (4)
ENIGMERA: El núcleo del mercado https://www.enigmera.com Introducción Este indicador y sistema de negociación es un enfoque extraordinario de los mercados financieros. ENIGMERA utiliza los ciclos fractales para calcular con precisión los niveles de soporte y resistencia. Muestra la auténtica fase de acumulación y proporciona dirección y objetivos.  Un sistema que funciona tanto si estamos en una tendencia como en una corrección.  ¿Cómo funciona? ENIGMERA consta de tres líneas: la línea de s
Otros productos de este autor
BullsEye Signal NoRepaint
Martin Alejandro Bamonte
BullseyeSignal –NoRepaint es una señal que, como su nombre lo indica, no repinta nunca, bajo ninguna circunstancia. La señal se emite en la misma vela que se observa en la imagen. Es ideal para mercados con alta volatilidad, como forex, criptomonedas, acciones, indices y futuros. Usted solo verá una flecha verde para comprar y una roja para vender, pero debajo de ellas hay muchos indicadores trabajando conjuntamente para poder brindale un trading mas simplificado. Está diseñada específicamente p
Aurum Apex Mt4 EA
Martin Alejandro Bamonte
Descripción de Aurum Apex EA Aurum Apex EA es una herramienta de trading automatizada robusta al 100%, diseñada para la plataforma MT4. Realiza análisis de mercado en tiempo real, detectando diversas oportunidades de trading. Apto para traders de todos los niveles, Aurum Apex EA ofrece tres modos de riesgo, ajustables a través del parámetro de Riesgo: Riesgo = 0.1 (Bajo Riesgo): Ideal para nuevos traders que no están familiarizados con los movimientos del oro. Esta configuración minimiza las so
Indicador NextCandlePredictor NextCandlePredictor, una indicador del tipo señal con alerta que no repinta, no cambia su color, no se mueve, no desaparece y no tiene lag. Te ayudará a identificar la dirección de la próxima o próximas velas en cualquier marco temporal. Es altamente recomendado para mercados de alta volatilidad, como Nueva York, Londres o incluso el solapamiento de ambos. Características Principales: Versatilidad en Timeframes : Proporciona señales rápidas y precisas en cualquie
El indicador MTFMA (Multi-Timeframe Moving Averages) utiliza múltiples medias móviles (MA) en diferentes marcos de tiempo para proporcionar señales de compra y venta (que no repintan) en una ventana separada del gráfico principal. Es versátil y fácil de interpretar, adecuado tanto para scalping en marcos de tiempo pequeños como para trading a más largo plazo en marcos de tiempo mayores. ¿Por qué es Multiframe? El término multiframe se refiere a la capacidad del indicador de utilizar y comb
Scalping Signal NO Repaint NO Lag
Martin Alejandro Bamonte
5 (1)
El "Scalping Signal No Repaint No Lag" es el único indicador en el mercado que, al arrastrarlo a cualquier gráfico, carga automáticamente todos los indicadores necesarios sin necesidad de cargar ningún template ni otros indicadores. Autoconfigura el gráfico para que se vea exactamente como en la imagen proporcionada. Este indicador garantiza señales sin repintado ni retrasos, lo que lo hace ideal para estrategias de scalping en todos los pares y en todos los marcos de tiempo (TF). Funcionalidade
Clear Breakout
Martin Alejandro Bamonte
El indicador "Breakout Buy-Sell" está diseñado para identificar y resaltar posibles oportunidades de compra y venta basadas en rupturas de precios durante diferentes sesiones del mercado (Tokio, Londres y Nueva York). Este indicador ayuda a los traders a visualizar claramente las zonas de compra y venta , así como los niveles de toma de ganancias (TP) y stop loss (SL). Estrategia de Uso El indicador se puede utilizar de la siguiente manera: Configuración Inicial : Selecciona la sesión del merc
GbpUsd Pip Hunter EA
Martin Alejandro Bamonte
Español GBPUSD Pip Hunter EA Características principales: Optimizado para GBPUSD en M15: Diseñado y probado específicamente para el par GBPUSD en un gráfico de 15 minutos. Tamaño mínimo de cuenta recomendado: Requiere un saldo mínimo de $1000 para asegurar bajos drawdowns. Compatibilidad con spreads: Mejor utilizado con cuentas de spread bajo o ECN para maximizar la rentabilidad. Gestión de riesgos: Incluye una opción para desactivar la función de Lote Exponencial configurándola en 1.0, según tu
El indicador "MultiSymbol & TF Chart Integrated" está diseñado para proporcionar una visión completa del mercado rápidamente, permitiéndote monitorear hasta 60 pares de divisas en los marcos de tiempo que prefieras en un solo gráfico (modo multiple) o ver el par en el que estamos operando en todos los TF (modo simple). Ventajas Principales : Monitoreo Completo : Permite monitorear en tiempo real y de un vistazo todos los pares deseados en un solo gráfico. Ahorro de Tiempo : Evita la necesida
Pairs and TF Changer
Martin Alejandro Bamonte
¿Estás cansado de cambiar entre múltiples gráficos para monitorear diferentes pares de divisas y marcos de tiempo? ¡El indicador Pairs and TF Changer está aquí para revolucionar tu experiencia de trading! Una vez que hayas cargado todos los indicadores para tu estrategia, agrega Pairs and TF Changer al gráfico. Si es necesario, puedes ajustar su posición, colores o el número de columnas que muestra. Características principales: Integración sin interrupciones: Integra este indicador en tu estrate
Filtro:
No hay comentarios
Respuesta al comentario