• Información general
  • Comentarios
  • Discusión
  • Novedades

IQ FX Gann Levels MT5

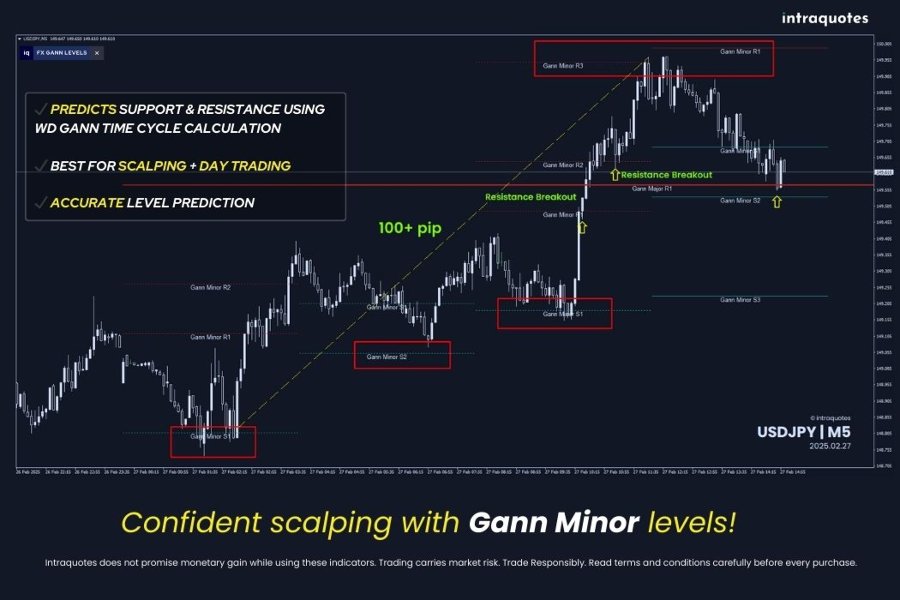
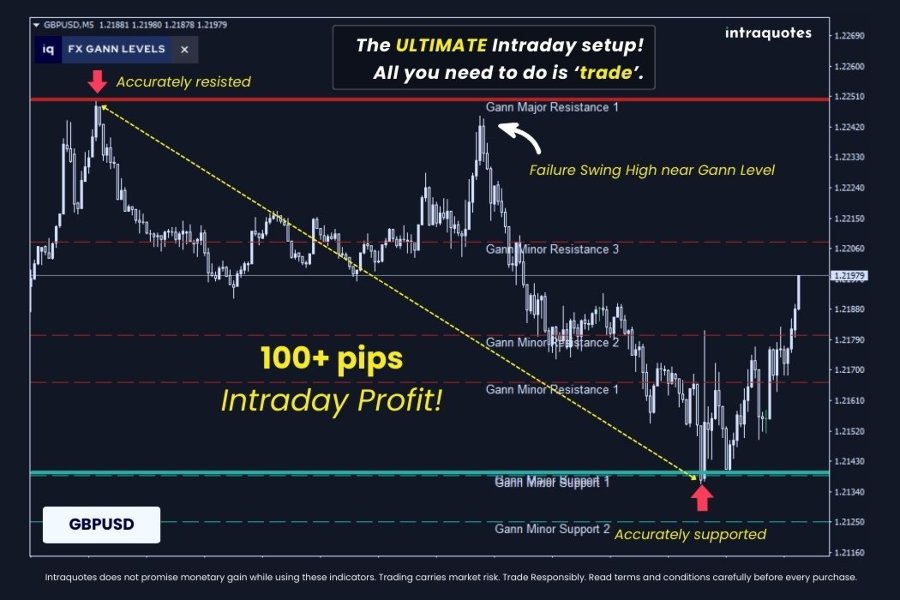
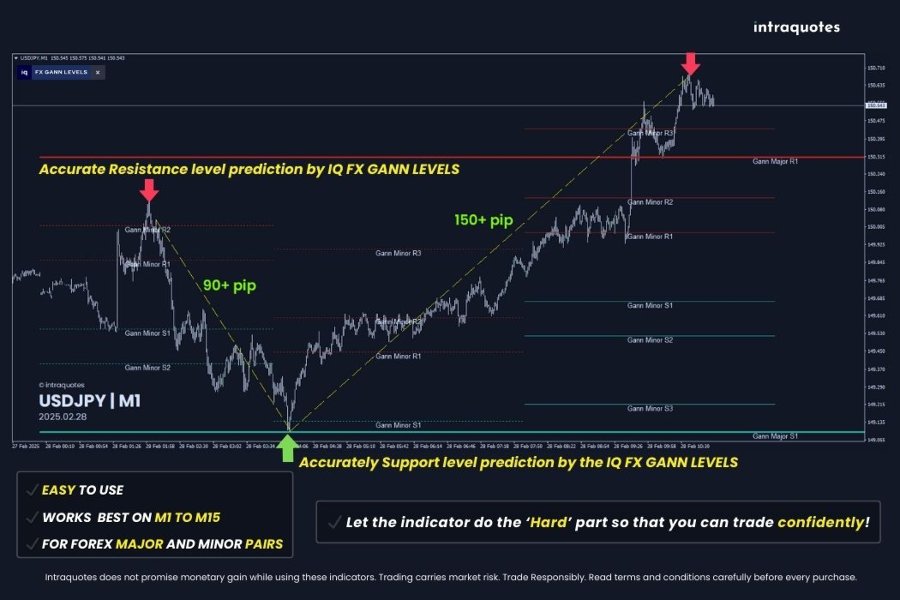
IQ FX Gann Levels a precision trading indicator based on W.D. Gann’s square root methods. It plots real-time, non-repainting support and resistance levels to help traders confidently spot intraday and scalping opportunities with high accuracy. William Delbert Gann (W.D. Gann) was an exceptional market analyst, whose trading technique was based on a complex blend of mathematics, geometry, astrology, and ancient mathematics which proved to be extremely accurate.

Read the product description carefully before purchasing the product. 

Disclaimer:

  • Due to regulatory restrictions, our service is unavailable in certain countries such as India, Pakistan, and Bangladesh.
  • Our products are available only on mql5.com.
  • We never contact anyone or sell our products privately.
  • We do not provide any personal trading advice.
  • We do not sell any of the Intraquotes products on Telegram or any other platform or website.

A Note from the Developer to all the Traders
Over 15+ years of my journey with WD Gann (William Delbert Gann) Theory, filled with research and countless hours poring over hundreds of resources, I have made a pivotal discovery: a formula within W.D. Gann's works that became the foundation of this IQ FX GANN LEVELS indicator. In recognition of the MQL5 silver award and decades of coding experience, I have put in my best effort to create a highly optimized indicator for all traders. Hope you enjoy it.

Quick Overview
As a trader, foresight is everything. Unlike many Gann indicators out there, this one stands apart—it plots Gann support and resistance levels in advance and never repaints. What you see is what you get—reliable, real-time market insights that you can trust. The accuracy of these levels is exceptional, allowing you to create a well-structured day trading plan, knowing exactly where key market movements are likely to occur. It helps you make well-informed trading decisions with complete confidence.


Note: The indicator is Prop firm-ready. Perfect for day trading. This indicator is compatible with the Hydra Trend Rider, and can be used together on the same chart for an optimal trading setup.

1. Why IQ FX GANN Levels Indicator Is Extremely Useful?

  • Suitable for both Scalping & Intraday Trading:
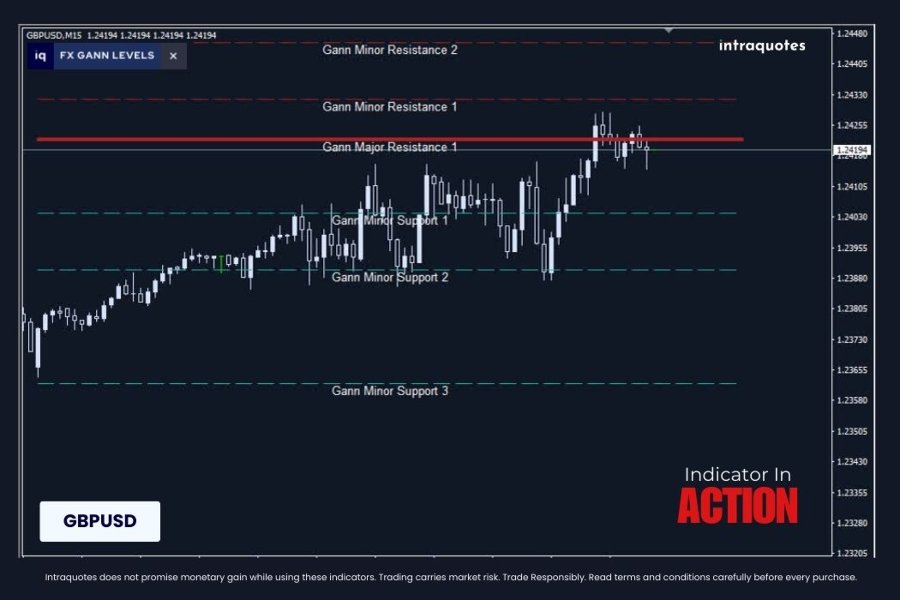
    The indicator plots accurate Gann Support & Resistance levels using the Gann square root of nine calculations constantly as the market moves.

  • Spot Opportunities Instantly:
    Experience more precise live signals for real-time decision-making and sweet point entry exit for profitable trades.

  • Cleaner chart with minimalist design:
    Accurate support and resistance lines are automatically plotted directly on your chart when you add the indicator to the chart. No complex settings are required to get started.

  • Simplified Profit Targets:
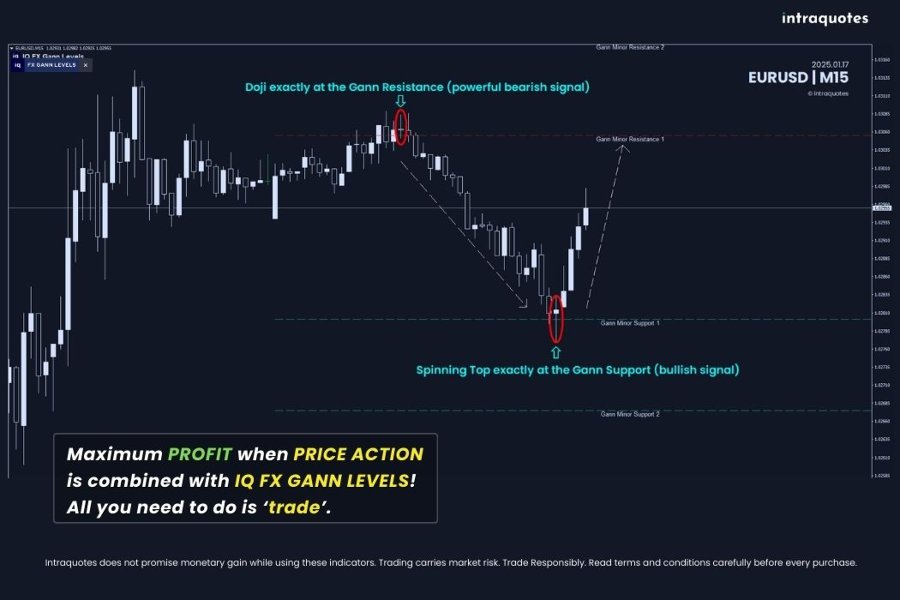
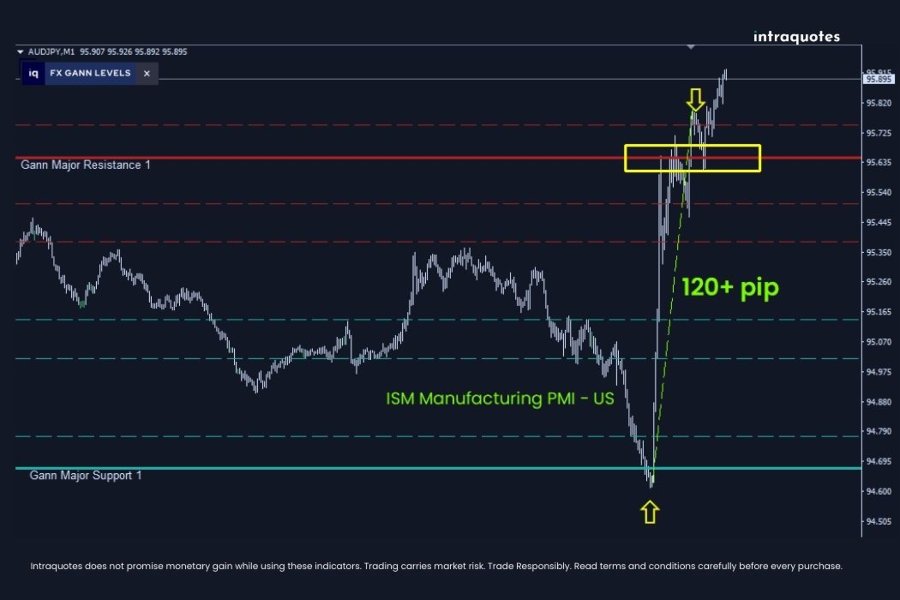
    The Gann Major and minor support/resistance levels make setting take-profit points easier than ever keeping it flexible for you. The Gann levels update as the market moves creating more room to shift your take profit and trail your stop-loss when the trend continues with the moving market.


2. Learn More at intraquotes MQL5 Channel


If you want to learn more about how this indicator works and how you can take profitable trades, follow our intraquotes official MQL5 channel. We post daily market analysis using this indicator to train our traders how to study the chart with this indicator, where to set targets, and how to take profitable trades. We help you build confidence with daily market analysis using this indicator so that you can trade confidently.

Subscribe to intraquotes MQL5 channel for daily market updates, analysis, and much more.


3. Who is this indicator for?

This Indicator is for intermediate intraday traders, and prop firm traders, who have basic knowledge of price action and technical analysis. Indicators work like a charm for daily trades across different major and minor pairs! IQ FX Gann levels can help you make sweet point entries with low stop loss and high take profit (better R/R ratio).

4. List of Supported Symbols

The indicator has been designed to work with high precision on the following 28th major and minor pairs:
  • AUDCAD, AUDCHF, AUDJPY, AUDNZD, AUDUSD.

  • CADCHF, CADJPY, CHFJPY.

  • EURCAD, EURCHF, EURGBP, EURJPY, EURAUD, EURNZD, EURUSD.

  • GBPAUD, GBPCAD, GBPCHF, GBPJPY, GBPNZD, GBPUSD.

  • NZDCAD, NZDCHF, NZDJPY, NZDUSD.

  • USDCAD, USDCHF, USDJPY.


5. Recommended Timeframes:

  • 5-minute chart.

6. How to Get Started with IQ FX GANN LEVELS?

  1. After purchasing, open MetaTrader Software, login to your account, and open Toolbox - Market - Purchased.

  2. Install the indicator.

  3. Open Navigator - Market - Drag & drop the indicator to the chart.

  4. Follow the Gann levels for confident trading. 

7. How do IQ FX Gann Levels Work? (Quick Explanation)

Indicator Plots two types of forecasted Gann Levels
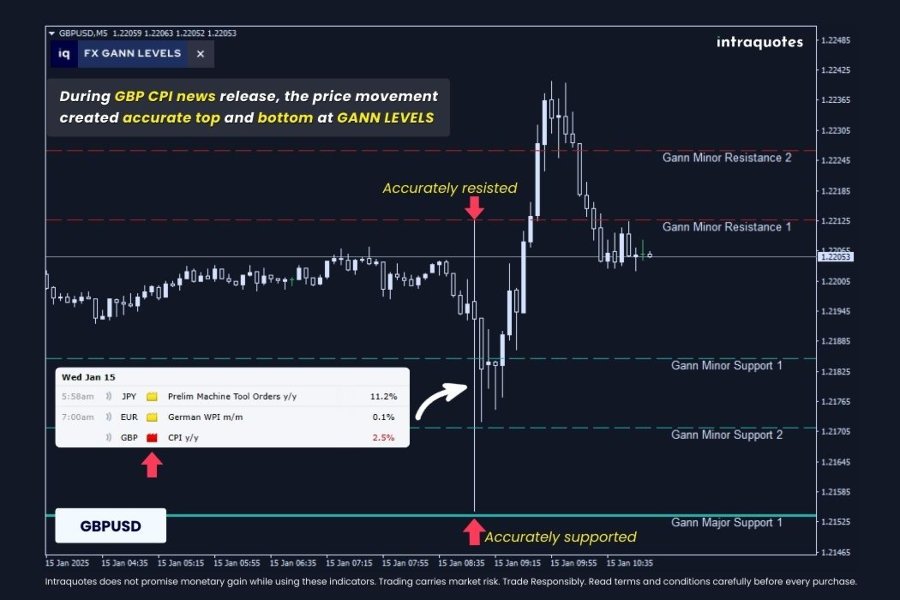
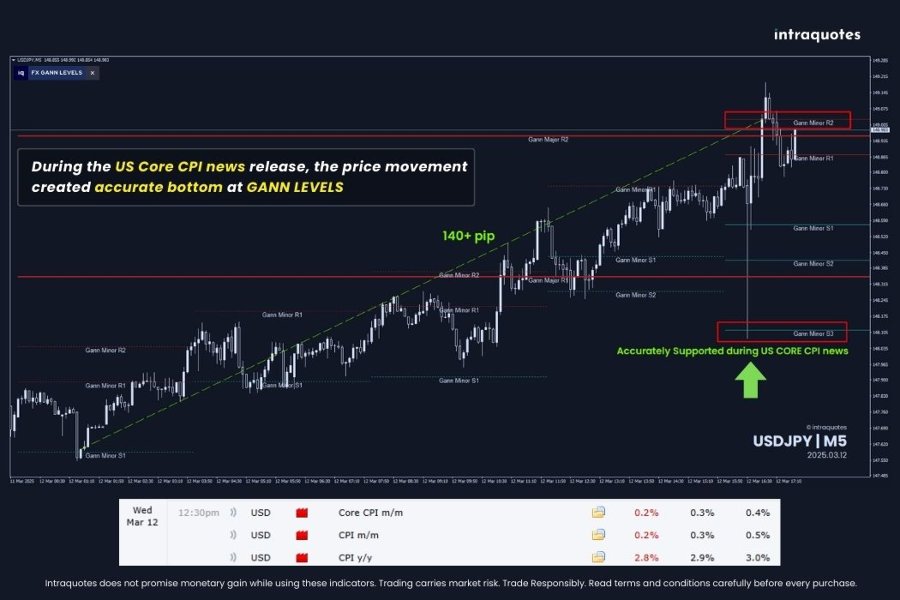
• Major Support/Resistance levels and Minor Support/Resistance Levels where the market reacts accurately. Major levels help in Intraday trading, whereas minor levels help in scalping.

Display Past Gann Levels
• As the market moves with the passing time, the indicator displays past Gann levels of the current day. These past levels help you see exactly where the market reacted proving the Gann levels’ accuracy throughout the day and help you plan your strategy accordingly.

Updating Gann Levels
• The indicator continuously updates all the Gann levels based on complex Gann calculations for precise level plotting.

Confident Trading
• This powerful Gann indicator gives you a clear edge by helping you anticipate potential day highs and lows precisely with Gann Support/Resistance Levels with no extra calculation from your side.


8. Compatible Trading Styles

  • Trend following
  • Breakout
  • Continuation 
  • Trend reversal

9. Indicator Settings

Customize IQ FX GANN LEVELS as per your preference

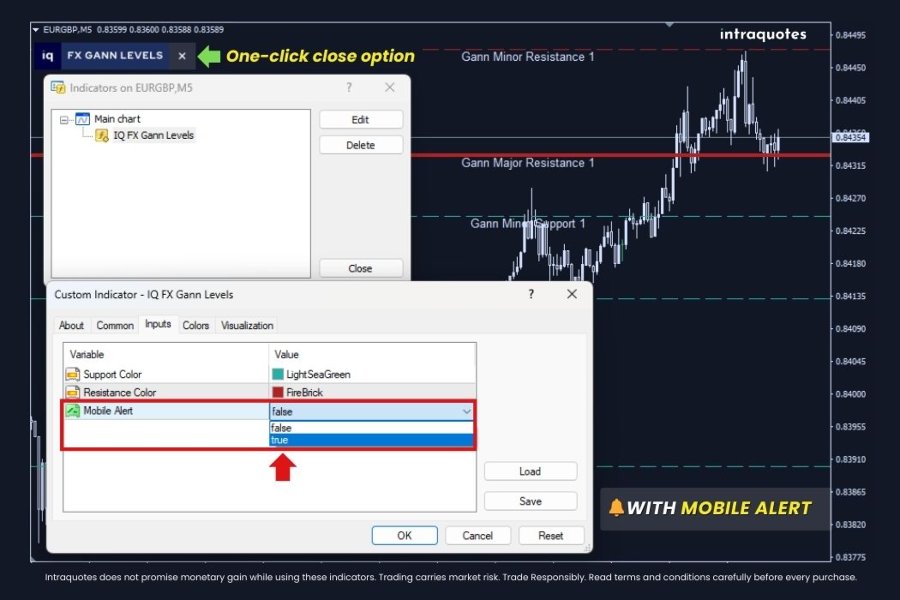
  • Option to change Gann Support Levels Color.

  • Option to change Gann Resistance Level Color.
    (Custom color option was designed keeping in mind individual trader’s preference for dark theme/light theme background)

  • Option to display or hide Gann Minor Levels (True/False).
    (Designed keeping in mind Intraday traders' preference)

  • Option to Enable/Disable Mobile Alert (True/False).
    (Every time the market touches the Major Gann Level, you will be notified if you've enabled the Mobile Alert Option, watch the video for more details).

10. Note for Mobile Alert
To receive mobile alerts for this indicator, enable push notifications in MetaTrader 4 by pressing Ctrl + O (or accessing Options) and navigating to the Notifications tab. Enter your MetaQuotes ID from the MetaTrader app on your mobile device to link it with your platform. Once connected, test the setup to ensure alerts are working. If you face any issues, contact our support team for assistance.

11. FAQ

Q: Does it repaint?
A: Never!

Q: Is there any trial option available?
A: Yes! You can download the demo and backtest.

12. Indicator Troubleshooting

The user guide which you will receive after purchasing the indicator covers all the topics comprehensively. Contact us after you purchase the indicator successfully.

13. Support & Updates:

  • For assistance, send us a direct message on MQL5.

  • Follow our channel for updates and market insights.

  • If you encounter any technical issues with the indicator, contact us directly on MQL5.


Mastering a strategy with this indicator means no second-guessing—just clear intraday levels that set you up for long-term success. Stay disciplined, trade smart, and let the market come to you. Good Luck!

Risk Disclosure:

Trading financial markets carries inherent risks and may not be suitable for every investor. This indicator is designed as a tool to assist in trading decisions but does not guarantee profits or prevent losses, which could exceed your initial investment. Past performance is not a reliable indicator of future outcomes. Users are encouraged to fully understand the risks and seek independent financial advice if needed. Any trading decisions made using this indicator are at the user's discretion and responsibility.

Related topic: WD Gann, trend, trade levels, support, resistance, market movement, intraday levels, intraday trading, scalping, hedging, etc.
Productos recomendados
Advance Entry Levels
Kundan Kumar Srivastava
Introducing Your Ultimate Trading Edge: Dynamic Support & Resistance, Advance Entry Levels Indicator for MT5 platform Unlock the power of precision trading with our cutting-edge Dynamic Support & Resistance Indicator. Designed to give traders unparalleled clarity, this indicator is your roadmap to identifying exactly where to buy and sell, maximizing your potential for consistent, sustainable profits. Why Choose Our Indicator? Crystal Clear Entry and Exit Points : No more guesswork. Our indicat
Limitless MT5
Dmitriy Kashevich
Limitless MT5 is a universal indicator suitable for every beginner and experienced trader. works on all currency pairs, cryptocurrencies, raw stocks Limitless MT5 - already configured and does not require additional configuration And now the main thing Why Limitless MT5? 1 complete lack of redrawing 2 two years of testing by the best specialists in trading 3 the accuracy of correct signals exceeds 80% 4 performed well in trading during news releases Trading rules 1 buy signal - the ap
KT Pin Bar MT5
KEENBASE SOFTWARE SOLUTIONS
KT Pin Bar identifies the pin bar formation which is a type of price action pattern which depicts a sign of reversal or rejection of the trend. When combined with support and resistance, BRN and other significant levels, Pin Bar pattern proved to be a very strong sign of reversal. Basically, a pin bar is characterized by a small body relative to the bar length which is closed either in upper or lower 50% part of its length. They have very large wicks and small candle body. A pin bar candlestic
ACB Breakout Arrows MT5
KEENBASE SOFTWARE SOLUTIONS
5 (1)
The ACB Breakout Arrows indicator provides a crucial entry signal in the market by detecting a special breakout pattern. The indicator constantly scans the chart for a settling momentum in one direction and provide the accurate entry signal right before the major move. Get multi-symbol and multi-timeframe scanner from here - Scanner for ACB Breakout Arrows MT 5 Key features Stoploss   and Take Profit levels are provided by the indicator. Comes with a MTF Scanner dashboard which tracks the brea
Se trata de una estrategia tendencial, que busca explotar esta característica que ofrecen algunos activos de fuertes tendencias. Se colocan dos posiciones a precio de mercado; una con take profit a una corta distancia y la otra sin take profit. Ambas ordenes tienen stop loss, y cuando la primera alcanza el take profit en la segunda posición se mueve el stop loss a breakeven. Cuando está bien configurado y en los activos que funciona bien genera la mayor parte del tiempo un grafico de beneficio p
Verve ai reversal pro
Sakariya Bhaskar Nitinbhai
**Verve AI** Reversal Pro Indicator Pro – The powerful AI tool that accurately detects market reversals. With precision, it identifies key turning points and highlights crucial support and resistance levels. Whether you're navigating volatile trends or finding the perfect entry or exit, **Verve AI** simplifies complex data into clear, actionable signals. Trade smarter with the most reliable reversal indicator, powered by advanced artificial intelligence.
NIVELES CRITICOS DE RAD Los procesos de Acumulación y Distribución de Volumen generan los soportes y resistencias naturales del mercado.  A medida que estos proceso se generan, los niveles en los que el volumen relevante se posiciona se convierten en zonas de difíciles de franquear al alza o a la baja. El indicador RAD,   rastrea el Volumen Relevante en tiempo real, identificando los  procesos de acumulación y distribución, graficándolos como  zonas de SOPORTE o RESISTENCIA.  Mediante el uso de
Introducing Your Ultimate Trading Edge:   Dynamic Support & Resistance, Advance Entry Levels Light Indicator for MT5 platform Unlock the power of precision trading with our cutting-edge Dynamic Support & Resistance Indicator. Designed to give traders unparalleled clarity, this indicator is your roadmap to identifying exactly where to buy and sell, maximizing your potential for consistent, sustainable profits. Why Choose Our Indicator? Crystal Clear Entry and Exit Points : No more guesswork. Our
KT Renko Patterns MT5
KEENBASE SOFTWARE SOLUTIONS
KT Renko Patterns analiza el gráfico Renko ladrillo por ladrillo para encontrar patrones gráficos populares que son ampliamente utilizados por los traders en diferentes mercados financieros. En comparación con los gráficos basados en tiempo, los patrones son más fáciles de identificar en los gráficos Renko debido a su aspecto limpio y sin ruido. KT Renko Patterns incluye múltiples patrones Renko, muchos de los cuales están explicados en detalle en el libro “Profitable Trading with Renko Charts
Introduction to X3 Chart Pattern Scanner X3 Cherart Pattern Scanner is the non-repainting and non-lagging indicator detecting X3 chart patterns including Harmonic pattern, Elliott Wave pattern, X3 patterns, and Japanese Candlestick patterns. Historical patterns match with signal patterns. Hence, you can readily develop the solid trading strategy in your chart. More importantly, this superb pattern scanner can detect the optimal pattern of its kind. In addition, you can switch on and off individu
My PVSR
Ashok Kumar Singha
My PVSR   is based on All Type of Pivot Points. Use this Indicator to get proper Support / Resistance Zone and Trade accordingly.. Recommendation: Use this Indicator along with my another Indicator --->>> Dr. Trend   <<<--- Click Here ; To get the best output result feel free to contact me ; Best of Luck It can be used for: All Pairs: Forex, Cryptocurrencies, Metals, Stocks, Indices etc. All Timeframe All Brokers All type of Trading Style like Scalping, Swing, Intraday, Short-Term, Long-
Strong Candle Indica el tamaño de cada vela con el valor de texto encima e indica qué vela tiene un cuerpo mayor al especificado en los parámetros en porcentaje, es decir, una vela fuerte (entre Size_Min y Size_Max) con al menos x% de cuerpo. El tamaño de la vela se coloca en el buffer y esa es la indicación de compra o venta, donde: valor > 0 = vela alcista o valor < 0 vela bajista, valor = 0 significa que no hay indicación (la vela no coincide con el patrón deseado)
Este es posiblemente el indicador de reconocimiento automático de formación de precios más completo que puede encontrar para la plataforma MetaTrader. Detecta 19 patrones diferentes, toma las proyecciones de Fibonacci tan en serio como usted, muestra la zona de reversión potencial (PRZ) y encuentra niveles adecuados de stop-loss y take-profit. [ Guía de instalación | Guía de actualización | Solución de problemas | FAQ | Todos los productos ] Detecta 19 formaciones de precios armónicos diferen
The Expert Advisor and the video are attached in the Discussion tab . The robot applies only one order and strictly follows the signals to evaluate the indicator efficiency. Pan PrizMA CD Phase is an option based on the Pan PrizMA indicator. Details (in Russian). Averaging by a quadric-quartic polynomial increases the smoothness of lines, adds momentum and rhythm. Extrapolation by the sinusoid function near a constant allows adjusting the delay or lead of signals. The value of the phase - wave s
El indicador KT Asian Breakout analiza una parte clave de la sesión asiática para generar señales de compra y venta en ambas direcciones, basadas en la ruptura del precio. Se genera una señal de compra cuando el precio rompe por encima del máximo de la sesión y una señal de venta cuando el precio rompe por debajo del mínimo de la sesión. Cosas a tener en cuenta Si la caja de la sesión es demasiado ancha verticalmente, se recomienda evitar nuevas operaciones, ya que la mayor parte de la acción d
Naked Forex Kangaroo Tail Indicator Kangaroo Tail Indicator is a pattern recognition indicator for Forex, Stocks, Indices, Futures, Commodities and Cryptos. The Kangaroo Tail is a multi-bar pattern. The Kangaroo Tail pattern is very effective and is very simple to trade. The strategy that comes with the Kangaroo Tail is based on price action. The indicator does what it was designed for: displaying Kangaroo Tail patterns.   Don't expect to follow the up and down arrows and make money . Tradin
WAPV adh Supply and Demand Forex
Eduardo Da Costa Custodio Santos
El indicador de Forex de oferta y demanda WAPV ADH es parte de un conjunto de indicadores llamado (Wyckoff Academy Wave Market) El indicador de oferta y demanda de divisas WAPV ADH para MT5 tiene como objetivo identificar el lado ganador entre compradores y vendedores. Su lectura es muy sencilla, cuando la línea verde está por encima de la línea roja manda la demanda , cuando la línea roja está por encima de la línea verde manda la oferta . Cuanto más positivas sean las líneas verde y roja, mayo
MarketMagnet
Kelly Adediran Raymond
Are you ready to take your trading journey to new heights? Look no further than MarketMagnet, this groundbreaking indicator designed to propel your trading success with excitement and accuracy. Powered by the convergence of Momentum and CCI (Commodity Channel Index), MarketMagnet equips traders with the ultimate tool to determine direction and entry prices for a wide range of recommended currency pairs and instruments. It is designed for traders seeking to scalp for a few pips on lower timeframe
WanaScalper
Isaac Wanasolo
1 (1)
A scalping indicator based on mathematical patterns, which on average gives signals with relatively small SL, and also occasionally helps to catch big moves in the markets (more information in the video) This indicator has three main types of notifications: The first type warns of a possible/upcoming signal on the next bar The second type indicates the presence of a ready signal to enter the market/open a position The third type is for SL and TP levels - you will be notified every time price re
Make Sure to Read the Description! UT Bot Plus contains free EA! The EA can be downloaded from telegram channel:  https://t.me/ +NSOJTvH39fNhZmU0 Unlock the Power of Automated Trading with UT BOT Indicator, Integrated with a FREE EA! ( Limited time offer ) This version has been expanded to include multiple additional filtering options. These options are fully configurable and can be switched on and off. This versatile UT BOT indicator is crafted and optimized to work seamlessly with the FRE
This indicator scans the 1-3 Trendline pattern . The indicator is a 100 % non repaint low risk breakout system . The patterns are formed around swing high and swing lows which make them a low risk pattern with high reward. PATTERN BACKGROUND The 1-3 Trendline Breakout pattern is formed by four(4) points which are composed of three (3) primary points and the pattern neck. A trendline is always formed by the point 1 and the neck of the pattern . When price breaks out of the trendline formed , it
Looking for reliable levels on a price chart? Already tired of searching for similar indicators? Are the levels not working out as they should? Then this is the indicator for you. Volume Prices Universal is a reliable indicator of horizontal volumes. What does it show? First of all, the main idea of ​​the indicator is to display at which price mark the price has been for the longest time. Thus, the display of price volumes on the price chart is formed. With the help of which you can very simpl
Old School Reversal Zones
Kavita Krishnakumar Ojha
I'll keep it Short and to the point.  Let Your Backtest Results Speak for Themselves. After much deliberation, we’ve decided to release the foundational logic behind our process for public use. This isn’t about changing the way you trade—because we know that’s unique to you. The best ways to enter a position? Those have always been confidential ! What we can share is the first of three essential steps we use before entering any trade. This tool is designed to keep you on the right side of the m
VPU Levels
Andriy Sydoruk
Looking for reliable levels on a price chart? Already tired of searching for similar indicators? Are the levels NOT working out as they should? Then this is the indicator for you. VPU Levels is a more advanced version of the Volume Prices Universal indicator. In this indicator, in addition to the histogram of horizontal volumes, the indicator itself determines the levels from which the user can work. The PeakLevel and Diffraction fields help to adjust the depth of reaction to the histogram and
Higher High Lower Low MT5
KEENBASE SOFTWARE SOLUTIONS
5 (1)
KT Higher High Lower Low marca los siguientes puntos de oscilación con sus respectivos niveles de soporte y resistencia: Higher High: Máximo que es más alto que el máximo anterior. Lower High: Máximo que es más bajo que el máximo anterior. Lower Low: Mínimo que es más bajo que el mínimo anterior.  Higher Low: Mínimo que es más alto que el mínimo anterior.   Características La intensidad de los máximos y mínimos puede ajustarse modificando el número de barras a la izquierda y a la derecha. Propo
Automated Trendlines MT5
Georgios Kalomoiropoulos
Las líneas de tendencia son la herramienta más esencial del análisis técnico en el comercio de divisas. Desafortunadamente, la mayoría de los comerciantes no los dibujan correctamente. El indicador de líneas de tendencia automatizadas es una herramienta profesional para comerciantes serios que lo ayuda a visualizar el movimiento de tendencia de los mercados. Hay dos tipos de Trendlines Bullish Trendlines y Bearish Trendlines. En la tendencia alcista, la línea de tendencia de Forex se dibuja a
ATrend
Zaha Feiz
4.77 (13)
ATREND: Cómo Funciona y Cómo Usarlo #### Cómo Funciona El indicador "ATREND" para la plataforma MT5 está diseñado para proporcionar a los traders señales de compra y venta robustas mediante una combinación de metodologías de análisis técnico. Este indicador utiliza principalmente el Rango Verdadero Promedio (ATR) para medir la volatilidad, junto con algoritmos de detección de tendencias para identificar posibles movimientos del mercado. Deja un mensaje después de la compra y recibe un regalo es
KT Horizontal Lines MT5
KEENBASE SOFTWARE SOLUTIONS
En MetaTrader, trazar múltiples   líneas horizontales   y luego hacer seguimiento de sus respectivos niveles de precio puede ser una tarea tediosa. Este indicador dibuja automáticamente varias líneas horizontales a intervalos iguales para establecer alertas de precio, marcar niveles de soporte y resistencia, y otros fines manuales. Este indicador es ideal para traders de Forex principiantes que buscan oportunidades para obtener ganancias rápidas comprando y vendiendo. Las líneas horizontales pue
The indicator helps the trader in identifying potential liquidity levels. The algorithm used in this indicator checks the behavior of the asset taking into account the price levels, momentum and volume analysis. Features:- Parameters for signal optimization and alerts. Usage:- The levels formed by the indicator can be helpful to traders in identifying potential entries, breakouts or reversals. it can assist traders of technical trading background or even pure price action trading.
Tops and Bottoms Indicator
Josue De Matos Silva
4.67 (6)
Tops & Bottoms Indicator FREE   Tops abd Bottoms:   An effective indicator for your trades The tops and bottoms indicator helps you to find  ascending and descending channel formations with indications of ascending and/or descending tops and bottoms. In addition, it  show possibles  opportunities with a small yellow circle when the indicator encounters an impulse formation. This indicator provide to you  more security and speed in making entry decisions. Also test our FREE advisor indicator:  
FREE
Los compradores de este producto también adquieren
NOTE: CYCLEMAESTRO is distributed only on this website, there are no other distributors. Demo version is for reference only and is not supported. Full versione is perfectly functional and it is supported. CYCLEMAESTRO , the first and only indicator of Cyclic Analysis, useful for giving signals of TRADING, BUY, SELL, STOP LOSS, ADDING. Created on the logic of   Serghei Istrati   and programmed by   Stefano Frisetti ;   CYCLEMAESTRO   is not an indicator like the others, the challenge was to inter
RelicusRoad Pro MT5
Relicus LLC
4.79 (19)
Ahora $ 147 (aumentando a $ 499 después de algunas actualizaciones) - Cuentas ilimitadas (PC o Mac) Manual de usuario de RelicusRoad + Videos de capacitación + Acceso al grupo privado de Discord + Estado VIP UNA NUEVA MANERA DE VER EL MERCADO RelicusRoad es el indicador comercial más poderoso del mundo para divisas, futuros, criptomonedas, acciones e índices, y brinda a los comerciantes toda la información y las herramientas que necesitan para mantenerse rentables. Brindamos análisis técnico
MONEYTRON – ТВОЙ ЛИЧНЫЙ СИГНАЛ НА УСПЕХ! XAUUSD | AUDUSD | USDJPY | BTCUSD Поддержка таймфреймов: M5, M15, M30, H1 Почему трейдеры выбирают Moneytron? 82% успешных сделок — это не просто цифры, это результат продуманной логики, точного алгоритма и настоящей силы анализа. Автоматические сигналы на вход — не нужно гадать: когда покупать, когда продавать. 3 уровня Take Profit — ты сам выбираешь свой уровень прибыли: безопасный, уверенный или максимум. Четкий Stop Loss — контролируешь риск
CBT Quantum Maverick Sistema de Comercio de Opciones Binarias de Alta Eficiencia CBT Quantum Maverick es un sistema de opciones binarias de alto rendimiento diseñado para traders que buscan precisión, simplicidad y un enfoque disciplinado. No requiere personalización: el sistema está optimizado para resultados efectivos desde el primer momento. Simplemente sigue las señales, que se pueden dominar con un poco de práctica. Características clave: Precisión de señales: Señales basadas en la próxim
Elliott Wave Trend was designed for the scientific wave counting. This tool focuses to get rid of the vagueness of the classic Elliott Wave Counting using the guideline from the template and pattern approach. In doing so, firstly Elliott Wave Trend offers the template for your wave counting. Secondly, it offers Wave Structural Score to assist to identify accurate wave formation. It offers both impulse wave Structural Score and corrective wave Structure Score. Structural Score is the rating to sh
FxaccurateLS
Shiv Raj Kumawat
WHY IS OUR FXACCCURATE LS MT5 THE PROFITABLE ? PROTECT YOUR CAPITAL WITH RISK MANAGEMENT Gives entry, stop and target levels from time to time. It finds Trading opportunities by analyzing what the price is doing during established trends. POWERFUL INDICATOR FOR A RELIABLE STRATEGIES We have made these indicators with a lot of years of hard work. It is made at a very advanced level. Established trends provide dozens of trading opportunities, but most trend indicators completely ignore them! The
El Oscilador de Índice de Precisión (Pi-Osc) de Roger Medcalf de Precision Trading Systems La versión 2 ha sido cuidadosamente recodificada para cargar rápidamente en su gráfico y se han incorporado algunas otras mejoras técnicas para mejorar la experiencia. El Pi-Osc fue creado para proporcionar señales precisas de temporización de operaciones diseñadas para encontrar puntos de agotamiento extremos, los puntos a los que los mercados se ven obligados a llegar solo para eliminar las órdenes de
The   Time_Price_SQ9_Degree   indicator is based on the 9 Gann square. Using this indicator, you can identify strong time and price zones. The indicator displays the levels as a degree value. The degrees can be set in the settings. After launching, the MENU button appears. If it is highlighted, it can be moved to any point on the graph, and after double-clicking on it, it stops being highlighted and menu buttons appear. To hide the menu, just double-click on the button, it will become highlight
[ MT4 Version ]  [ Order Blocks ]  [ Kill Zones ]  [ SMT Divergences ] How to trade using Order Blocks :  Click here User Interface Performance:  During testing in the strategy tester, the UI may experience lag. Rest assured, this issue is specific to the testing environment and does not affect the indicator's performance in live trading. Elevate your trading strategy with the  Order Blocks ICT Multi TF  indicator, a cutting-edge tool designed to enhance your trading decisions through advanced o
[ MT4 Version ]  [ Kill Zones ]  [ SMT Divergences ] How to trade using Order Blocks:  Click here User Interface Performance:  During testing in the strategy tester, the UI may experience lag. Rest assured, this issue is specific to the testing environment and does not affect the indicator's performance in live trading. Elevate your trading strategy with the  Order Blocks ICT Multi TF  indicator, a cutting-edge tool designed to enhance your trading decisions through advanced order block analysis
How to use Pair Trading Station Pair Trading Station is recommended for H1 time frame and you can use it for any currency pairs. To generate buy and sell signal, follow few steps below to apply Pair Trading Station to your MetaTrader terminal. When you load Pair Trading Station on your chart, Pair Trading station will assess available historical data in your MetaTrader platforms for each currency pair. On your chart, the amount of historical data available will be displayed for each currency pai
The Naveen Dynamic Square  MT5  is one of the best known  technical analysis tools  inspired  by WD Gann along with the Gann Fan and Gann Box. It is considered a cornerstone of his trading technique that is based on time and price symmetry. The Naveen Dynamic Square MT5   is a powerful tool in finance for determining support and resistance levels based on a stock's extreme price points. It works by extrapolating probable price levels from a central value, typically an all-time or cyclical high o
Reversal ALGO
Muhammad Abdullah Bhatti
Reversal Algo es un indicador técnico diseñado para ayudar a los traders a identificar posibles puntos de reversión en la tendencia del mercado. A través de un análisis profundo de los datos históricos de precios, este indicador detecta máximos y mínimos clave que podrían indicar un cambio en la dirección del mercado. Su sistema de señales visuales claras permite a los traders identificar zonas críticas donde podría producirse una reversión de tendencia. Características principales Detección de
Super Zone indicator
Dmitriy Sotnikov
5 (1)
Super Zone   For several years of observing the principles of the market, Super Zone worked, both then and now, because the indicator  allows you to see the trading range of the  week and even the month that major market participants use. It’s very easy to use, we work on H4 in the weekly range (  in the tester it doesn’t work in the demo mode  ) - we sell from the upper zones, we buy from the lower ones. It marks the zones from the beginning of the week (month) that are  not redrawn  , works on
This indicator is based on the mathematics of the great trader W.D. Ganna. With its help, you can easily find strong levels by analyzing swings to find the optimal entry point. The indicator works on all instruments and all timeframes. The indicator is fully manual and has control buttons. All you need to do is press the NEW button, a segment will appear, which you can place on any movement, swing or even 1 candle that you want to analyze. By placing the segment, press the OK button. A grid (th
This indicator identifies and displays zones, as it were areas of strength, where the price will unfold. The indicator can work on any chart, any instrument, at any timeframe. The indicator has two modes. The indicator is equipped with a control panel with buttons for convenience and split into two modes. Manual mode: To work with manual mode, you need to press the NEW button, a segment will appear. This segment is stretched over the movement and the LVL button is pressed. The level is displayed
TrendMaestro5
Stefano Frisetti
note: this indicator is for METATRADER4, if you want the version for METATRADER5 this is the link:  https://www.mql5.com/it/market/product/108106 TRENDMAESTRO ver 2.4 TRENDMAESTRO recognizes a new TREND in the bud, he never makes mistakes. The certainty of identifying a new TREND is priceless. DESCRIPTION TRENDMAESTRO identifies a new TREND in the bud, this indicator examines the volatility, volumes and momentum to identify the moment in which there is an explosion of one or more of these data a
Elliot Waves Analyzer Pro
Viktor Weidenthal
2.67 (3)
Elliot Waves Analyzer Pro calculates Elliot Waves to Help Identify Trend direction and Entry Levels. Mainly for Swing Trading Strategies. Usually one would open a Position in trend direction for Wave 3 or a Correction for Wave C . This Indicator draws Target Levels for the current and next wave. Most important Rules for Elliot Wave Analysis are verified by the Indicator.  The Pro version analyzes Multiple Timeframes and shows the Subwaves and Target-Levels.   For an Overview  " Elliot Waves Anal
TMA Channel is a price channel obtained through a special calculation method based on traditional TMA . The channel has upper, middle, and lower tracks . When the price approaches or exceeds the upper track, it is already in an overbought state, and attention should be paid to the situation of reversal and decline; When the price approaches or falls below the lower track, it is already in an oversold state, and attention should be paid to the situation of reversal and rise . The indicator will
Seconds Charts
Aleksandr Goryachev
Micro  ******************* Секундные графики MT5 ********************** Более точного инструмента для входа в сделку вы не найдёте. Входные параметры: Timeframe, sek - период построения графика, секунды Displayed bars - отображаемые бары Step of price levels, pp, 0-off - шаг отрисовки ценовых уровней, пункты Scale points per bar, 0-off - масштаб в пунктах на бар Show lines - отображение текущих уровней Show comment - отображение комментария Standard color scheme - стандартная цветовая сх
El Indicador de Cuadrados de Gann es una herramienta poderosa de análisis de mercado basada en el artículo "Fórmula Matemática para Predicciones de Mercado" escrito por W.D. Gann, que se basa en conceptos matemáticos para el análisis. Incorpora elementos de las técnicas de Gann relacionadas con los cuadrados de 144, 90 y 52, así como el cuadrado de 9. Además, incluye el método del  sobre cómo combinar el cuadrado de 9 con canales y patrones de estrellas. Manual del Usuario y Modo de Uso: Antes d
Happy entries
Godwill Fortune Otieno Juma
The  product gives optimized entries for 3min ,1 hr and day timeframes  Does well with indices  ASIAN- HK50 AND CHINA A50 USA-US30,US100,US500 GER40 ,UK100 For stocks trade with the day timeframes Happy Entry employs advanced algorithms and real-time data analysis to identify optimal entry points with unprecedented accuracy. Its adaptive nature allows it to seamlessly adjust to changing market conditions, ensuring you never miss out on profitable opportunities. Whether you're a beginner or seas
Offer 249 down from 350 for the next 1 copies. then back to 350 $ Are you tired of using outdated indicators that leave you guessing where to set your profit targets? Look no further than the AK CAP Opening Range Breakout Indicator. This powerful tool is backed by a US patent and has already helped countless traders pass funded challenges like FTMO. We use it daily on our prop traders and internal funds, and now it's available to you as well. The calculation behind the indicator is incredibly a
BookMap HeatMap
Roberto Spadim
1 (2)
This Indicator creates a heatmap based on depth of market of the current symbol or another symbol. Other symbol is useful when you trade futures market and a contract has 'mini' and 'full' split. For example, in Brazil (B3 - BMF&Bovespa), WDO and DOL are future Forex contract of BRL/USD (where 1 DOL = 5 WDO) and big banks work mostly with DOL (where liquidity is important). Please use with M1 timeframe , objects are too small to be displayed at higher timeframes (MT5 limit). The number of level
Por supuesto, aquí tienes la traducción al español: Presentamos el Indicador de Astronomía para   MT4 / MT5 : Tu Compañero Celestial Definitivo en el Trading ¿Estás listo para elevar tu experiencia de trading a alturas celestiales? No busques más allá de nuestro revolucionario Indicador de Astronomía para MT4. Esta innovadora herramienta trasciende los indicadores de trading tradicionales, aprovechando el poder de algoritmos complejos para proporcionarte una visión astronómica sin igual y cálcul
Introduction Excessive Momentum Indicator is the momentum indicator to measure the excessive momentum directly from raw price series. Hence, this is an extended price action and pattern trading. Excessive Momentum Indicator was originally developed by Young Ho Seo. This indicator demonstrates the concept of Equilibrium Fractal Wave and Practical Application at the same time. Excessive Momentum detects the market anomaly. Excessive momentum will give us a lot of clue about potential reversal and
Visual Heatmap Book Analyzer
Alexandre Moraes De Souza Lima
Visual Heatmap Book Analyser This indicator monitors the market liquidity and generates colors based on order patterns, quantities, and renewal activities in the book. This allows you to visualize the order flow and identify areas of high and low liquidity and activity. The indicator uses machine learning techniques to analyze the order behavior in the book, enabling it to detect patterns and trends in orders, allowing you to make informed decisions about your trading operations. The color pale
Weis Wave with Alert MT5
Trade The Volume Waves Single Member P.C.
4.94 (16)
Rental/Lifetime Package Options and Privileges  Rent Monthly Six Months   Yearly/Lifetime Weis Wave with Speed with Alert+Speed Index x x x Manual  x x x Quick Set up Video x x x Blog x x x Lifetime Updates x x x Setup and Training Material x x Discord Access Channel "The SI traders"          x Rectangle Break Alert Tool      x How to trade with it:    http://www.tradethevolumewaves.com   ** If you purchase please contact me to setup your  : Two hour  webinar and  training Room and  complet
Hello I Want to introduce The Forex Buy Sell Arrow Premium MT5 i recently release this premium indicator! its 1000% Non Repaint Indicator, It Work Perfectly Well,, i tested it day by day, Just mind blowing Result,  Including Powerful trend Algorithm! How It Work? well, it work market trend formula, when trend Bullish Or when trend Bearish,  Recommend Timeframe M30, H1 it work all timeframe, and all currency pair, 100% non repaint, How to take signal From Forex Buy Sell Arrow Premium Ind
Pro Thunder V10: ¡El Indicador Definitivo para Operaciones de Opciones Binarias! Lleva tu trading al siguiente nivel con Pro Thunder V10 , el pináculo de las operaciones con opciones binarias. Impulsado por tecnología avanzada de Redes Neuronales con IA , este indicador revolucionario está diseñado para ofrecer precisión y confiabilidad incomparables. Desde señales en tiempo real que no se repintan hasta un rendimiento impecable en condiciones de mercado volátiles, Pro Thunder V10 es t
Otros productos de este autor
IQ FX Gann Levels a precision trading indicator based on W.D. Gann’s square root methods. It plots real-time, non-repainting support and resistance levels to help traders confidently spot intraday and scalping opportunities with high accuracy. William Delbert Gann (W.D. Gann) was an exceptional market analyst, whose trading technique was based on a complex blend of mathematics, geometry, astrology, and ancient mathematics which proved to be extremely accurate. Download the Metatrader 5 Version M
IQ Gold Gann Levels a non-repainting, precision tool designed exclusively for XAUUSD/Gold intraday trading. It uses W.D. Gann’s square root method to plot real-time support and resistance levels, helping traders spot high-probability entries with confidence and clarity. William Delbert Gann (W.D. Gann) was an exceptional market analyst, whose trading technique was based on a complex blend of mathematics, geometry, astrology, and ancient mathematics which proved to be extremely accurate. Download
Hydra Trend Rider is a non-repainting, multi-timeframe trend indicator that delivers precise buy/sell signals and real-time alerts for high-probability trade setups. With its color-coded trend line, customizable dashboard, and mobile notifications, it's perfect for traders seeking clarity, confidence, and consistency in trend trading. Download the Metatrader 5 Version Message us here after purchase to get the Indicator Manual. Download Now! Offer valid only for next 10 Buyers. Price will increas
Volatility Master for MetaTrader is a real-time dashboard tool that scans up to 30 symbols to identify high-volatility, trending markets instantly. With clear bullish/bearish signals, customizable alerts, and a user-friendly interface, it helps you avoid range-bound conditions and focus on high-probability trades. Clarity leads to confidence. This is your chance to trade confidently and protect your capital effectively, don't miss the opportunity that you might regret later! Download  Metatrader
IQ Gold Gann Levels a non-repainting, precision tool designed exclusively for XAUUSD/Gold intraday trading. It uses W.D. Gann’s square root method to plot real-time support and resistance levels, helping traders spot high-probability entries with confidence and clarity. William Delbert Gann (W.D. Gann) was an exceptional market analyst, whose trading technique was based on a complex blend of mathematics, geometry, astrology, and ancient mathematics which proved to be extremely accurate. Download
Hydra Trend Rider is a non-repainting, multi-timeframe trend indicator that delivers precise buy/sell signals and real-time alerts for high-probability trade setups. With its color-coded trend line, customizable dashboard, and mobile notifications, it's perfect for traders seeking clarity, confidence, and consistency in trend trading. Download the Metatrader 4 Version Message us here after purchase to get the Indicator Manual. Download Now! Offer valid only for next 10 Buyers. Price will increas
Volatility Master  for MetaTrader is a real-time dashboard tool that scans up to 30 symbols to identify high-volatility, trending markets instantly. With clear bullish/bearish signals, customizable alerts, and a user-friendly interface, it helps you avoid range-bound conditions and focus on high-probability trades. Clarity leads to confidence. This is your chance to trade confidently and protect your capital effectively, don't miss the opportunity that you might regret later! Download  Metatrade
IQ FX Correlation Matrix is a powerful multi-timeframe dashboard that helps traders analyze real-time currency correlations across multiple forex pairs. With customizable settings, sleek design, and one-click symbol switching, it enhances trade accuracy, reduces risk, and identifies profitable correlation-based opportunities. Download the Metatrader 4  Version Message us here after purchase to get the Indicator Manual. Download Now! Offer valid only for next 10 Buyers. Price will increase gradua
FX Correlation Matrix is a powerful multi-timeframe dashboard that helps traders analyze real-time currency correlations across multiple forex pairs. With customizable settings, sleek design, and one-click symbol switching, it enhances trade accuracy, reduces risk, and identifies profitable correlation-based opportunities. Download the Metatrader 5 Version Message us here after purchase to get the Indicator Manual. Download Now! Offer valid only for next 10 Buyers. Price will increase gradually!
Filtro:
No hay comentarios
Respuesta al comentario
Versión 1.8 2025.03.24
code upgrade, one-click close button
Versión 1.7 2025.03.17
bug fix and improvement.
Versión 1.6 2025.03.12
Bug fixed.
Versión 1.5 2025.02.16
Code and alert improvement, Bug fixed.
Displays past accurate Gann levels.
An option was added to display Gann's major levels only.
Versión 1.4 2025.01.30
Code improvement
Versión 1.3 2025.01.15
major upgrade, simplified.
Versión 1.2 2024.11.29
Improved coding.
Versión 1.1 2024.11.22
Major upgrade, improved coding, alert added, options to change colors.