TMA Channel with showing trend MT5
- Indicadores
- Yu Fan Zhang
- Versión: 1.1
- Actualizado: 18 julio 2024
- Activaciones: 10
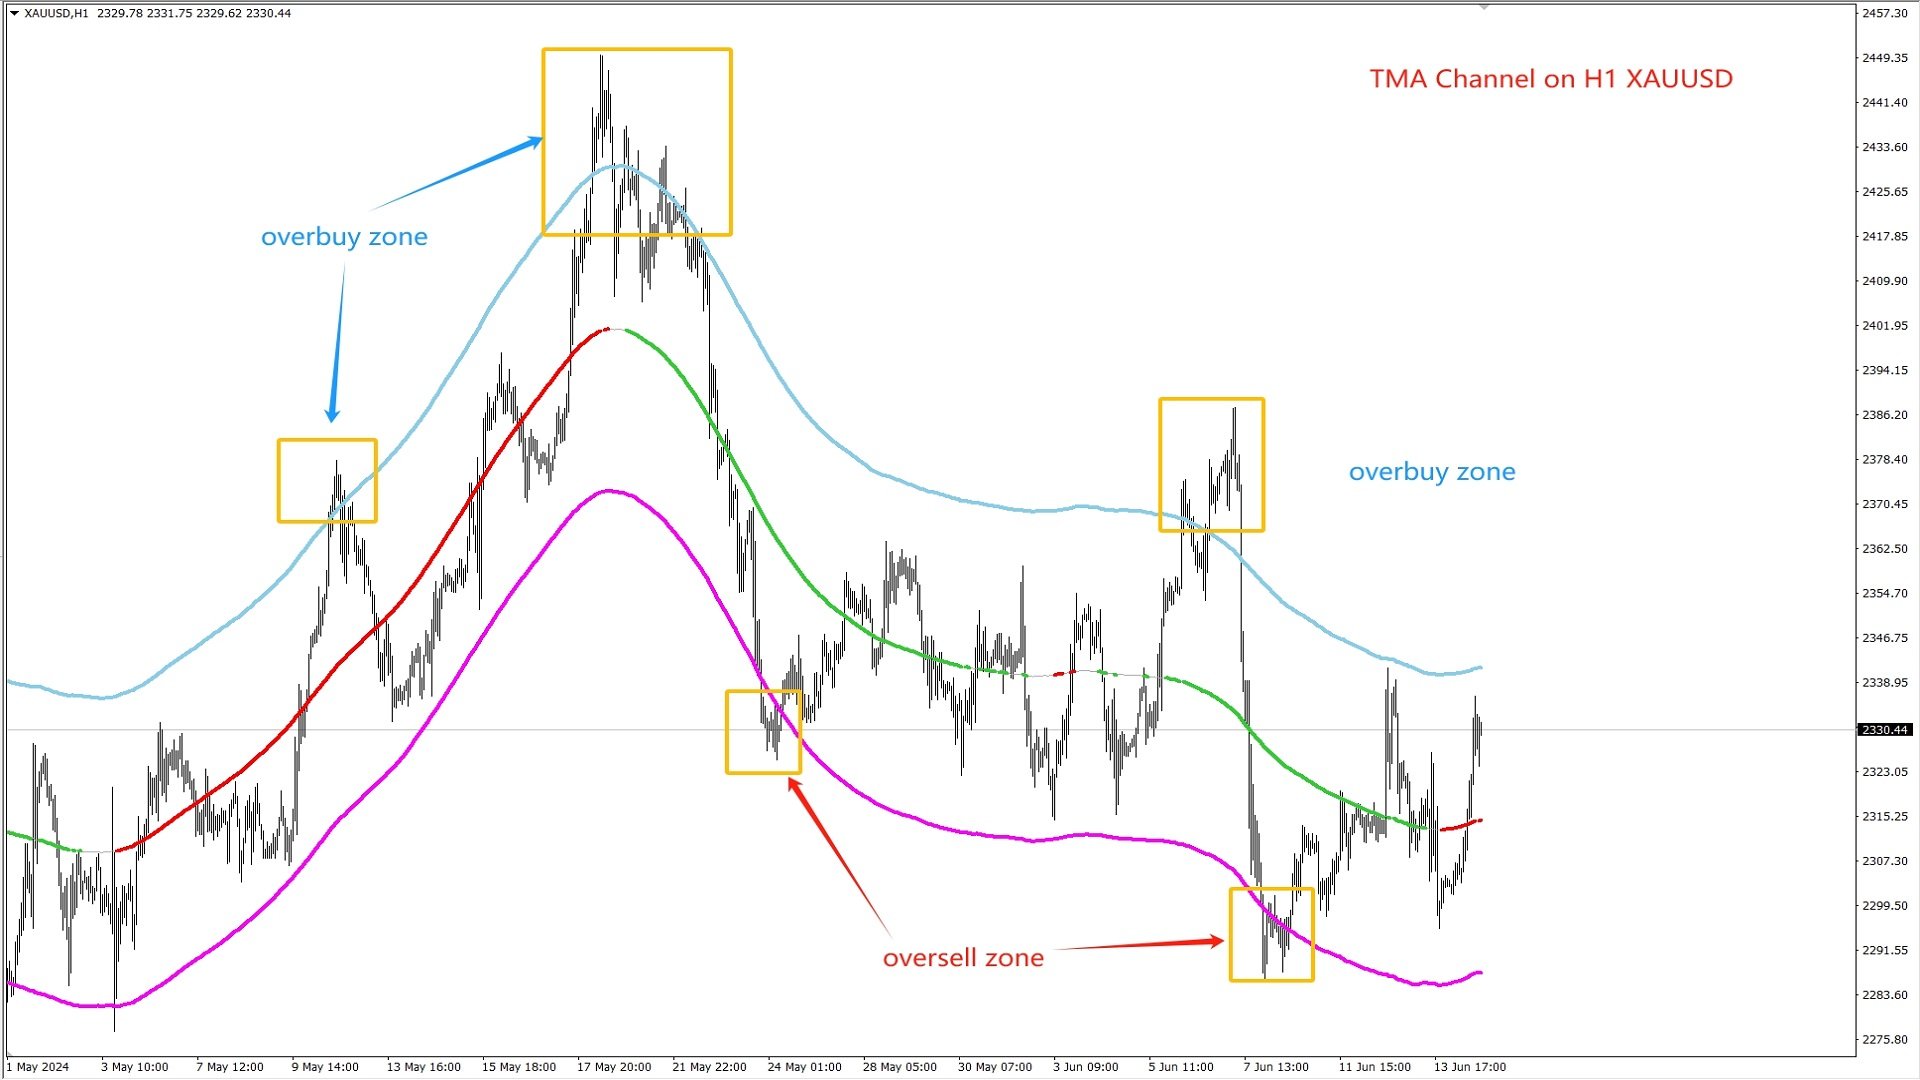
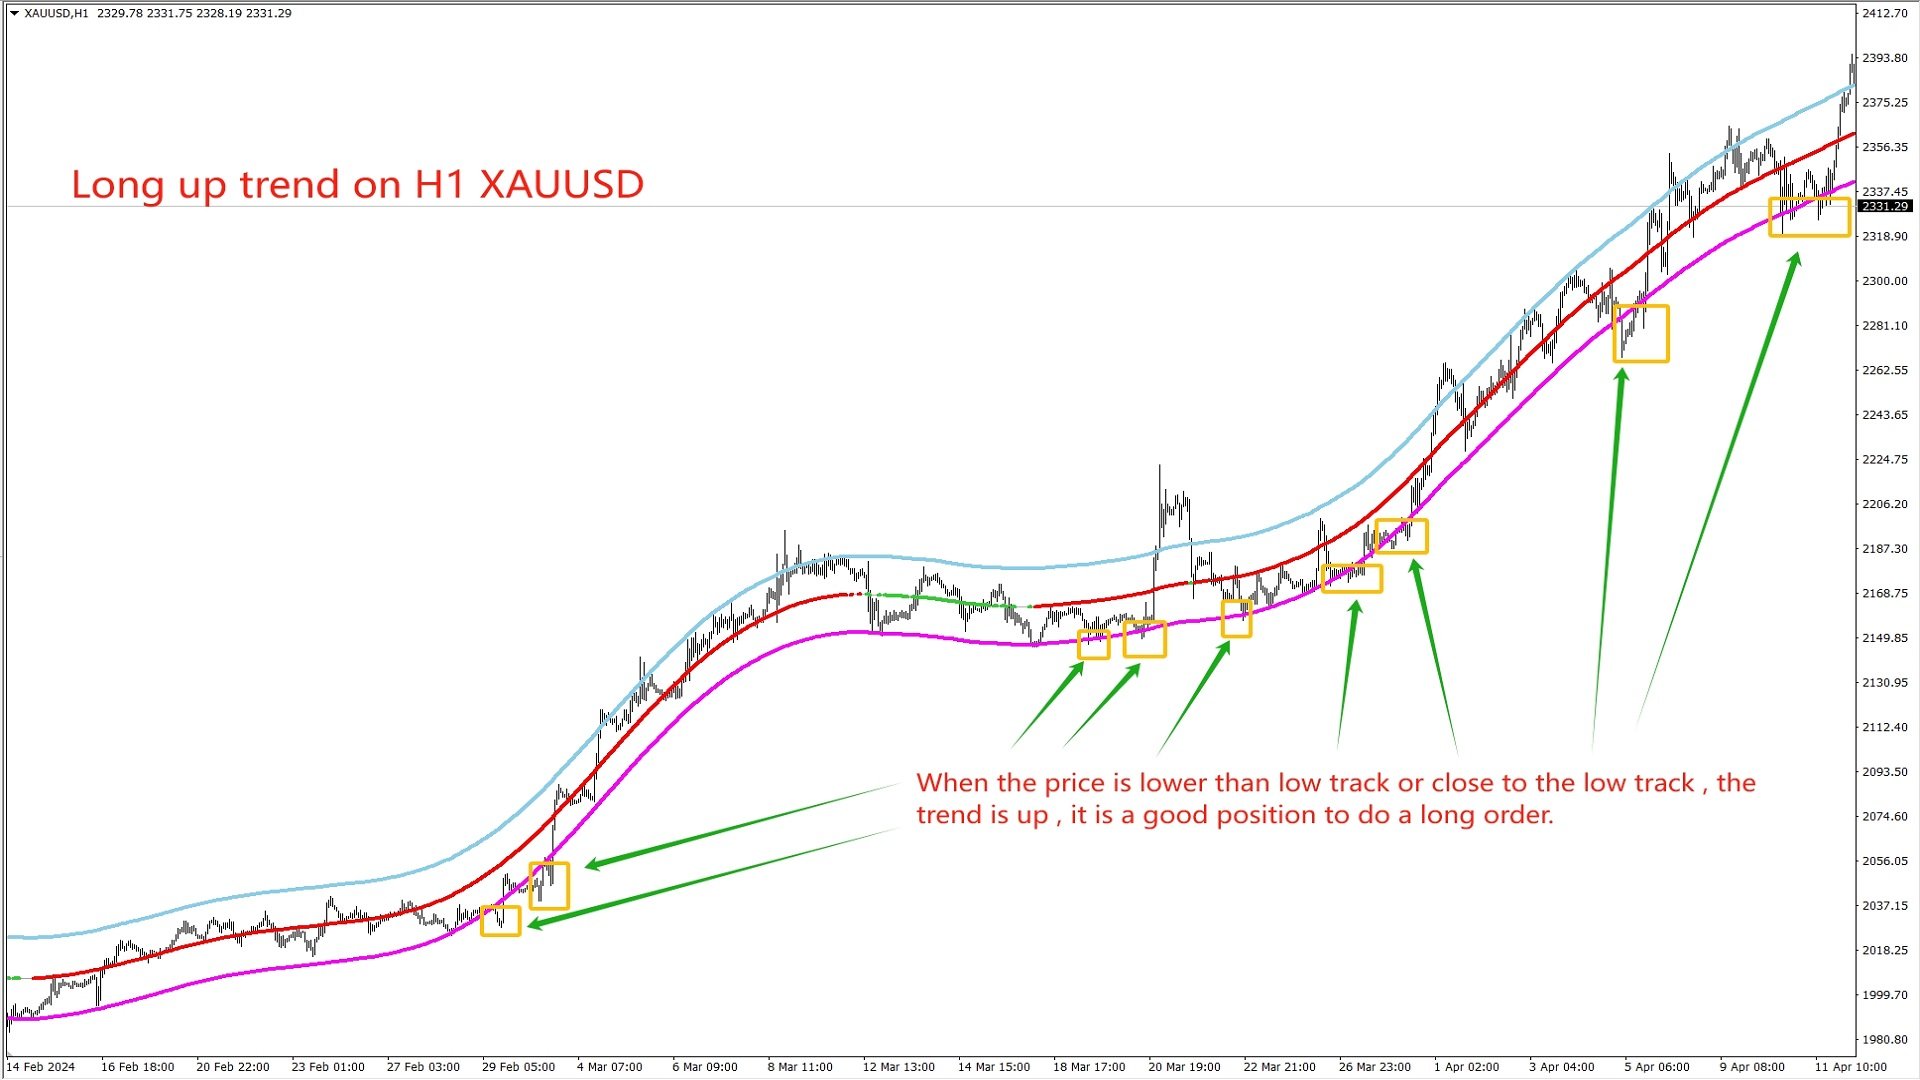
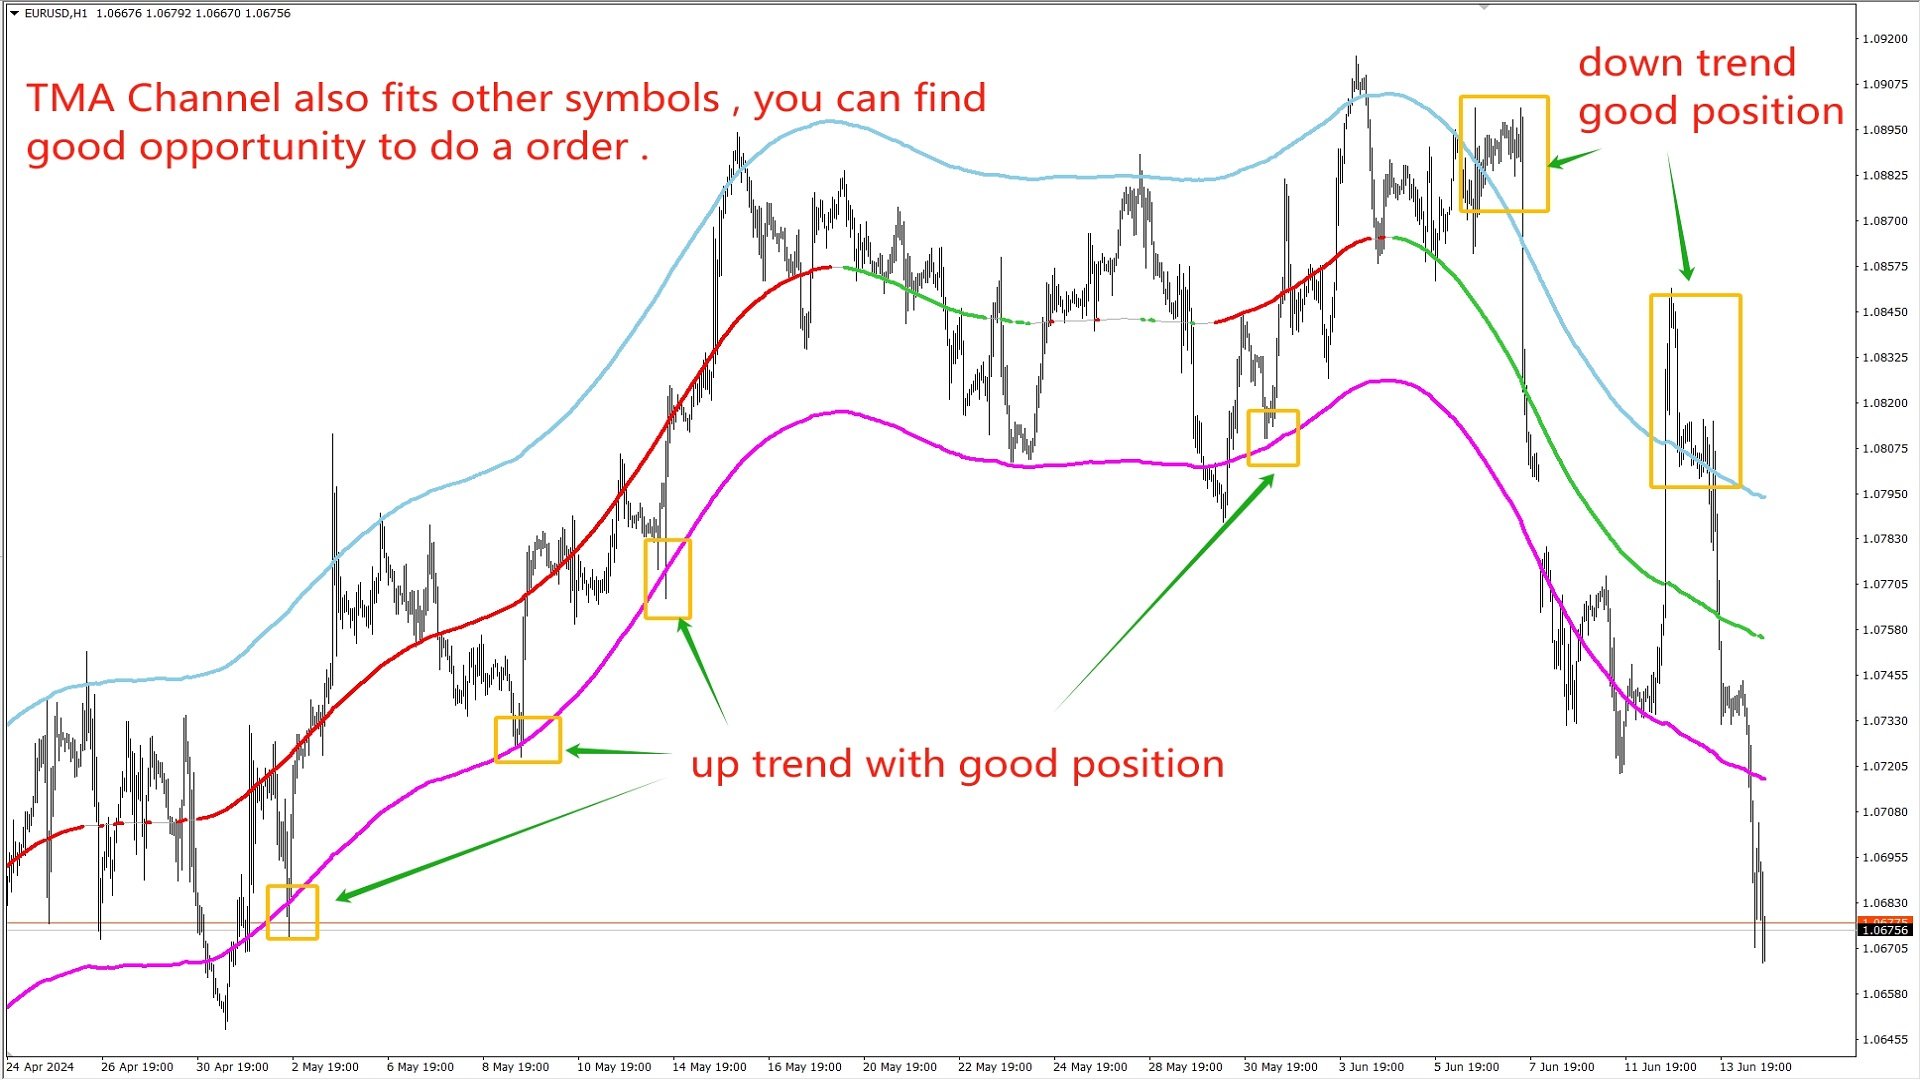
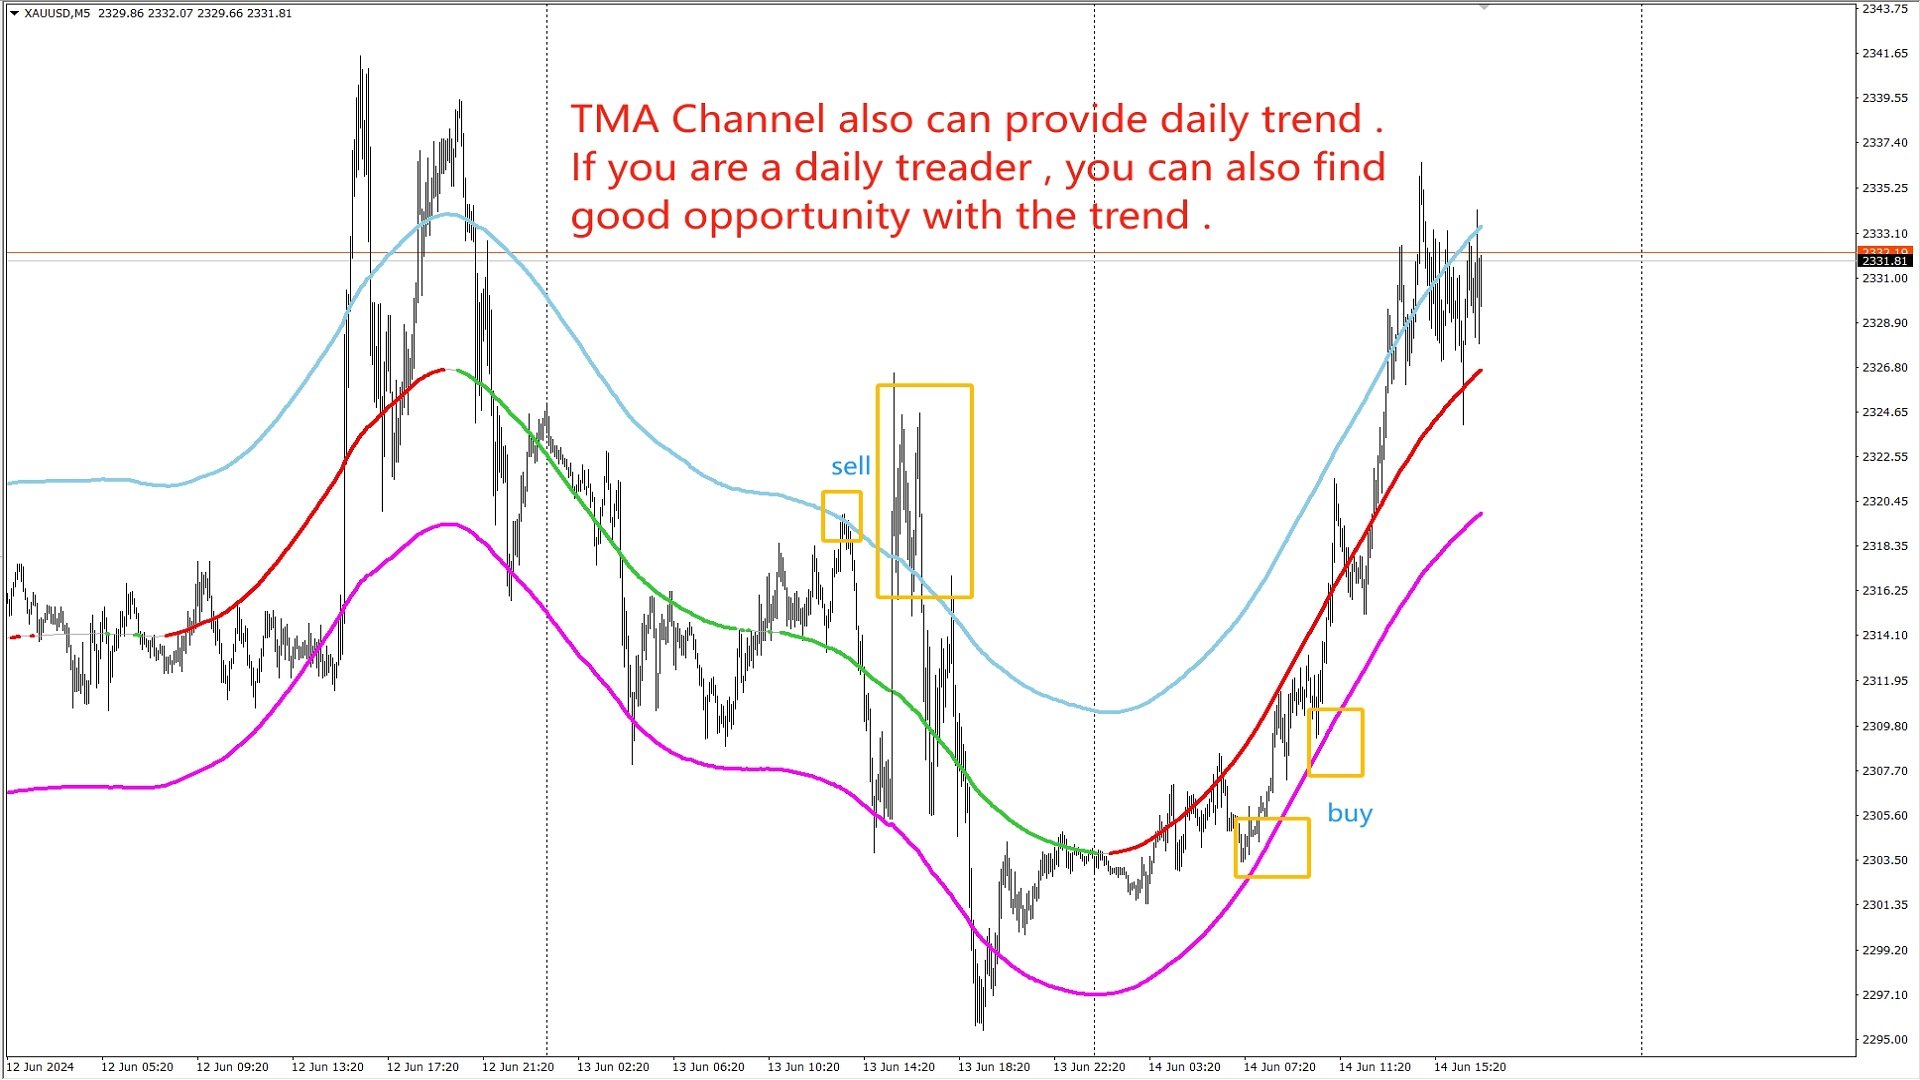
TMA Channel is a price channel obtained through a special calculation method based on traditional TMA . The channel has upper, middle, and lower tracks . When the price approaches or exceeds the upper track, it is already in an overbought state, and attention should be paid to the situation of reversal and decline; When the price approaches or falls below the lower track, it is already in an oversold state, and attention should be paid to the situation of reversal and rise . The indicator will display an upward or downward trend based on the slope of the middle track . When there is no clear trend displayed, it indicates that the market is in a wide range of fluctuations .
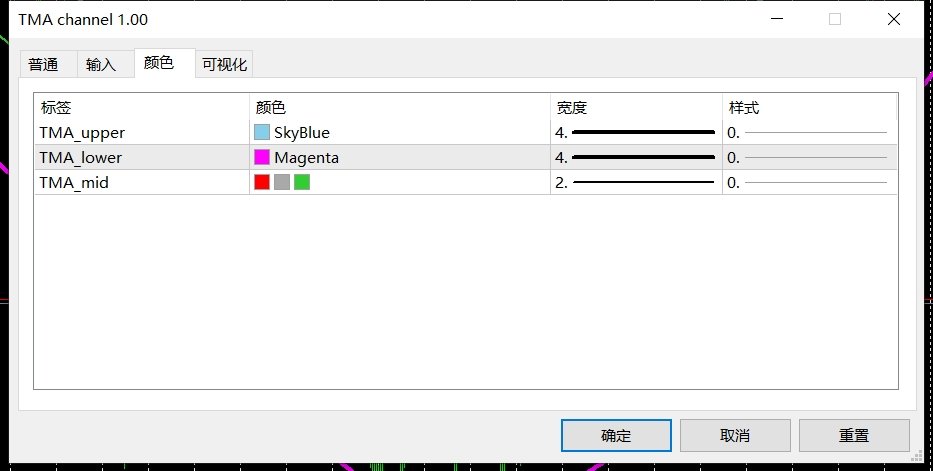
In the indicator's properties, set the colors for the upward and downward trends of the TMA midline. The first color represents the upward trend, the second color represents the neutral trend, and the third color represents the downward trend.
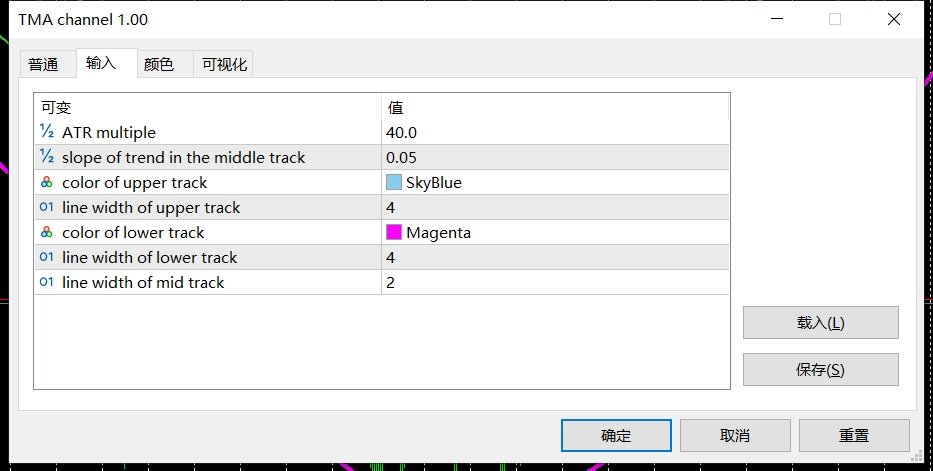
ATR multiple : The multiplier for ATR is default at 40. Changing this value will affect the positions of the upper and lower bands; a higher value increases the distance between the upper and lower bands relative to the midline