• Información general
  • Comentarios
  • Discusión

Precision ICT Killzones

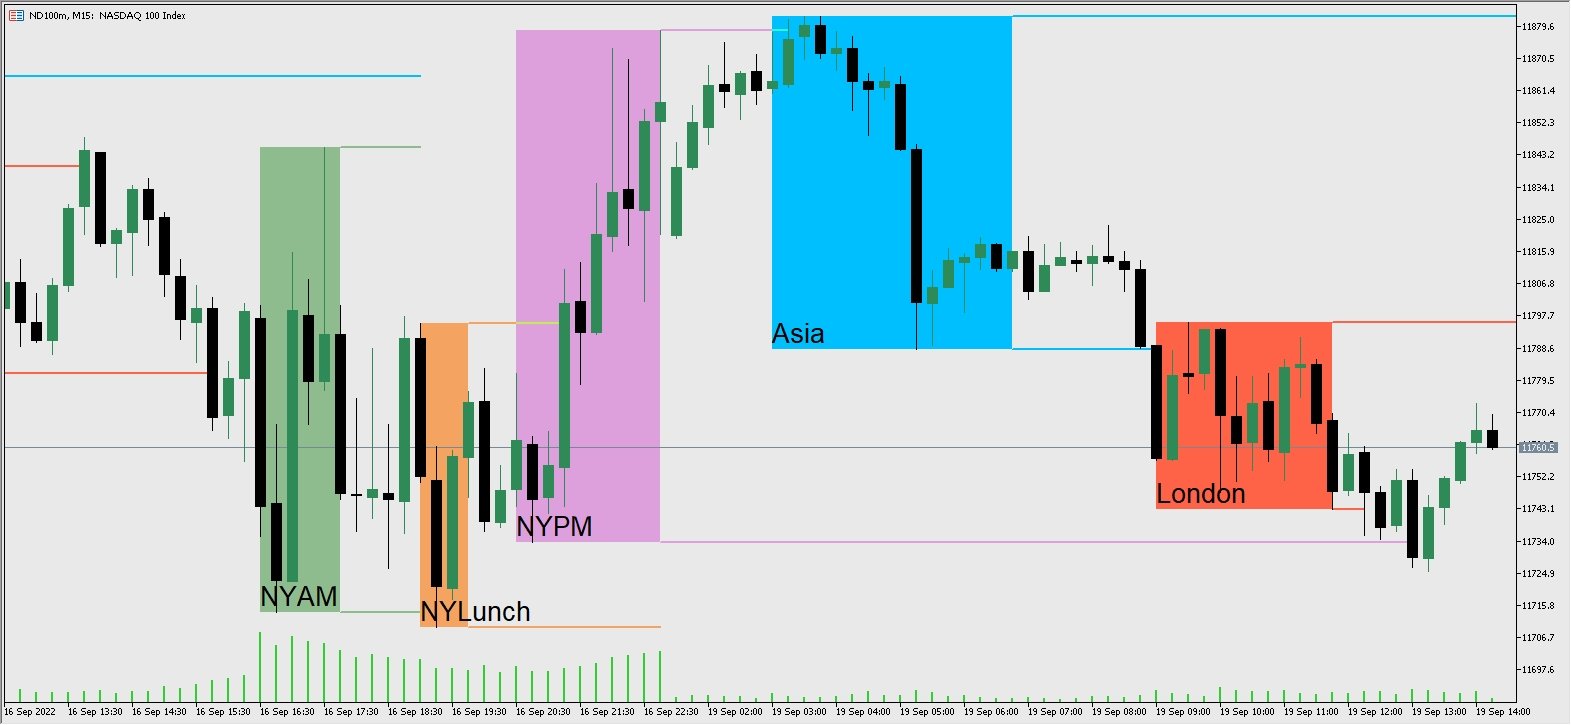
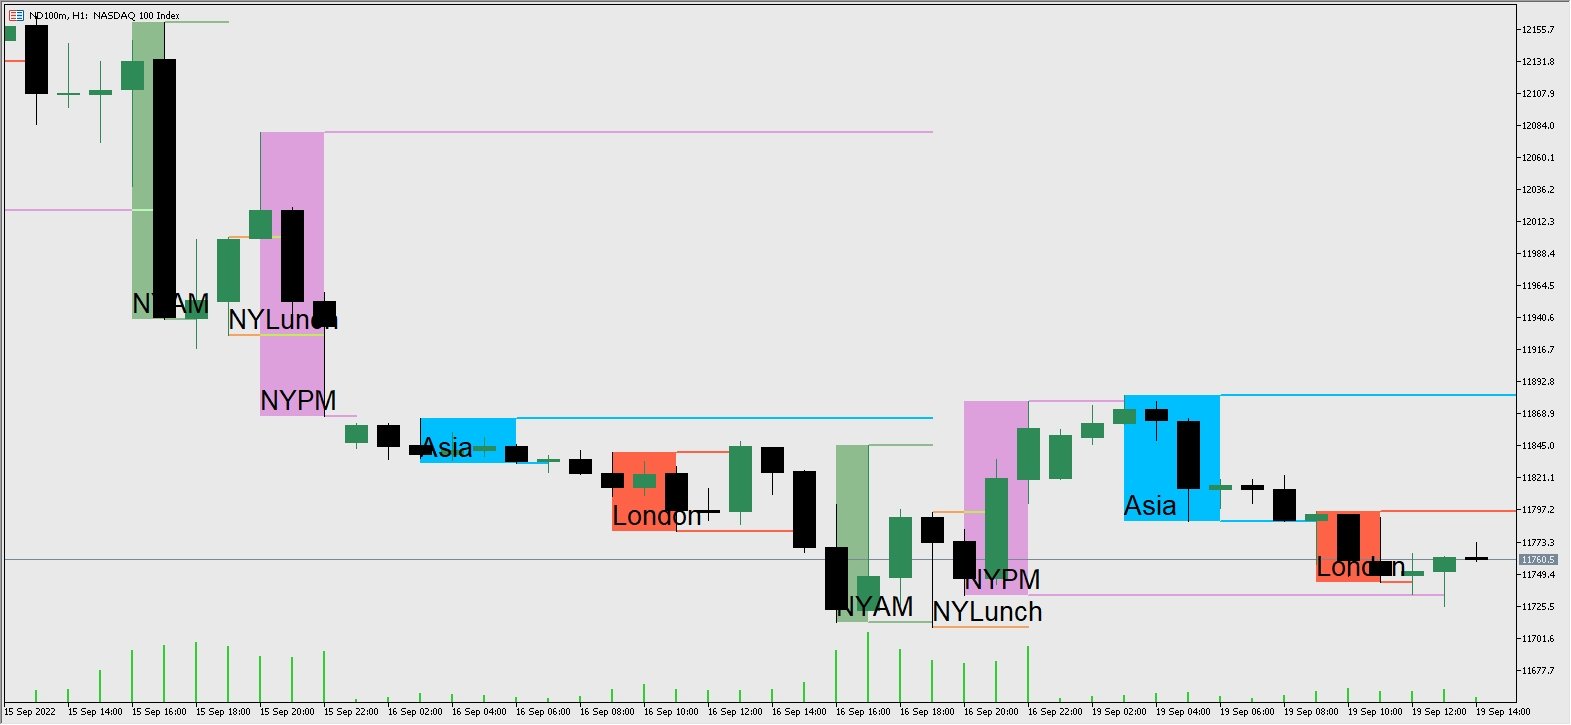
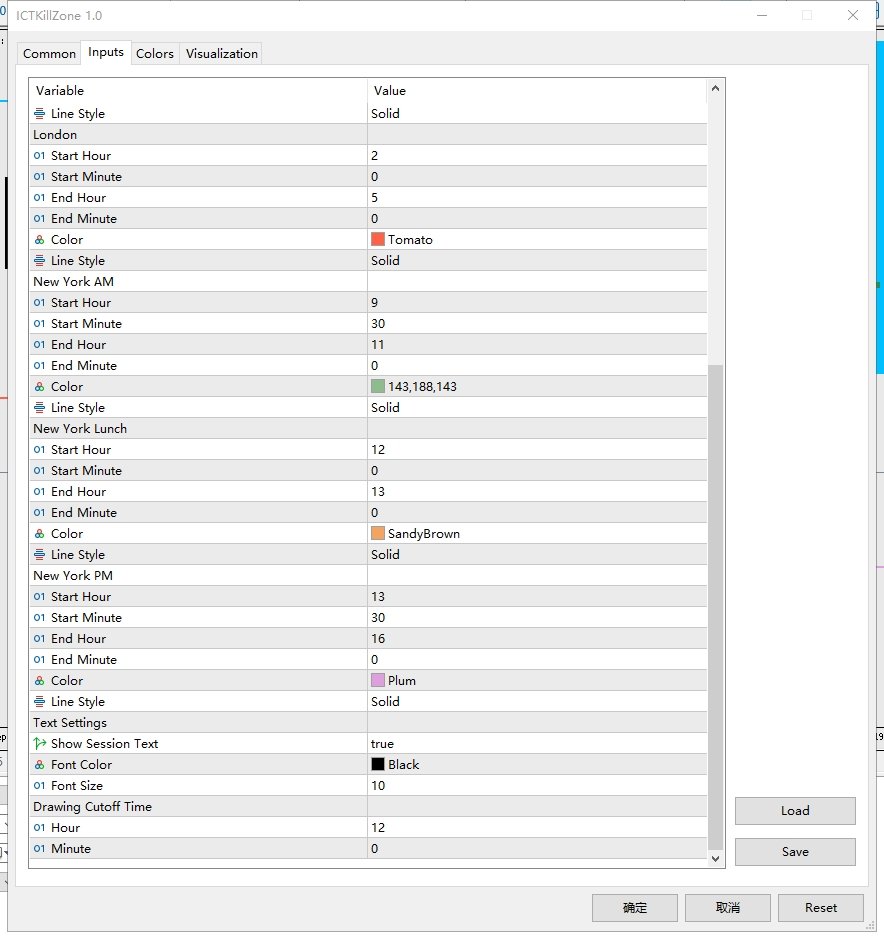
Identifique los 5 marcos temporales de ICT killzones en diferentes colores y siga el seguimiento para marcar la zona de precios dentro del marco temporal, las líneas de referencia del punto de pivote alto y bajo se extenderán automáticamente hasta que se rompa el precio del punto de pivote o finalice el marco temporal de negociación. Este indicador le ayuda a encontrar puntos de ruptura para operar con la tendencia.
Las ICT killzones son periodos de tiempo específicos en el mercado en los que el volumen y la volatilidad tienden a aumentar, abriendo oportunidades de beneficios potenciales para los operadores.
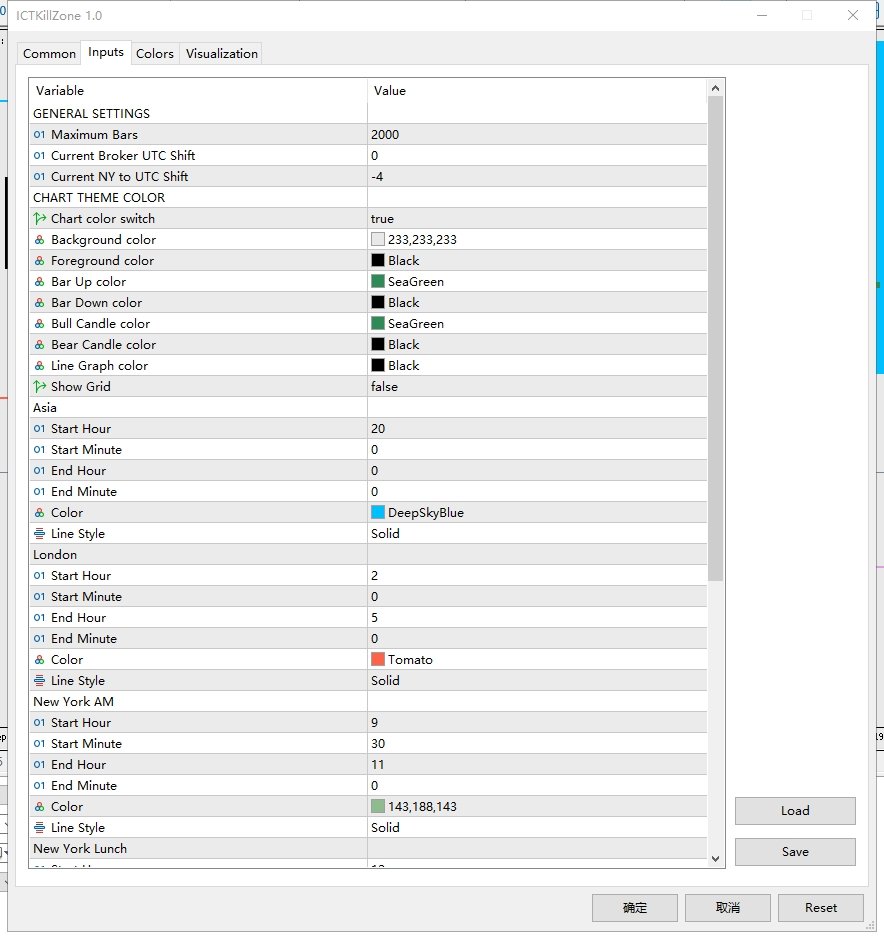
Las 5 killzones son personalizables con sus propios colores y plazos y pueden ajustarse a su gusto o ajustarse a una zona horaria completamente diferente. El indicador hará un seguimiento automático de los ajustes.
  • Para el primer uso, necesitas establecer el desfase de la diferencia horaria. En 'Current Broker UTC Shift', introduce la diferencia UTC para el tiempo del broker de tu MetaTrader (por ejemplo, MetaTrader por defecto usa la zona horaria de Moscú de UTC+3, así que introduce 3. Si ha sido cambiado a la hora de Beijing, entonces introduce 8).
  • Para las regiones que observan el horario de verano, introduce -4 en 'Current NY to UTC Shift' durante el horario de verano, y -5 durante el horario estándar.

Temas relacionados:

Sesiones de negociación, horas de mercado, horas de sesión, horas de divisas, horarios de negociación, horas de apertura y cierre del mercado, husos horarios de negociación, indicadores de sesión, relojes de mercado, TIC, Killzone asiático, Killzone londinense, Killzone neoyorquino

Productos recomendados
BinaWin NoTouch
Juan Fernando Urrego Alvarez
BinaWin NoTouch es un indicador que manda una señal de alerta cuando el comercio está en la posición correcta para esperar el rompimiento de un mercado lateral. Es pensado especialmente para hacer trading bajo la estrategia “No Touch” de la plataforma Binary.Com con los índices sintéticos N.10, N.25, N.50, N.75 y N.100 De igual forma se puede hacer trading con la estrategia CALL y PUT convencional de cualquier plataforma de Opciones Binarias. Requisitos para usar el indicador: 1. Tener cuenta en
FREE
Fibonacci and RSI Demo version MQL5
Carlos Daniel Vazquez Rosas
4 (1)
Fibonacci and RSI. Demo versión only works with GBPUSD. For full version, please, visit visit https://www.mql5.com/en/market/product/52101 The indicator is a combination of the Fibonacci and RSI indicators. Every time the price touches one of the fibonacci levels and the rsi condition is met, an audible alert and a text alert are generated. Parameters number_of_candles : It is the number of candles that will be calculated. If you put 100, the indicator will give you the maximum and min
FREE
Market Cycle and Trading Sessions
Maximiliano Frisione Figueroa
Indicador de Ciclo de Mercado y Sesiones de Trading Presentamos nuestro Indicador de Ciclo de Mercado y Sesiones de Trading, una herramienta diseñada para brindarte una visión completa del mercado financiero como nunca antes.  Observa el pulso del mercado con nuestro exclusivo indicador. Obtén una comprensión profunda de las fases del mercado, desde la acumulación hasta la distribución, para tomar decisiones informadas, estratégicas y con alta probabilidad. ¿Qué hace nuestro indicador? 1
Best SAR MT5
Ashkan Hazegh Nikrou
5 (1)
Descripción :  nos complace presentar nuestro nuevo indicador gratuito basado en uno de los indicadores profesionales y populares en el mercado de divisas (PSAR). Este indicador es una nueva modificación del indicador Parabolic SAR original. En el indicador pro SAR puede ver el cruce entre puntos y el gráfico de precios. el cruce no es una señal, pero habla sobre el final del potencial de movimiento, puede comenzar a comprar con un nuevo punto azul y colocar un límite de pérdidas un atr antes
FREE
Was: $249  Now: $99   Market Profile defines a number of day types that can help the trader to determine market behaviour. A key feature is the Value Area, representing the range of price action where 70% of trading took place. Understanding the Value Area can give traders valuable insight into market direction and establish the higher odds trade. It is an excellent addition to any system you may be using. Inspired by Jim Dalton’s book “Mind Over Markets”, this indicator is designed to suit the
The Rocket Trend indicator is trending. The indicator draws two-color points connected by lines along the chart. This is a trend indicator, it is an algorithmic indicator. It is easy to work and understand when a blue circle appears, you need to buy, when a red one appears, sell. The indicator is used for scalping and pipsing, and has proven itself well. Rocket Trend is available for analyzing the direction of the trend for a specific period of time. Ideal for novice traders learning the laws o
This Indicator adding power to traditional zigzag indicator. With High-Low numbers in vision it will be easier to estimate change of trend by knowing the depth of each wave. Information including points, pips, percentage%, and #bars can be displayed based on configuration. All information is real-time update. This indicator is especially useful in sideway market to buy low sell high.
Nadaraya-Watson Envelope Indicator convert to MT5 Nadaraya Watson Envelope Indicator is one of the monst popular indicator in TradingView. TradingView(Chrome, Edge) eats a huge of CPU, so I convert this to MT5 version. As you can see the screenshot, it's good with Schaff trend RSI Indicator (or others) If you want to get Schaff trend RSI Indicator , Link:  https://www.mql5.com/en/market/product/98011 Window Size - determines the window size for calculating smoothed values. A larger window
** All Symbols x All Timeframes scan just by pressing scanner button ** *** Contact me after the purchase to send you instructions and add you in "ABCD scanner group" for sharing or seeing experiences with other users. Introduction This indicator scans AB=CD retracement patterns in all charts. The ABCD is the basic foundation for all harmonic patterns and highly repetitive with a high success rate . The ABCD Scanner indicator is a scanner reversal ABCD pattern that helps you identify when the pr
The Volume by Price Indicator for MetaTrader 5 features Volume Profile and Market Profile TPO (Time Price Opportunity). Volume and TPO histogram bar and line charts. Volume Footprint charts. TPO letter and block marker collapsed and split structure charts. Session filtering and grouping. Static, dynamic and flexible range segmentation and compositing methods with relative and absolute visualizations. Graphical layering, positioning and styling options to suit the user's analytic and aesthetic n
¡El nivel Premium es un indicador único con más del 80% de precisión de predicciones correctas! ¡Este indicador ha sido probado por los mejores especialistas en comercio durante más de dos meses! ¡El indicador del autor no lo encontrarás en ningún otro lugar! ¡A partir de las capturas de pantalla, puede ver por sí mismo la precisión de esta herramienta! 1 es ideal para operar con opciones binarias con un tiempo de vencimiento de 1 vela. 2 funciona en todos los pares de divisas, accion
An oscillator that shows price changes and identifies areas of overbought and oversold. It can also show trend reversal points. WaveTrend Oscillator is a port of a famous TS /MT indicator. When the oscillator is above the overbought band (red lines) and crosses down the signal (solid line), it is usually a good SELL signal. Similarly, when the oscillator crosses above the signal when below the Oversold band (green lines), it is a good BUY signal. Good luck.
White Weis Volume Ticks
Ricardo Almeida Branco
5 (3)
White Weis Volume This indicator shows the sum of the volume in each wave, bulish or bearish, as idealized by David Weis , but it brings an important addition , which is the marking of the bar with the highest volume of the wave (White Bar)! In coding the indicator, it was sought to optimize the code to require minimal processing during use and not to overload mt5. The indicator can be used for pre-trading analysis and study, where the trader analyzes possible points of support and resi
Descriptions A point point is a technical analysis indicator, or calculations, used to determine the overall trend of market over different time frames. This indicator calculate the highest or lowest pivots among left x and right y bars and show the high/low level during that period.   From that, you could clearly see the top resistance & bottom support level and how market goes break out. Instructions pivotLeft - pivot left bar count pivotRight - pivot right bar count pivotHighColor - c
The best time to trade Using this Indicator is when the time reach exactly hour,half,45 minutes,15 minutes and sometimes 5 minutes.. This indicators is helpful to those who trade boom and crash indecies.How to read this indicator first you'll see Blue allow and Red allow all these allows used to indicate or to detect the spike which will happen so the allow happens soon before the spike happen.This indicator works properly only in boom and crash trading thing which you have to consider when
Zeus Indicator MT5
Lo Thi Mai Loan
3 (1)
Presentación del Indicador Zeus: Tu Última Herramienta para Romper con las Ganancias en el Trading. Este indicador simplifica el trading, eliminando la necesidad de un análisis profundo con estrategias de ruptura. Dibuja automáticamente zonas basadas en tus marcos de tiempo preestablecidos, sugiere niveles de Stop Loss (SL), Take Profit (TP) y Trailing Stop. El Indicador Zeus te notificará de inmediato y mostrará flechas de señal cuando el precio se acerque a los puntos de entrada de compra o ve
The Supernova Momentums indicator simplifies the visual perception of the price chart and reduces the time for analysis: if there is no signal, the deal is not opened, and if an opposite signal appears, it is recommended to close the current position. This arrow indicator is designed to determine the trend. Supernova Momentums implements a trend trading strategy, filters out market noise, and includes all the necessary features in one tool. Its work is based on automatically determining the c
Market Profile MetaTrader System  — is a classic Market Profile implementation that can show the price density over time, outlining the most important price levels, value area, and control value of a given trading session. This indicator can be attached to timeframes between M1 and D1 and will show the Market Profile for daily, weekly, monthly, or even intraday sessions. Lower timeframes offer higher precision. Higher timeframes are recommended for better visibility. It is also possible to use a
FibExtender
Syed Oarasul Islam
This Indicator draws Fibonacci Extension levels in two different ways. You can select whether to draw Fibonacci Extension levels based on your favourite ZigZag settings or you can let the indicator to draw Fibonacci Extension  level based on given number of Bars or Candles.  You can also set Mobile and Email notification for your favourite Extension  levels individually. With this indicator you will not have to feel lonely as the it can generate Voice alerts, which will keep you focused on your
Retracement Pip Catcher MT5
Christopher Graham Parish
!! FLASH SALE !!   Over 80% off !!     For ONE week only. Now only $47 - normally $297! >>>      Ends on 30 June 2023 - Don't miss it! Buy and Sell Arrows when price is about to retrace. It Also Sends Alerts – On MT5 To Your Phone To Your Email Does not repaint. Works ony any pair, any timeframe. 10 Activations allowed so you are free from limitations See an example of alerts from today (23 May 2020) using this and 2 other indicators  here . MT4 Version here . Spreads from 0.1p
HoD LoD Time Price Studies
Aurthur Musendame
4.33 (3)
High of the Day and Low of the day Time and Price Fractal Studies is an indicator that will help you identify certain patterns that tend to repeat themseleves at certail times of the day or at certain prices.  It is used to study Daily Highs ad Lows in relation to time and price.  You will get to answer certail questions like: At what time of day does this market usually turn around. At what price does the market turn. Is it at round numbers etc
FREE
nuestro indicador   Basic Support and Resistance   es la solución que necesita para aumentar su análisis técnico.Este indicador le permite proyectar niveles de soporte y resistencia en el gráfico/ mt4 gratuita características Integración de los niveles de Fibonacci: Con la opción de mostrar los niveles de Fibonacci junto con los niveles de soporte y resistencia, nuestro indicador le brinda una visión aún más profunda del comportamiento del mercado y las posibles áreas de inversión. Optimiza
Ignition
Dansie Software Limited
Strategy Overview The Ignition EA tries to take advantage of sudden momentum when the Ignition pattern is detected. The final bar in the ignition pattern has a small opening wick, a very little or no closing wick, is large in comparison to recent bars and must start from the lower end of the current range (for a bullish ignition) Quick Testing Use Symbol EURUSD, Timeframe M2, and remove the GBPUSD symbol from the "Symbols" input (stratergy 1 and stratergy 2) Settings The below settings
The rubdfx divergence indicator is a technical analysis tool that compares a security's price movement. It is used to identify potential changes in the price trend of a security. The indicator can be applied to any type of chart, including bar charts and candlestick charts. The algorithm is based on MACD, which has been modified to detect multiple positive and negative divergences. Settings  ___settings___ * fastEMA * slowEMA * signalSMA *Alerts:   True/False     #Indicator Usage B
The indicator identifies critical support and resistance areas. It also can give alerts and notifications to your mobile. A lot of customization options are available: You can have different timeframe on your current chart. For example, if your current chart timeframe is H1, you can assign the indicator timeframe to M15.The indicator identifies critical support and resistance areas. It also can give alerts and notifications to your mobile. A lot of customizations are available. There is an opti
ArcTracer
Syed Oarasul Islam
This Indicator draws Fibonacci Arc levels in two different ways. You can select whether to draw Fibonacci Arc levels based on your favourite ZigZag settings or you can let the indicator to draw Arc levels based on given number of bars or candles.  You can also set Mobile and Email notification for your favourite Arc levels individually. With this indicator you will not have to feel lonely as the it can generate Voice alerts, which will keep you focused on your trading and remove boredom.  Produc
Market Ticker Pro MT5
John Louis Fernando Diamante
The only Market Ticker on the market! Add a professional novelty to your workspace, with built in mini-charts A scrolling Market Ticker that displays price changes from all symbols in the Market Watch list. Provides an easy snapshot of symbol prices, and keeps scrolling automatically while you trade and analyse the chart. The ticker color (+/- price changes) are based on either the current or completed candle, and the previous candle. Options include: - MTF, eg choose to show price changes o
Harmonic Pro
Kambiz Shahriarynasab
Only 5 copies of the EA at $30! Next price --> $45 Find charts and signals based on harmonic patterns, which work great in 1-hour timeframes and up. Buy and sell signs based on different harmonic patterns as follows: 0: ABC_D 1: ABCD_E 2: 3Drive 3: 5_0 4: Gartley 5: Bat 6: Crab 7: Butterfly 8: Cypher 9: NenStar 10: Shark 11: AntiBat 12: AntiGartley 13: AntiCrab 14: AntiButterfly 15: AntiCypher 16: AntiNenStar 17: AntiShark How to use: When there is an opportunity to
M & W Pattern Pro is an advanced scanner for M and W patters , it uses extra filters to ensure scanned patterns are profitable. The indicator can be used with all symbols and time frames. The indicator is a non repaint indicator with accurate statistics calculations. To use , simply scan the most profitable pair using the statistics dashboard accuracy , then enter trades on signal arrow and exit at the TP and SL levels. STATISTICS : Accuracy 1 : This is the percentage of the times price hit
Orion Dynamic Keltner
Joao Paulo Botelho Silva
Theoretical Foundation   The Keltner Channels are channels ploted using volatility deviations above and bellow a moving average. The indicator is an excellent tool to help the trader build trend and mean-reversion strategies.   Parameters   The Orion Dynamic Keltner allows the user to select the Volatility Calculation Type, being ATR or Average Range (not considering price gaps). Also, the user can select the Calculation Period, Number of Deviations, Moving Average Mode and the Moving Average Ca
Los compradores de este producto también adquieren
Atomic Analyst MT5
Issam Kassas
5 (14)
En primer lugar, vale la pena enfatizar que este Indicador de Trading no repinta, no redibuja y no se retrasa, lo que lo hace ideal tanto para el trading manual como para el automatizado. Manual del usuario: configuraciones, entradas y estrategia. El Analista Atómico es un Indicador de Acción del Precio PA que utiliza la fuerza y el impulso del precio para encontrar una mejor ventaja en el mercado. Equipado con filtros avanzados que ayudan a eliminar ruidos y señales falsas, y aumentan el poten
Primero que todo, vale la pena enfatizar que este Sistema de Trading es un Indicador No Repintado, No Redibujado y No Retrasado, lo que lo hace ideal tanto para el trading manual como para el automatizado. Curso en línea, manual y descarga de ajustes preestablecidos. El "Sistema de Trading Inteligente MT5" es una solución completa de trading diseñada para traders nuevos y experimentados. Combina más de 10 indicadores premium y presenta más de 7 estrategias de trading robustas, lo que lo convie
FX Power MT5 NG
Daniel Stein
5 (5)
Obtenga su actualización diaria del mercado con detalles y capturas de pantalla a través de nuestro Morning Briefing aquí en mql5 y en Telegram ! FX Power MT5 NG es la nueva generación de nuestro popular medidor de fuerza de divisas, FX Power. ¿Y qué ofrece este medidor de fuerza de nueva generación? Todo lo que le encantaba del FX Power original PLUS Análisis de fuerza de ORO/XAU Resultados de cálculo aún más precisos Períodos de análisis configurables individualmente Límite de cálculo persona
Quantum Trend Sniper
Bogdan Ion Puscasu
4.91 (43)
Introduciendo       Indicador Quantum Trend Sniper   , el innovador indicador MQL5 que está transformando la forma en que identificas y negocias los cambios de tendencia. Desarrollado por un equipo de comerciantes experimentados con experiencia comercial de más de 13 años,       Indicador de francotirador de tendencia cuántica       está diseñado para impulsar su viaje comercial a nuevas alturas con su forma innovadora de identificar cambios de tendencia con una precisión extremadamente alta.
Reversal First Impulse levels (RFI)      INSTRUCTIONS        RUS       -       ENG              R ecommended to use with an indicator   -   TREND PRO -  Version MT4                 A key element in trading is zones or levels from which decisions to buy or sell a trading instrument are made. Despite attempts by major players to conceal their presence in the market, they inevitably leave traces. Our task was to learn how to identify these traces and interpret them correctly. Main functions:: Di
Trend Screener Pro MT5
STE S.S.COMPANY
4.88 (64)
Desbloquee el poder del comercio de tendencias con el indicador Trend Screener: ¡su solución definitiva para el comercio de tendencias impulsada por lógica difusa y un sistema multidivisa!Mejore su comercio de tendencias con Trend Screener, el revolucionario indicador de tendencias impulsado por lógica difusa. Es un poderoso indicador de seguimiento de tendencias que combina más de 13 herramientas y funciones premium y 3 estrategias comerciales, lo que lo convierte en una opción versátil para co
Ante todo, vale la pena enfatizar que esta Herramienta de Trading es un Indicador No Repintado, No Redibujado y No Retrasado, lo que la hace ideal para el trading profesional. Curso en línea, manual del usuario y demostración. El Indicador de Conceptos de Acción del Precio Inteligente es una herramienta muy potente tanto para traders nuevos como experimentados. Combina más de 20 indicadores útiles en uno solo, combinando ideas avanzadas de trading como el Análisis del Trader del Círculo Inte
Gold Stuff mt5
Vasiliy Strukov
4.89 (178)
Gold Stuff mt5: un indicador de tendencia diseñado específicamente para el oro, también se puede usar en cualquier instrumento financiero. El indicador no se vuelve a dibujar ni se retrasa. El marco de tiempo recomendado es H1. IMPORTANTE! Póngase en contacto conmigo inmediatamente después de la compra para obtener instrucciones y bonificación!   Puede obtener una copia gratuita de nuestro indicador Strong Support y Trend Scanner, por favor envíe un mensaje privado. ¡a mí! PARÁMETROS Draw
FX Volume MT5
Daniel Stein
4.94 (17)
Obtenga su actualización diaria del mercado con detalles y capturas de pantalla a través de nuestro Morning Briefing aquí en mql5 y en Telegram ! FX Volume es el PRIMER y ÚNICO indicador de volumen que proporciona una visión REAL del sentimiento del mercado desde el punto de vista de un bróker. Proporciona una visión impresionante de cómo los participantes institucionales del mercado, como los brokers, están posicionados en el mercado Forex, mucho más rápido que los informes COT. Ver esta info
TPSproTREND PrO MT5
Roman Podpora
4.88 (8)
TPSpro TRENDPRO  - is a trend indicator that automatically analyzes the market and provides information about the trend and each of its changes, as well as giving signals for entering trades without redrawing! The indicator uses each candle, analyzing them separately. referring to different impulses - up or down impulse. Exact entry points into transactions for currencies, crypto, metals, stocks, indices!  -  Version MT4               DETAILED DESCRIPTION               R ecommended to use with
FxaccurateLS
Shiv Raj Kumawat
WHY IS OUR FXACCCURATE LS MT5 THE PROFITABLE ? PROTECT YOUR CAPITAL WITH RISK MANAGEMENT Gives entry, stop and target levels from time to time. It finds Trading opportunities by analyzing what the price is doing during established trends. POWERFUL INDICATOR FOR A RELIABLE STRATEGIES We have made these indicators with a lot of years of hard work. It is made at a very advanced level. Established trends provide dozens of trading opportunities, but most trend indicators completely ignore them!
AW Trend Predictor MT5
AW Trading Software Limited
4.78 (58)
La combinación de niveles de tendencia y ruptura en un sistema. Un algoritmo de indicador avanzado filtra el ruido del mercado, determina la tendencia, los puntos de entrada y los posibles niveles de salida. Las señales indicadoras se registran en un módulo estadístico, que le permite seleccionar las herramientas más adecuadas, mostrando la efectividad del historial de señales. El indicador calcula las marcas Take Profit y Stop Loss. Manual e instrucciones ->   AQUÍ   / Versión MT4 ->   AQUÍ Có
ICT, SMC, SMART MONEY CONCEPTS, SMART MONEY, Smart Money Concept, Support and Resistance, Trend Analysis, Price Action, Market Structure, Order Blocks, BOS/CHoCH,   Breaker Blocks ,  Momentum Shift,   Supply&Demand Zone/Order Blocks , Strong Imbalance,   HH/LL/HL/LH,    Fair Value Gap, FVG,  Premium  &   Discount   Zones, Fibonacci Retracement, OTE, Buy Side Liquidity, Sell Side Liquidity, BSL/SSL Taken, Equal Highs & Lows, MTF Dashboard, Multiple Time Frame, BigBar, HTF OB, HTF Market Structure
Quantum Heiken Ashi PRO MT5
Bogdan Ion Puscasu
4.5 (8)
Presentamos el   Quantum Heiken Ashi PRO Diseñadas para brindar información clara sobre las tendencias del mercado, las velas Heiken Ashi son reconocidas por su capacidad para filtrar el ruido y eliminar las señales falsas. Diga adiós a las confusas fluctuaciones de precios y dé la bienvenida a una representación gráfica más fluida y confiable. Lo que hace que Quantum Heiken Ashi PRO sea realmente único es su fórmula innovadora, que transforma los datos de velas tradicionales en barras de colore
Easy By Sell is a market indicator for opening and closing positions. It becomes easy to track market entries with alerts. It indicates trend reversal points when a price reaches extreme values ​​and the most favorable time to enter the market. it is as effective as a Fibonacci to find a level but it uses different tools such as an algorithm based on ATR indicators and Stochastic Oscillator. You can modify these two parameters as you wish to adapt the settings to the desired period. My othe
Legacy of Gann for MT5
Pavel Zamoshnikov
5 (6)
The indicator very accurately determines the levels of the possible end of the trend and profit fixing. The method of determining levels is based on the ideas of W.D.Gann, using an algorithm developed by his follower Kirill Borovsky. Extremely high reliability of reaching levels (according to K. Borovsky  - 80-90%) Indispensable for any trading strategy – every trader needs to determine the exit point from the market! Precisely determines targets on any timeframes and any instruments (forex, met
"Piranha" - an autonomous trading system that determines overbought and oversold levels on the chart. Red and blue zones represent overbought and oversold levels respectively. Entry points are marked with arrows: a downward arrow in the red zone for "sell" and an upward arrow in the blue zone for "buy". The Take profit level is indicated by the green moving average. Key features: Adjusting the Take profit level as the green moving average changes position. Averaging ability when a new market e
Conviértase en un Breaker Trader y obtenga beneficios de los cambios en la estructura del mercado a medida que se invierte el precio. El indicador de ruptura de bloque de órdenes identifica cuándo una tendencia o movimiento de precio se acerca al agotamiento y está listo para revertirse. Le alerta sobre cambios en la estructura del mercado que generalmente ocurren cuando una reversión o un retroceso importante están a punto de suceder. El indicador utiliza un cálculo patentado que identific
Este es un genial indicador para MT5 que ofrece señales precisas para entrar en una transacción sin redibujar. Se puede aplicar a cualquier activo financiero: fórex, criptomonedas, metales, acciones, índices. Nos dará valoraciones bastante precisas y nos dirá cuándo es mejor abrir y cerra una transacción. Eche un vistazo  al vídeo  (6:22), ¡contiene un ejemplo de procesamiento de una sola señal que ha amortizado el indicador! La mayoría de los tráders mejoran sus resultados comerciales durante l
IX Power MT5
Daniel Stein
5 (3)
IX Power   lleva por fin la insuperable precisión de FX Power a los símbolos que no son de Forex. Determina con exactitud la intensidad de las tendencias a corto, medio y largo plazo de tus índices, acciones, materias primas, ETF e incluso criptodivisas favoritas. Puede   analizar todo lo   que su terminal le ofrece. Pruébalo y experimenta cómo   tu timing mejora significativamente   a la hora de operar. Características principales de IX Power Resultados de cálculo 100% precisos y sin rep
Bill Williams Advanced
Siarhei Vashchylka
5 (5)
Bill Williams Advanced is designed for automatic chart analysis using Bill Williams' "Profitunity" system. The indicator analyzes four timeframes at once. Manual (Be sure to read before purchasing) Advantages 1. Automatically analyzes the chart using the "Profitunity" system of Bill Williams. The found signals are placed in a table in the corner of the screen. 2. Equipped with a trend filter based on the Alligator indicator. Most of the system signals are recommended to be used only accordi
TPA True Price Action indicator reveals the true price action of the market makers through 100% non-repainting signals strictly at the close of a candle! TPA shows entries and re-entries, every time the bulls are definitely stronger than the bears and vice versa. Not to confuse with red/green candles. The shift of power gets confirmed at the earliest stage and is ONE exit strategy of several. There are available now two free parts of the TPA User Guide for our customers. The first "The Basics"
** All Symbols x All Timeframes scan just by pressing scanner button ** ***Contact me after purchase to send you instructions and add you in "123 scanner group" for sharing or seeing experiences with other users. After 17 years of experience in the markets and programming, Winner indicator is ready. I would like to share with you! Introduction The 123 Pattern Scanner indicator with a special enhanced algorithm is a very repetitive common pattern finder with a high success rate . Interestingly,
¡La mejor solución para cualquier operador novato o experto! Este indicador es una herramienta única, de alta calidad y asequible porque hemos incorporado una serie de características propias y una nueva fórmula. ¡Con sólo UN gráfico puede leer la Fuerza de la Divisa para 28 pares de Divisas! Imagínese cómo mejorará su operativa porque podrá señalar el punto exacto de activación de una nueva tendencia o de una oportunidad de scalping. Manual del usuario: haga   clic aquí Ese es el primero
Este tablero muestra los últimos   patrones armónicos   disponibles para los símbolos seleccionados, por lo que ahorrará tiempo y será más eficiente /   versión MT4 . Indicador gratuito:   Basic Harmonic Pattern Columnas del indicador Symbol:   aparecerán los símbolos seleccionados Trend :   alcista o bajista Pattern :   tipo de patrón (gartley, mariposa, murciélago, cangrejo, tiburón, cifrado o ABCD) Entry :   precio de entrada SL:   precio de stop loss TP1:   1er precio de toma de benefici
Próxima generación de zonas de oferta y demanda automatizadas. Algoritmo nuevo e innovador que funciona en cualquier gráfico. Todas las zonas se crean dinámicamente de acuerdo con la acción del precio del mercado. DOS TIPOS DE ALERTAS --> 1)CUANDO EL PRECIO LLEGA A UNA ZONA 2)CUANDO SE FORMA UNA NUEVA ZONA No obtienes un indicador inútil más. Obtiene una estrategia comercial completa con resultados probados.     Nuevas características:     Alertas cuando el precio llega a la z
AW Prime Oscillator MT5
AW Trading Software Limited
Una combinación de dos osciladores. El primero muestra los puntos de entrada, el segundo muestra la tendencia actual. El indicador puede mostrar señales de oscilador mediante flechas en dos modos, todas señales de oscilador rápido o señales solo en la dirección de la tendencia actual. Tiene un panel de múltiples períodos de tiempo y tres tipos de notificaciones de señales. Beneficios: Adecuado para operaciones intradía y especulación. Filtrado de tendencias Configuración sencilla y sensible Pane
Owl Smart Levels MT5
Sergey Ermolov
4.38 (37)
Versión MT4  |  FAQ El Indicador Owl Smart Levels es un sistema comercial completo dentro de un indicador que incluye herramientas de análisis de mercado tan populares como los fractales avanzados de Bill Williams , Valable ZigZag que construye la estructura de onda correcta del mercado y los niveles de Fibonacci que marcan los niveles exactos de entrada. en el mercado y lugares para tomar ganancias. Descripción detallada de la estrategia Instrucciones para trabajar con el indicador Asesor de c
El indicador de reversión de ADR le muestra de un vistazo dónde se cotiza actualmente el precio en relación con su rango diario promedio normal. Recibirá alertas instantáneas a través de una ventana emergente, correo electrónico o push cuando el precio exceda su rango promedio y los niveles por encima de su elección para que pueda saltar rápidamente a retrocesos y reversiones. El indicador dibuja líneas horizontales en el gráfico en los extremos del rango promedio diario y también extensiones p
Introducing the South African Sniper indicator created by a small group of traders with a few years trading trading the financial market profitably . This is a plug and play indicator that provides you with  BUY and SELL (SNIPER ENTRY) signals with TARGET and trail stops. The indicator Works with all MT5 trading instruments. The indicator uses previous  chart data as receipt to speculate on future market moves.  "The South African Sniper indicator community are very happy with the indicator an
Otros productos de este autor
Si estás buscando un indicador confiable para operar con el concepto ICT, la Estructura de Mercado ICT proporciona un manual de usuario para los traders que utilizan estrategias más avanzadas. Este indicador todo en uno se enfoca en los Conceptos ICT (Conceptos de Dinero Inteligente). La Estructura de Mercado ICT intenta comprender cómo operan las instituciones, ayudando a predecir sus movimientos. Al comprender y utilizar esta estrategia, los traders pueden obtener valiosos conocimientos sobre
Filtro:
No hay comentarios
Respuesta al comentario