RVi Oscillator Breakout
- Indicadores
- Mohamed Hassan Mohamed Hassan Alsherbiny
- Versión: 4.0
- Actualizado: 8 julio 2024
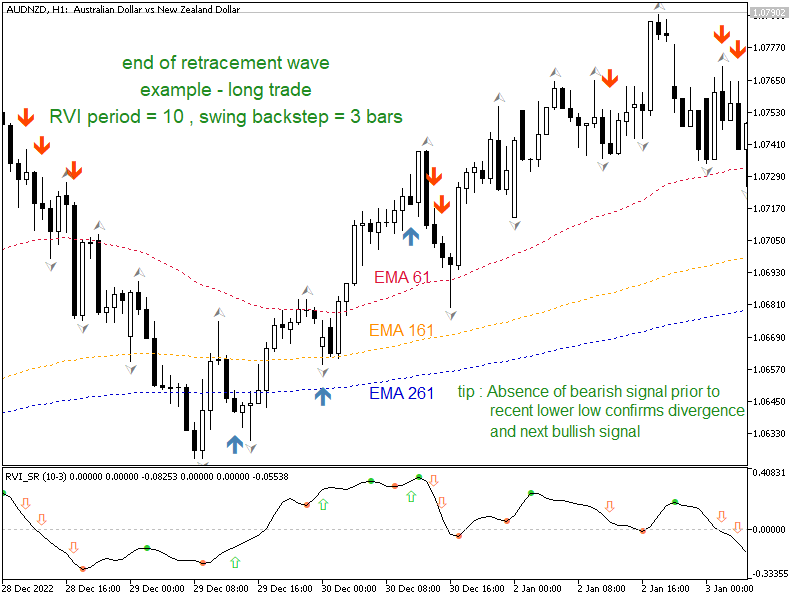
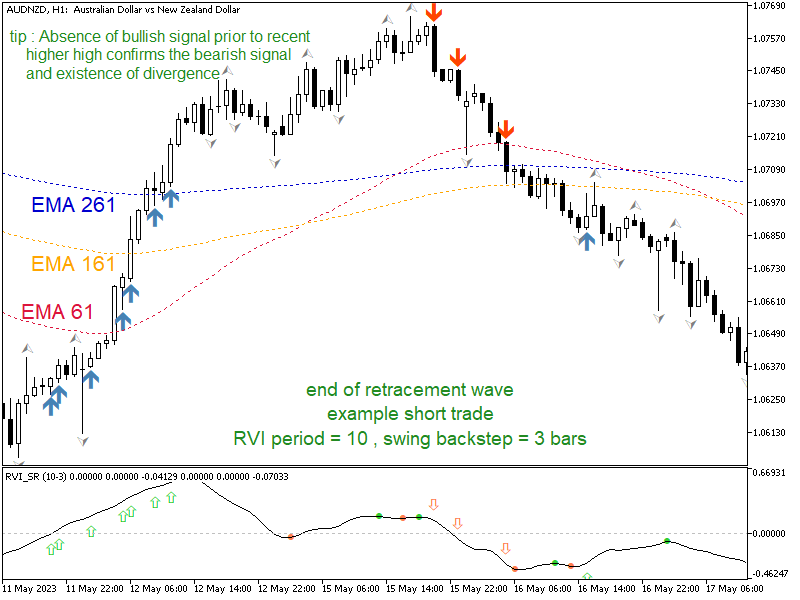
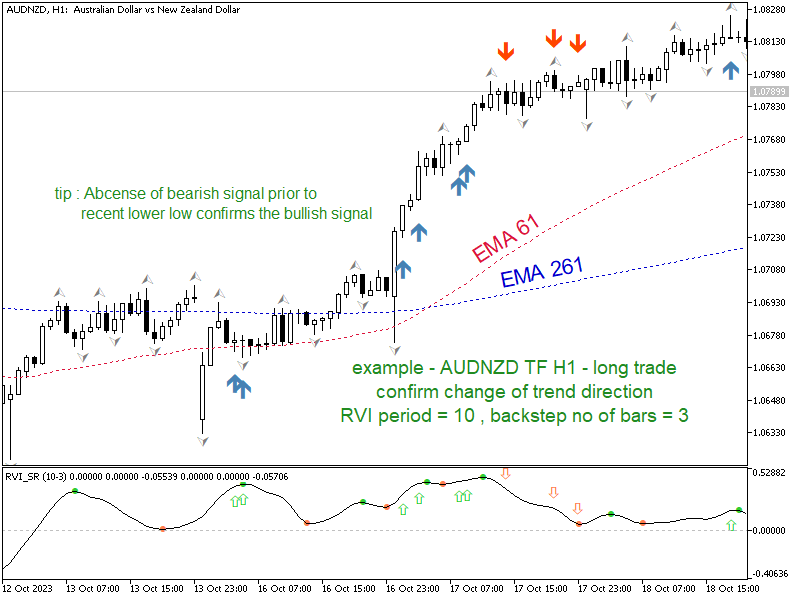
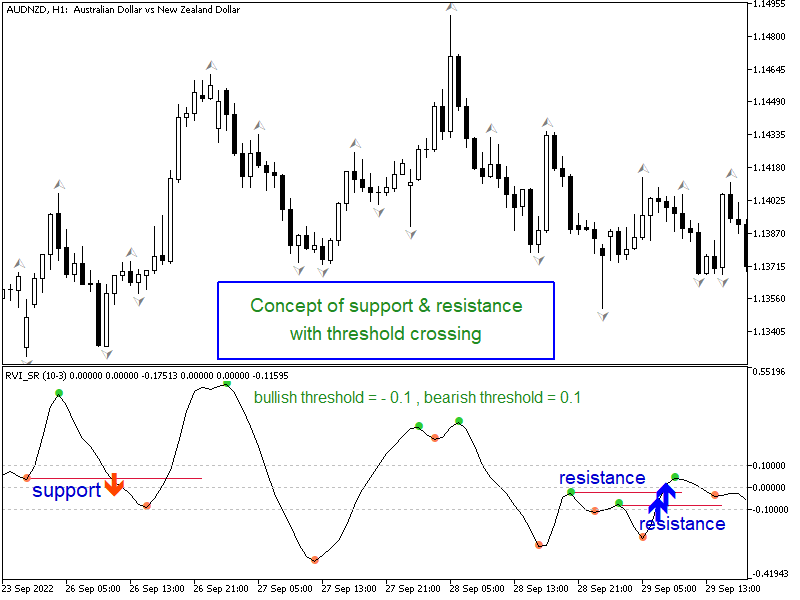
Probability emerges to record higher prices when RVi breaks out oscillator historical resistance level. It's strongly encouraged to confirm price breakout with oscillator breakout since they have comparable effects to price breaking support and resistance levels; surely, short trades will have the same perception.
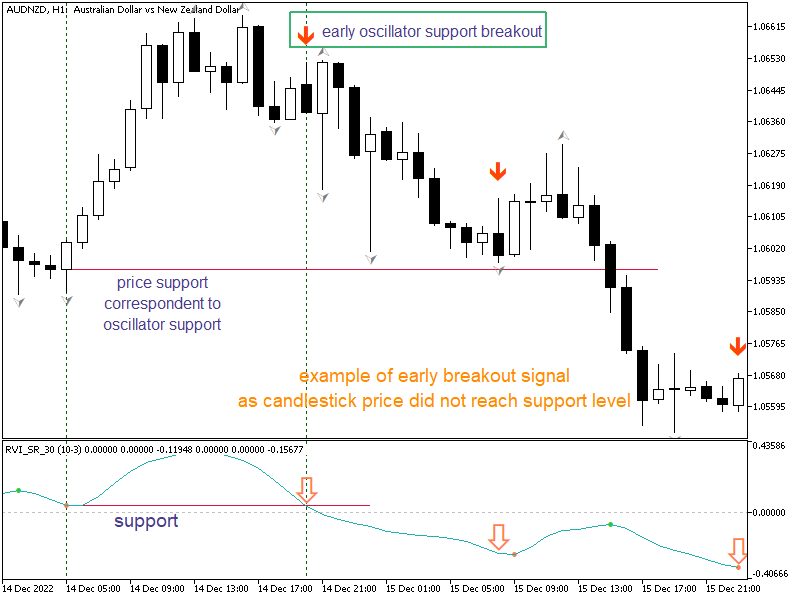
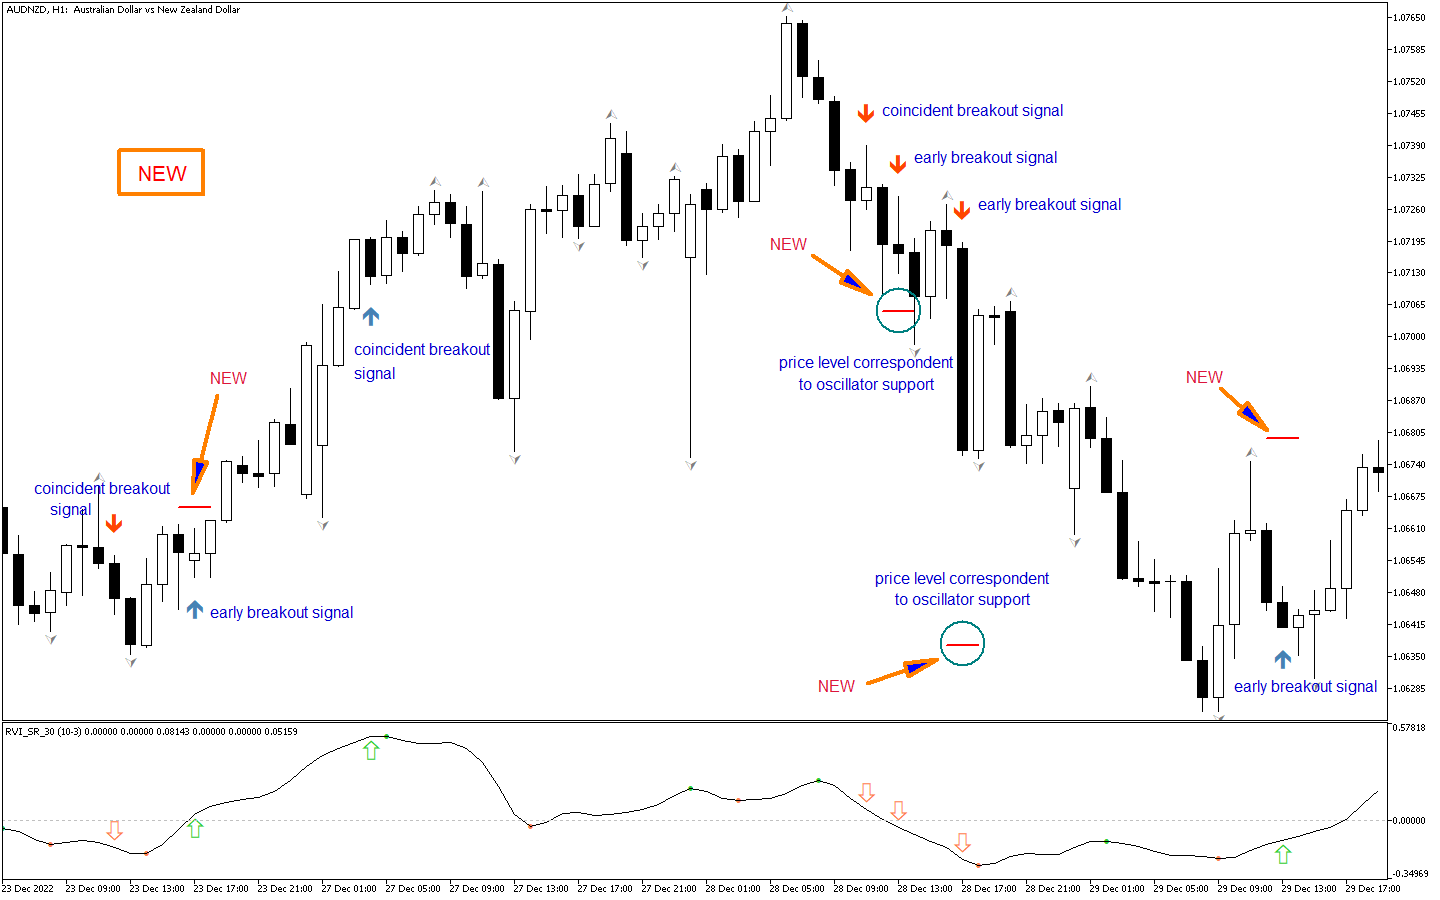
As advantage, a lot of times oscillator breakout precedes price breakout as early alert to upcoming event as illustrated by last screenshot. Furthermore, divergence is confirmed in case of absence of continuation signal prior to highest high or lowest low and reversal signal is encountered.
Thresholds have been provided to utilize if required, but remember to disable when looking for the earliest reversal signal.
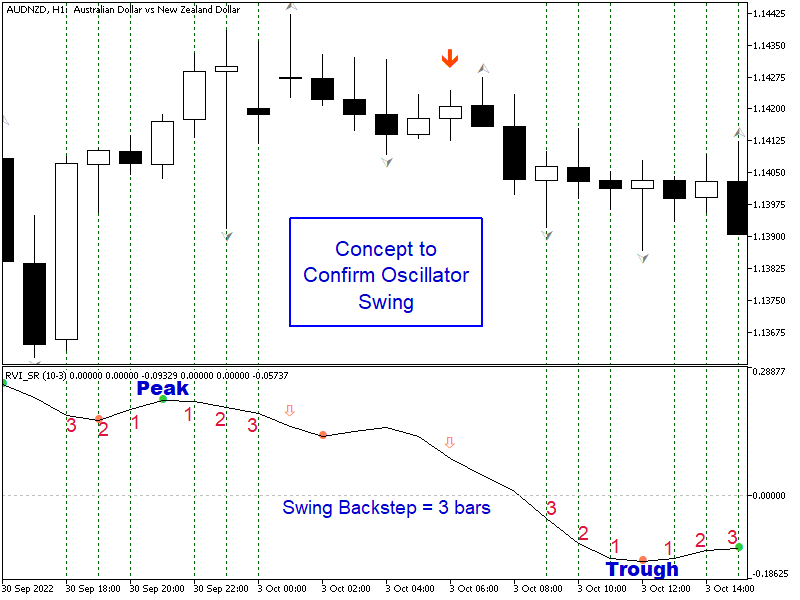
Concept is based on find swing levels which based on number of bars by each side of peak or trough - as mentioned by the fourth screenshot - and in turn subjected to change by indicator settings "swing backstep".
Indicator signals are shown only on chart window; separate window shown by screenshots depicted only for illustration purpose; however, in case of desire to have signals displayed in separate window, pertained indicator could be found at https://www.mql5.com/en/market/product/117795/
Indicator recommended to be used coinciding with other indicators for price support and resistance, supply & demand zones, and/or trend indicator/s
Having desire to use the indicator in your EA, consider buffer no 0 for long trades, and buffer no 1 for short trades
indicator setting:
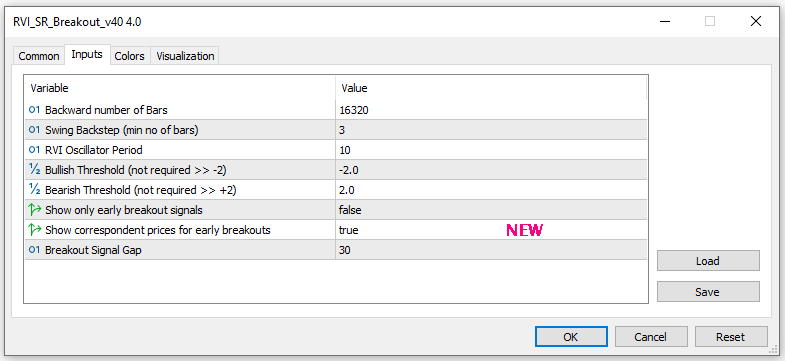
- Backward number of Bars : No of backward bars in demand to analyse by indicator
- Swing Backstep (min no of bars) : minimum no of bars to form peak or trough by each side
- RVi Oscillator Period : No of bars to calculate RVi values
- Bullish Threshold (if not required >> -2.0) : minimum RVi value to consider overbought and display signal; having no desire to use threshold and display signals of any breakout, use a very low value (ex. -2.0)
- Bearish Threshold (if not required >> +2.0) : maximum RVi value to consider oversold and display signal; having no desire to use threshold and display signals of any breakout, use a very high value (ex. +2)
- Show only early breakout signals : Only display oscillator breakouts when coincides with delay of price breakout (if required).
- (NEW) Show correspondent prices for early breakouts : show price levels corresponding to oscillator broken levels
- Breakout Arrow Gap : Controls the distance between signal arrow and bar wick
Note:
No indicator will guarantee 100% of wining trades, but trader shall backtest for optimized setting in conjunction with other indicators
MT4 version available at https://www.mql5.com/en/market/product/120684


Great indicator and functionality. Been using it along with my current system for trading and it is working well.