John Carters TTM Squeeze Pro with MACD
- Indicadores
- Danil Poletavkin
- Versión: 1.1
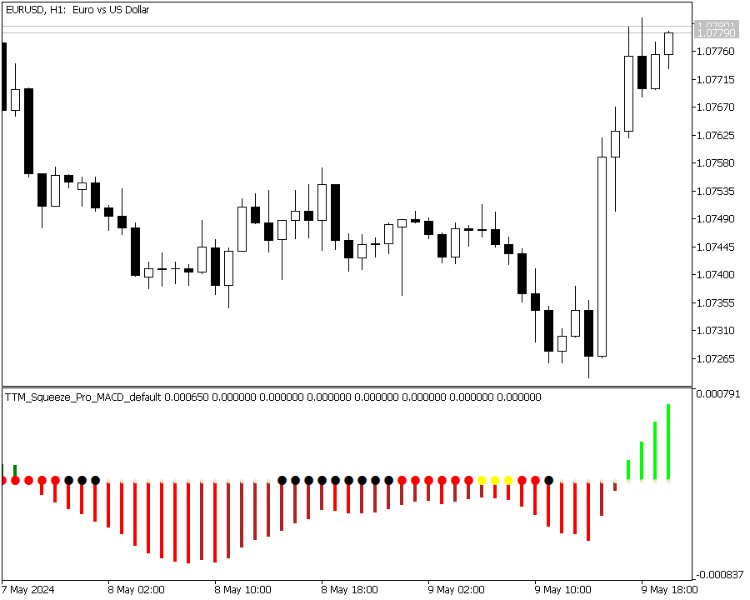
This is actually just a combination of 3 classic TTM_Squeeze indicators, nothing special. As I know exactly this is implemented in original TTM_Squeeze PRO indicator. It shows strong, middle and weak squeeze.
If someone interested, TTM_Squeeze is not completely John Carter's invention. Concept of squeeze is commonly known as well as the method of squeeze search using Bollinger Bands and Kelthner Channels.
How to use
As always there is a lot of variations. For example here is simple strategy
- Use charts H1 and higher. Better to use Daily charts. Never use use 1min, 5min charts.
- Wait for 3 red dots
- After 3 red dots appeared, wait for the bar closing upper or lower of Bollinger Bands. The bar should close above/below band, not touch it.
- If dot on that bar is not red anymore, but black or white, enter in market
- Place your stop on 3 times 14th period ATR. Another option is to place your stop on the opposite band.
- Start to move your stop when opposite band become equal to you entry price
- Trail your stop with opposite band
- Make decision of taking profits on 1:1 risk reward ratio
- Price can have deep pullbacks and can return to your entry price. Do not exit from the position, exit with profit or on the stop loss.
You can read more about squeeze trading method in John Bollinger's book.

