DYJ SignalSourceOfMACD
- Indicadores
- Daying Cao
- Versión: 2.15
- Actualizado: 26 junio 2024
- Activaciones: 5
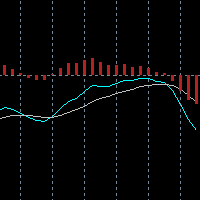
The DYJ SignalSourceOfMACD is based on the MACD indicator. Generally, signals are generated when crossing the MACD and SIGNAL lines of the MACD indicator.
Signals to buy are generated if the MACD line crosses over the SIGNAL line in the negative area below the MACD open level. The negative area is where the values of MACD and SIGNAL lines are below zero.
The MACD open level parameter is set in pips. However, in the code it is converted as follows: MACD Open level * Instrument.PipSize. For example, if you set the value to "3" and use the strategy on EUR/USD, the MACD open level will equal to 0.0003 (3 pips * 0.0001 pip size). Note that the parameter is interpreted as a negative value for signals to buy.
Signals to sell are generated if the MACD line crosses under the SIGNAL line in the positive area above the MACD open level. The positive area is where the values of MACD and SIGNAL lines are above zero.
Please use the high-probability opening parameter OpenLevel($) to control the opening position, which determines the depth of buying low and selling high, thereby giving you a chance to make greater profits!
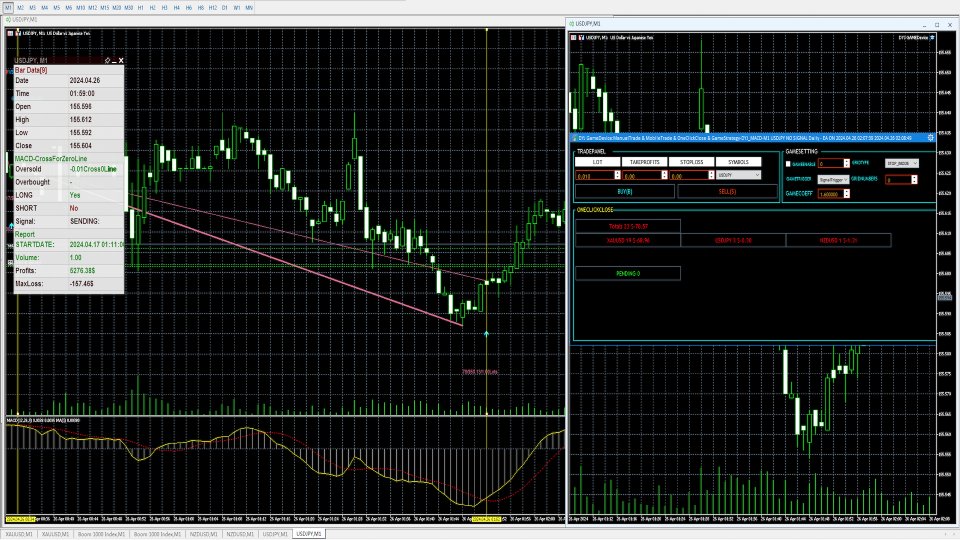
And these BUY and SELL signals are sent out. You can use DYJ Follow Me or Better DYJ GameDevice follow-up software to receive these signals and realize automatic opening and closing of positions. And can use the game strategy function to turn losing orders into profits.
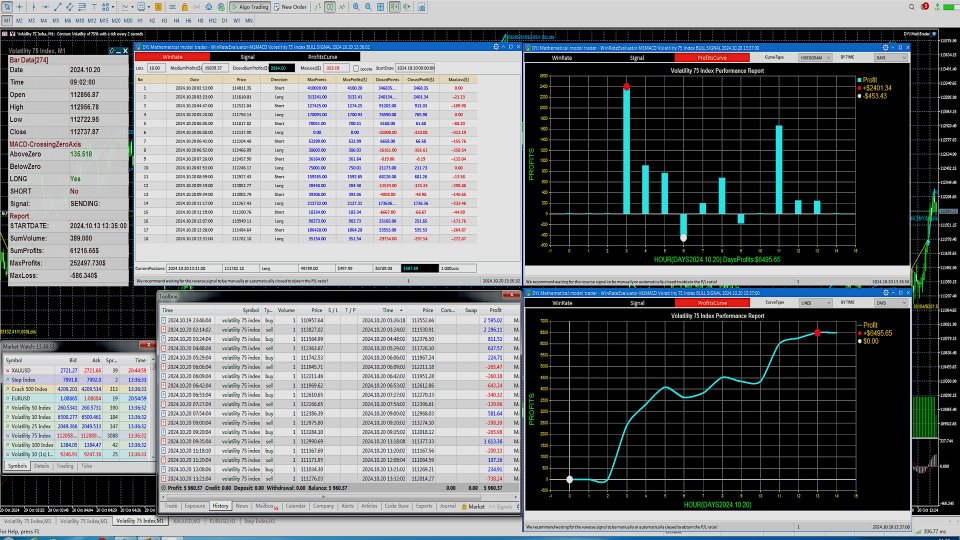
You can use the DYJ Mathematical model trader indicator trading analysis model to display the indicator's real trading opening and closing positions and calculate the overall profit and maximum floating loss!
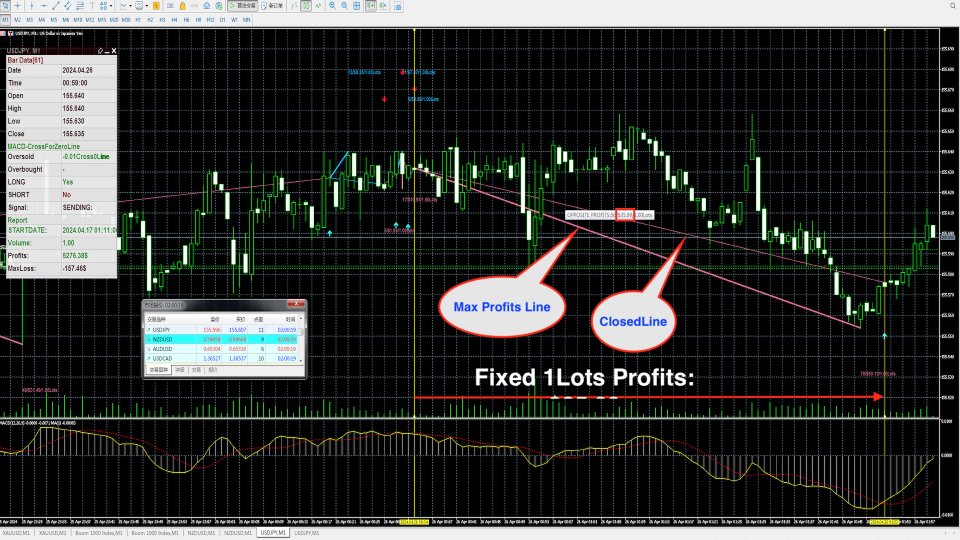
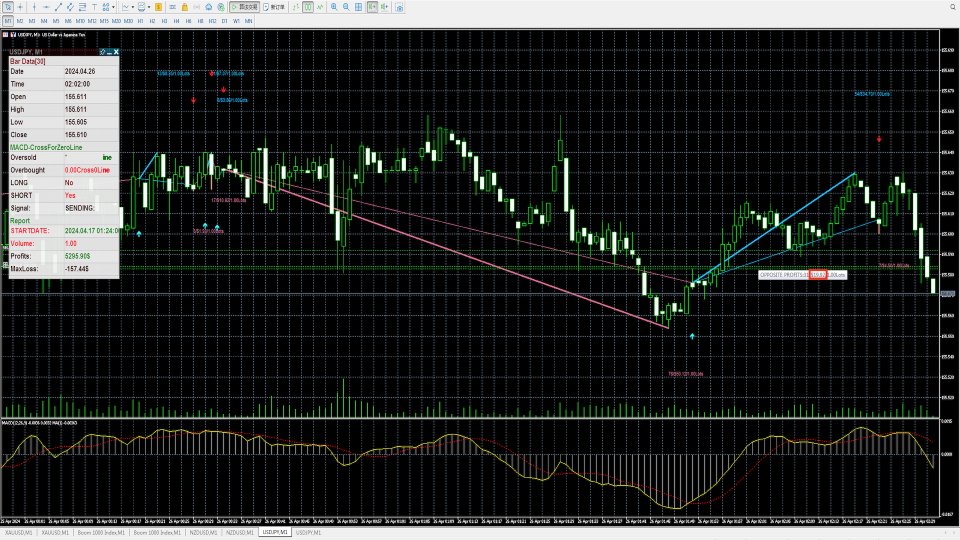
In addition, the DYJ SignalSourceOfMACD oscillator also marks the entry point and exit point with colored arrows, and also counts the total profit and the maximum floating loss in real time based on these positions, which are important data for judging the trading probability.
Input
[General]
- InpUseLanguage = English/Chinese
-
signal_source_name="MACD"
[Indicator]
- fast_ema_period=12 -- FAST PERIOS
- slow_ema_period=26 -- SLOW PERIOD
- signal_period=9 -- SIGNAL PERIOD
- price_field=PRICE_CLOSE -- PriceField
- InpMACDOpenLevel = 0.03 -- OpenLevel($)0.03
- InpMACDCloseLevel = 0.02 -- CloseLevel($)0.02
- InpSignalMode = CrossForZeroLine; // Signal Mode
CrossForZeroLine = 0 -- Cross ZeroLine:
The death cross above the zero line is short, and the golden cross below the zero line is long.
CrossOnly = 1 -- Cross Only:
Only the cross pattern does not distinguish the zero axis; the golden cross means long, and the dead cross means short
InZearLineArea = 2 -- In ZearLine Area :
The MACD line crossing the zero axis is the dividing line between long and short. There are long positions above the 0 axis and short positions below the 0 axis. It is recommended that fast_ema_period=55, slow_ema_period=89, signal_period=1
- InpSimulatedVolume = 1 -- Lots
- InpOnlyOppositeClosedLine = false
- InpIsDisplayChartText = true
- InpIsDisplayProfitsLine = true
- MaxProfitsTextHigh = 40
- MaxProfitsTextLow = 20
- UpLineClr = DeepSkyBlue // Arrow Up Color
- DnLineClr = PaleVioletRed // Arrow Down Color
- alertsMessage = true
- alertsSound = true
- alertsEmail = false
- alertsPush = false
- InpIsMultipleLinesTextForAlertsMessage = true

