• Información general
  • Comentarios
  • Discusión
  • Novedades

Dashboard Multi Currency MTF Stochastic

Con esta herramienta comercial, puede escanear 15 mercados simultáneamente.

Presentamos el nuevo indicador comercial 2024:

➡️ Tablero Estocástico de marco de tiempo múltiple y moneda múltiple.

Hay al menos dos razones por las que creé esta herramienta comercial:

Primero, estoy aburrido de observar sólo un mercado.
En segundo lugar, no quiero perder el momento de entrada en otro mercado.

Por eso quiero conocer al mismo tiempo otras condiciones del mercado.

Por este motivo, necesito un escáner que pueda escanear las condiciones de varios mercados simultáneamente.

A menudo busco mercados donde la línea principal estocástica > (o <=) línea de señal estocástica comienza desde M1 hasta H4 (o simplemente desde M1 hasta M30).

Si está de acuerdo con mi análisis, entonces este es el indicador comercial que ha estado buscando.

No se pierda el momento en que las condiciones del mercado cumplan con los requisitos anteriores.

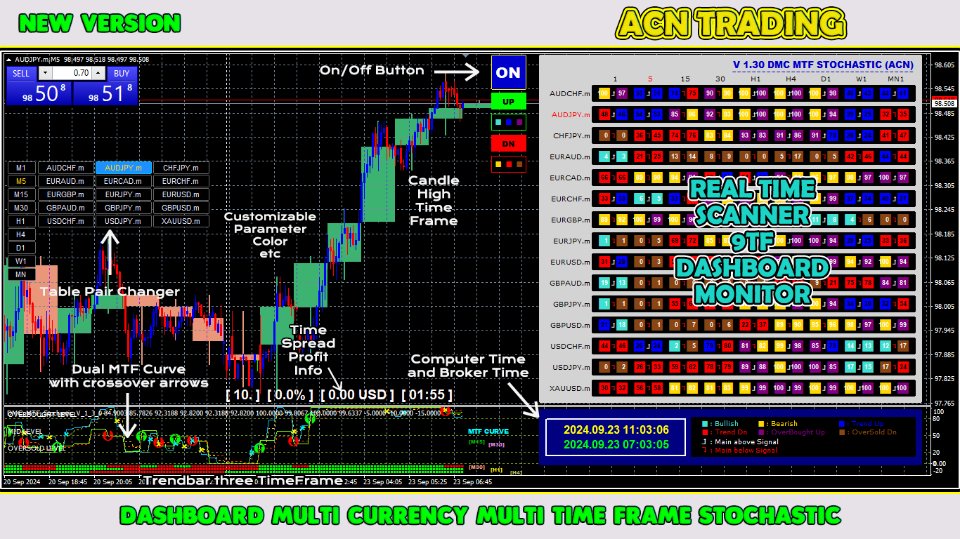
Este es un escáner o tablero de estocástico con muchas características excelentes:

Puede mostrar los datos de la línea principal estocástica.
Puede mostrar los datos de la línea de señal estocástica.
Puede mostrar la posición de la línea principal estocástica y la línea de señal (línea principal encima de la línea de señal o línea principal debajo de la línea de señal)
Puede mostrar el nivel de datos tanto de la línea principal estocástica como de la línea de señal (alcista, bajista, tendencia al alza, tendencia a la baja, sobrecompra pero aún al alza y sobreventa pero aún a la baja).
Puede mostrar datos en tiempo real desde M1 a MN1
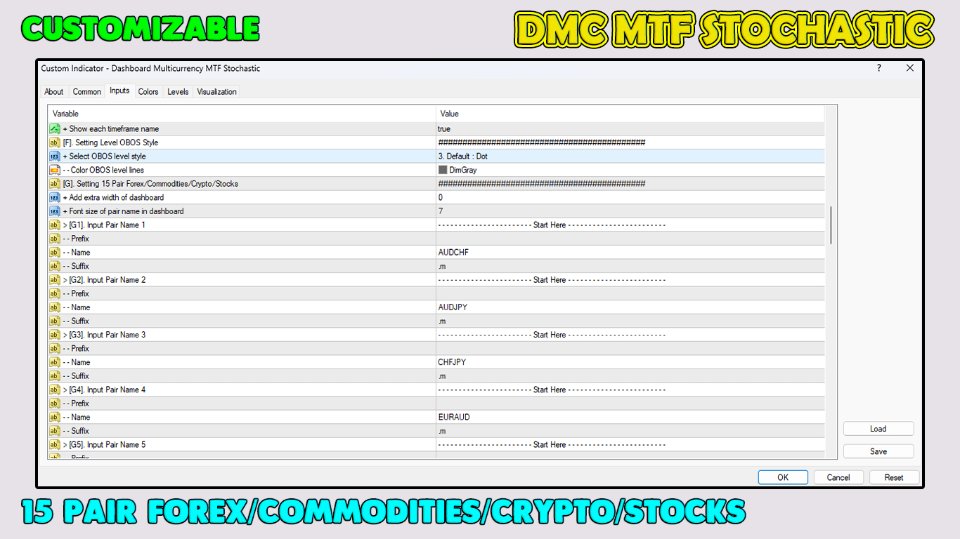
Puede mostrar los datos de 15 pares de divisas (forex/materias primas/criptomonedas/acciones multidivisa)
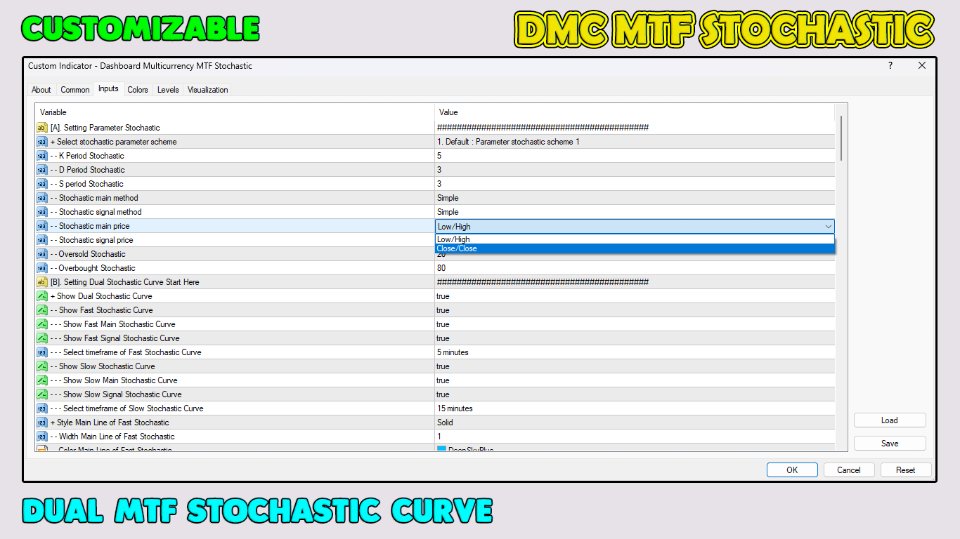
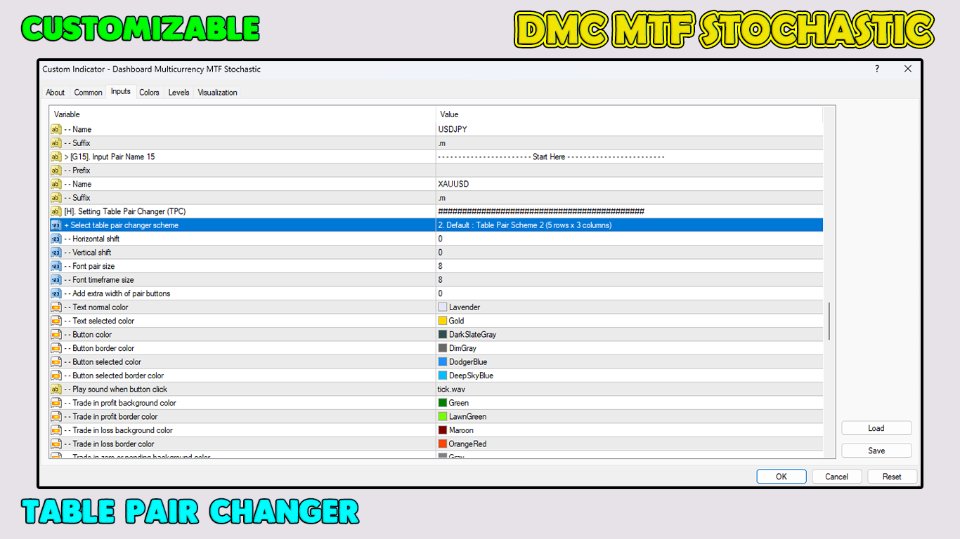
Parámetro personalizable
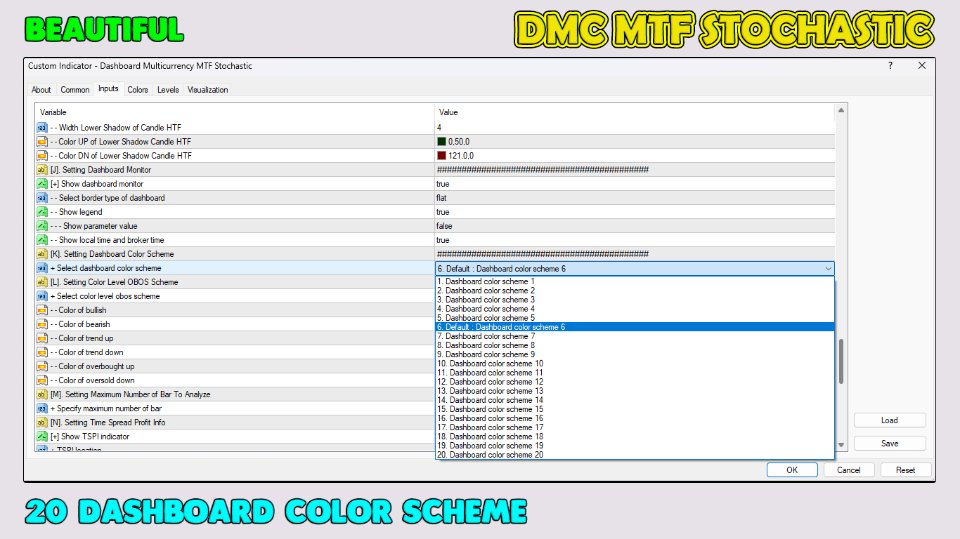
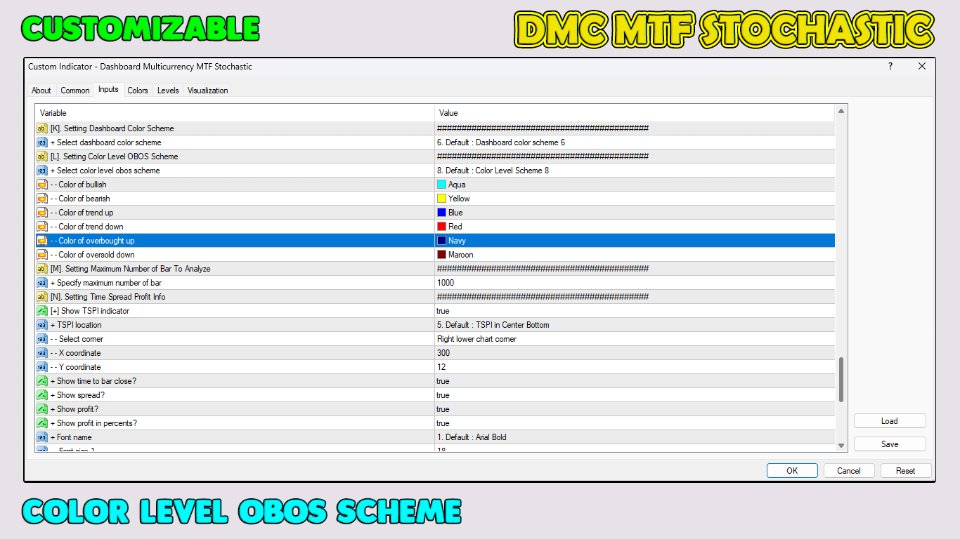
Nivel OBOS de color personalizable
Hermoso esquema de 20 colores para el tablero
Equipado con cambiador de pares de divisas on/off
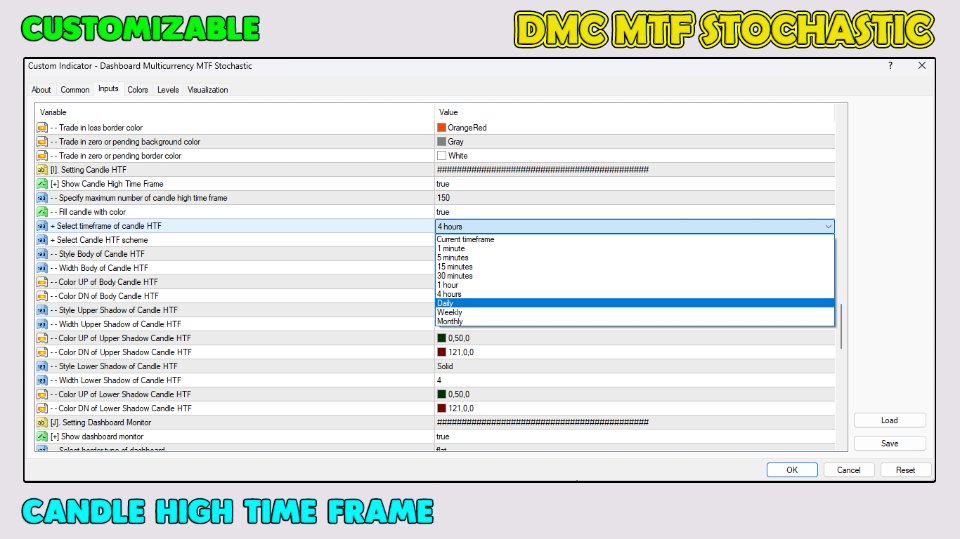
Equipado con vela marco de tiempo alto
Equipado con información de beneficios de distribución temporal
Equipado con la hora actual de la computadora local y la hora del corredor
Equipado con curva estocástica dual MTF
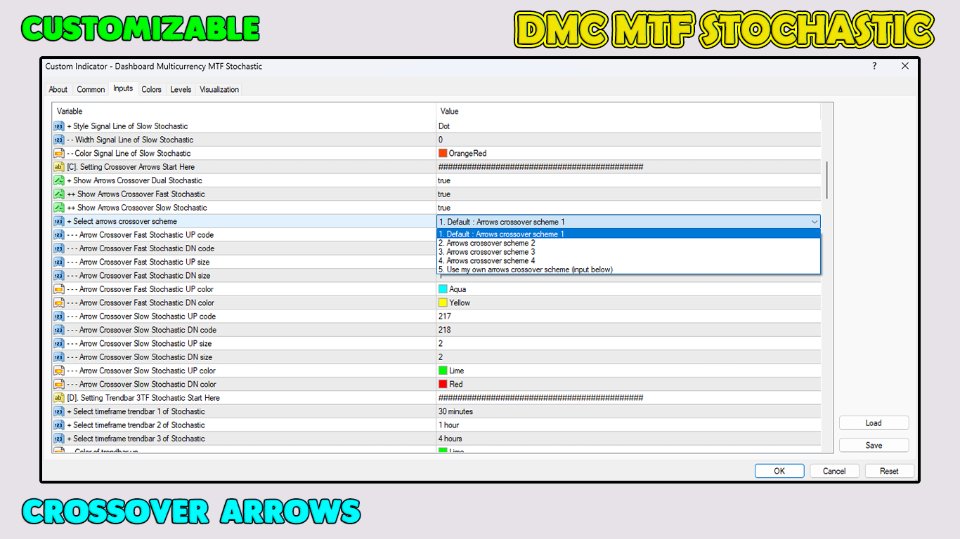
Equipado con flechas cruzadas de curva estocástica dual MTF
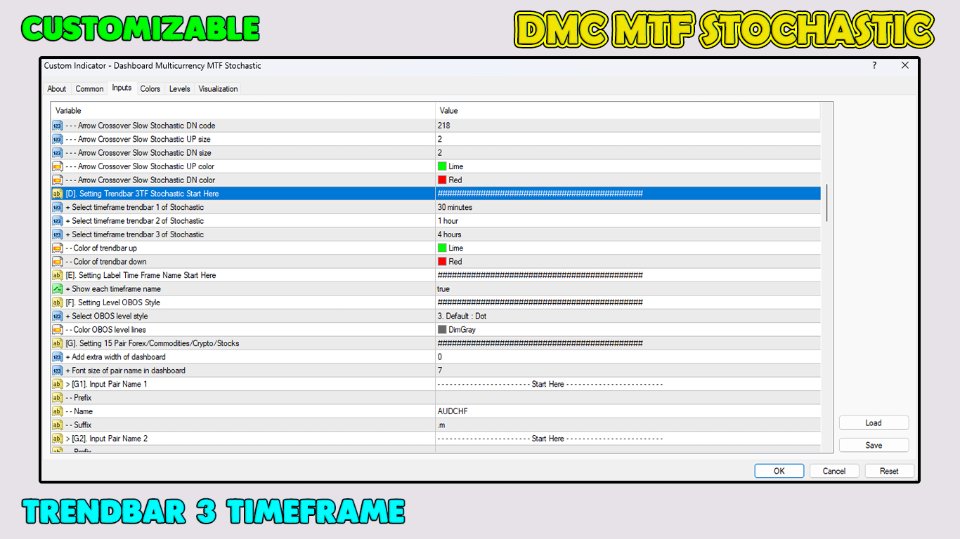
Equipado con barra de tendencia estocástica 3TF
Esta herramienta comercial es absolutamente lo que todo comerciante necesita.

Descárgalo hoy.

¡Haga entradas seguras y opere como un profesional!

Gracias.
Productos recomendados
PTW NON REPAINT TRADING SYSTEM + HISTOGRAM Non-Repainting ,   Non-Redrawing   and   Non-Lagging  Trading System. Does the following: - Gives Accurate Entry and Exit Points - Scalping, Day and Swing Trading  - 95% Accuracy  - Targets, where to take profits. - Shows Trends, Support and resistance levels - Works on All Brokers - Works on All Currencies, CFDs and Stocks - It does not place trades for you, it only shows you what trades to place. - It works on All Timeframes - It is for Trend or ra
Fibo Reversals is an indicator which has carefully been put together to attempt to indicate a time period in which an ongoing trend is most probably exhausted and a new trend (actually a reversal trend) inadvertently begins. At this, it should be okay for the manual trader to be on the look out for good trading opportunities. Input Settings Father Fibo  – This Input Determines The Highest Price For The Chosen Input Period. Son Fibo  - This Input Determines The Lowest Price For The Chosen Input
ToolBox 360 is the swiss knife of all indicators. It is full packed with useful tools to help you with your trading. It can be used to find best entry and exit points and help you to decide if you should open a trade or not. It shows market trends, candlestick formations outside / inside bars and you can sett time based allerts. Main features: Time based Fibonacci lines Choose a start and end time and the indicator shows you Fibonacci lines within the selected time range including range high
Valentines
Victor Golovkov
Valentines trend is an easy-to-use indicator that hides a powerful calculation math-system "under the hood". Attach the indicator to the chart and set the parameters. Period - period for tracking changes in quotes Amount of Bars - number of last bars to track You do not need to select any numerical parameters. The indicator will do everything for you automatically . Each signal is generated on the current bar, and in order not to miss it, use the built-in alerts and notifications system . The in
Dynamic SR Trend Channel Dynamic SR Trend Channel is a simple indicator for trend detection as well as resistance/support levels on the current timeframe. It shows you areas where to expect possible change in trend direction and trend continuation. It works with any trading system (both price action and other trading system that use indicators) and is also very good for renko charting system as well. In an uptrend, the red line (main line) serves as the support and the blue line serves as the
Pyro Trend
Oleksii Ferbei
Pyro Trend is a new product that allows you to identify the current market phase (uptrend, downtrend or flat). The indicator is applicable for any data and periods. The middle of the trend wave, as well as the edges, are places of special heat and market behavior; when writing the indicator, an attempt was made to implement precisely finding the middle. Pyro Trend is a trend indicator that uses an original calculation algorithm. This indicator paints arrows in different colors depending on th
ROC acceleration-deceleration is the manual system for medium-term scalping. Indicator based on custom ROC system which defines bullish/bearish market and especially  acceleration-deceleration of tendention in the market's main direction. Buy arrow is plotted during bearish market when current trend decelerates and sell  arrow is plotted during bullish market when current trend decelerates. Main Indicator's Features Signals are not repaint,non-late or disappear(exept cases when system recalculat
This indicator allows you to see the strength of the trend on all timeframes. It can be used for all currency pairs. The indicator can be displayed in the form of a column (from left to right): status buy / sell / strong buy / strong sell, strength of the trend in percentage, pips last candle, body candle now, remaining time, and the timeframe of M1 to MN. Information contained below (from left to right): total trend percent, sell percent, buy percent.
Sarangani Venom
Sherwin Dennis Tava Ruiz
sarangani venom is 100% profitable, easy to use indicator, a chart without indicator is stressful and will lead you to many losses, this indicator is pleasing to the eye that will gives you more confident to trade when there is signal, your computer will gives sound and the spider will animate, it can be used to all time frame and to all currency, you have many options, when the candlestick touches to upper line it is buy, when it touches to lower line it is sell, when the rope is pull to buy ar
Global Trend
Vitalii Zakharuk
Global Trend Indicator, shows the signals for entry. Displays both entry points and the trend itself. Shows statistically calculated moments for entering the market with arrows. When using the indicator, the risk factor can be optimally distributed. Settings: Uses all one parameter for settings. Choosing a parameter, it is necessary to visually resemble it so that the appropriate graph has a projection of extremes. Parameters: Length - the number of bars for calculating the indicator.
Drawing Pack
John Louis Fernando Diamante
4 (1)
This indicator provides several drawing tools to assist in various methods of chart analysis. The drawings will keep their proportions (according to their handle trendline) across different chart scales, update in real time, and multiple drawings are supported. # Drawing Option Description  1 Grid box draggable boxed grid, user defines rows x colums, diagonal ray option  2 Grid partial or fullscreen grid, sized by handle line  3 Grid flex a diagonal grid, sized and sloped by handle line
Colored indicator of the linear channel based on the Fibonacci sequence. It is used for making trading decisions and analyzing market sentiment. The channel boundaries represent strong support/resistance levels, as they are the Fibonacci proportion levels. Users can select the number of displayed lines of channel boundaries on the chart by means of the input parameters. Attaching multiple instances of the indicator to the chart with different calculation periods leads to displaying a system of c
CSS " currency strength slope "  is a a multi currency strength indicator that use Forex major currencies, EUR, USD, CAD, AUD, NZD, JPY, CHF, GBP. it use 28 major pairs to calculate the power of every currency using a based moving averages algorithm : you will see volatility clearly between currencies. input: MA Fast & Slow. - MA Mode : simple, exponential, smoothed, linear weighted - Applied Price : close, open, high, low, median price, typical price, weighted price.
Note : The slow loading of the indicator issue has been addressed . This new version loads fast and does not slow the platform. Version 1.3 : We have updated the indicator to include an historical bar scanning option . So instead of scanning all bars in the history (which can make the indicator slow sometimes ) , you can select the maximum number of bars it can scan which can increase the performance and make the indicator faster. This indicator scans the 1-3 Trendline pattern . The indic
RoyalPrince Fibo
Richard Louis Pastor
4.88 (17)
Royal Prince Fibonacci , has the most advance Trend detection algorithm built into its Alert system combined with the RoyalPrince Non-repaint Arrows with it's own alert system you will never miss the opportunity of the trade.  2nd picture is how to use Guide on how i use it to Scalp or take long trades. works on all Charts and all Timeframe on mt4. ︎Best Timeframe M15 for scalping  H1 for Day Trading Options: • Fibonacci days High and Lows  • Fibonacci Targets • Fibonacci Alert System • Tren
Moving Pivot Average    The pivot indicator compares the selected period with its counterpart from the previous period. The indicator uses very flexible algorithm for pivot value calculating. It allows you to allocate in days a certain time intervals (custom bars) and calculate the average pivot value based on High, Low and Close prices of these bars. How many custom bars will be taken into account is determined by the "Days" setting. The pivot line can be considered an average trend line and us
Master Max
Abdulkarim Karazon
MASTER MA es un indicador basado en medias móviles cruzadas, que utiliza 3 medias móviles con diferentes períodos cruzados para generar señales, la estrategia es muy simple, pero el indicador tiene un panel de estadísticas que muestra resultados útiles de pruebas retrospectivas instantáneas, como la tasa de ganancias / ganancias totales ganadas... etc., este indicador tiene entradas TP y SL en puntos para que pueda tener su TP y SL deseados visibles en el gráfico en forma de punto verde para TP
Trend Ranger XO
Aleksandr Martynov
Аттракцион невиданной щедрости - треть цены! Индикатор отображает на графике другой популярный индикатор XO, представленный на рисунке в подвале. Важно! Сигнальным является 0 бар - не перекрашивается!  Параметры индикатора: Zone Range (Pips)   - размер зоны в пипсах без учета количества знаков; Line or Histogram Width   - ширина линий или гистограммы;    Zone Draw Type  - способ отрисовки зон: в виде гистограммы или линий на графике; Up Zone Color   -  цвет зоны BUY; Down Zone Color   - цвет з
Niubility Trend  Niubility Trend displays the trend direction for all time frames in real time. You'll see at a glance at which direction the trends are running, how long they last and how powerful they are. All this makes it an easy-to-use trend trading system for beginners, advanced and professional traders. Features Easy to trade Customizable colors and sizes It is non-repainting and non-backpainting It is fantastic as a trailing stop method It implements alerts of all kinds
Trade Stats
Johannes Schoeman
Does your trading consist of Multiple EA's, Multiple time frames an no clear indication of how each individual strategy or time frame is performing, then this indicator will help. Assign the EA Magic number to this indicator and track it's performance on the chart by selecting on chart the period, today, week, month year or all history to view. Easy visual colour changing header to display the performance of the EA for the respective periods.    Minimize the panel to reduce chart clutter. Add yo
The trader uses the Trend for Neuro indicator to determine the market situation. This is a trending algorithm that is convenient to download, install and use. The algorithm with acceptable accuracy generates input signals and output levels. Strategy for trend trading, filtering and all the necessary functions built into one tool! By launching the indicator, the user will see only two types of arrows that can change color to blue during an uptrend, to red during a downtrend there is no uncertaint
Victorias
Andriy Sydoruk
Victoria is a trend indicator used to identify trends in financial markets, indicates the direction of price movement. Flexible indicator settings allow you to receive more accurate signals for opening positions. The indicator will allow you to determine the current trend. Using this algorithm, you can quickly understand what kind of trend is currently developing in the market. Victoria can be used along with oscillators as a filter. Victoria is a true range indicator that identifies the ra
Cloud Stair
Sutthichai Mungdee
Cloud Stair is an Indicator has 2 Cloud (Up Trend and Down Trend). Cloud will turn Red when trend go down. Cloud will turn Blue when trend go up. You can use this indicator as a Support and Resistance level. Trend very strong when there are no opposite side. Open Buy position when the indicator show blue cloud and no red cloud. Open Sell position when the indicator show red cloud and no blue cloud.
We Trade Live Trend Max 500-1000 Pips Our team of engineers have programmed a great tool which we have used to success and will aid you in making better decisions when placing a trade, it is better than anything available on the market at the moment! try & Test Against other products and see for yourself how amazing this is. Our Main Objective is to help you as traders discover how you can take a simple trading setup and make consistent profits. We provide the fundamentals needed to trade the ma
Indicador de Forex "Patrón del hombre colgado" para MT4 El indicador "Patrón del hombre colgado" es un indicador muy potente para el trading de acción del precio: sin repintado, sin demoras; El indicador detecta patrones bajistas del hombre colgado en el gráfico: señal de flecha roja en el gráfico (ver imágenes) Se incluyen alertas para PC, móvil y correo electrónico El indicador "Patrón del hombre colgado" es excelente para combinar con niveles de soporte/resistencia // Más excelentes ases
ZhiBiJuJi MT4
Qiuyang Zheng
4 (2)
El sistema de análisis de indicadores ZhiBiJuJi utiliza un poderoso bucle interno para llamar a sus propios indicadores externos, y luego llama al análisis antes y después del ciclo. El cálculo de los datos de este sistema de análisis de indicadores es muy complicado (llamar antes y después del ciclo), por lo que se reduce la histéresis de la señal y se logra la precisión de la predicción de avance. Este indicador se puede utilizar en todos los ciclos en MT4, y es más adecuado para 15 minutos, 3
Boba Binary
Anthonius Soruh
5 (1)
Result look on  https://t.me/BonosuProBinary Pair : All Forex Pairs Time Frame : M1 Expaired : 1-2 Minutes Trade Time Once Time a Day Backtester, Alert Avaliable Average Signals Generate 5 - 20 Signals All Pair A Day Broker Time Zone GMT+3 Default Setting [Example Broker GMT+3 : Alpari, FBS, XM] Support Broker : Deriv, IQOption, Alpari, Binomo, Olymtrade, Qoutex, GCoption, etc Support Auto Trading : MT2 Trading, Binary Bot, Intrade Bot, Binomo Bot, Olymptrad Bot, MX2 trading, Price Pro, etc Ind
Cota Binary
Anthonius Soruh
5 (2)
Result look on  https://t.me/BonosuProBinary Pair : All Forex Pairs Time Frame : M1 Expaired : 1-2 Minutes Trade Time Once Time a Day Backtester, Alert Avaliable Average Signals Generate 5 - 20 Signals All Pair A Day Broker Time Zone GMT+3 Default Setting [Example Broker GMT+3 : Alpari, FBS, XM] Support Broker : Deriv, IQOption, Alpari, Binomo, Olymtrade, Qoutex, GCoption, etc Support Auto Trading : MT2 Trading, Binary Bot, Intrade Bot, Binomo Bot, Olymptrad Bot, MX2 trading, Price Pro, etc Ind
The Waddah Attar Explosion (WAE) indicator is a potent tool in Forex trading, offering buy, sell, exit buy, and exit sell signals. It assesses trends as trend power and momentum as explosion power. Trend Direction: - Green bars indicate a bullish trend. - Red bars indicate a bearish trend. Signal Line: - A line serves as a threshold for momentum. Buy Trade Setup: **Entry:** Go long when a green bar crosses above the threshold. Place a stop loss below the entry candle. **Exit:** Close the
Impulse fractals indicator - is counter-trend oriented complex market fractal pattern.  Market creates bull/bear impulse, trend starts, fractals on impulsed wave are an agressive pullback signals. Buy arrow is plotted when market is bearish and it's impulse showed up-side fractal, and sell arrow is plotted when market is bullish and it's impulse showed dn-side fractal. Main indicator's adjustable inputs : impulsePeriod - main period of impulse histogram  filterPeriod  - smoothes impulse accordi
Los compradores de este producto también adquieren
FX Volume
Daniel Stein
4.58 (33)
Obtenga su actualización diaria del mercado con detalles y capturas de pantalla a través de nuestro Morning Briefing aquí en mql5 y en Telegram ! FX Volume es el PRIMER y ÚNICO indicador de volumen que proporciona una visión REAL del sentimiento del mercado desde el punto de vista de un bróker. Proporciona una visión impresionante de cómo los participantes institucionales del mercado, como los brokers, están posicionados en el mercado Forex, mucho más rápido que los informes COT. Ver esta info
Scalper Inside PRO
Alexey Minkov
4.73 (56)
An exclusive indicator that utilizes an innovative algorithm to swiftly and accurately determine the market trend. The indicator automatically calculates opening, closing, and profit levels, providing detailed trading statistics. With these features, you can choose the most appropriate trading instrument for the current market conditions. Additionally, you can easily integrate your own arrow indicators into Scalper Inside Pro to quickly evaluate their statistics and profitability. Scalper Inside
The Stochastic Basket Currency Strenght  brings the Stochastic indicator to a new level.  Expanding the boundaries of TimeFrames and mono-currency analysis, the SBCS take the movements of each currency that composes the cross and confront them in the whole basket of 7 crosses.  The indicator works with any combination of AUD, CAD, CHF, EUR, GBP, JPY, NZD, USD pairs and with full automation takes in account every stochastic value (main line) for the selected Time Frame.  After that, the indicator
TPSproTREND PrO
Roman Podpora
4.79 (19)
TPSpro TREND PRO   es un indicador de tendencia que analiza automáticamente el mercado y proporciona información sobre la tendencia y cada uno de sus cambios, además de dar señales para ingresar operaciones sin volver a dibujar. El indicador utiliza cada vela, analizándolas por separado. refiriéndose a diferentes impulsos: impulso hacia arriba o hacia abajo. ¡Puntos de entrada exactos a transacciones de divisas, criptomonedas, metales, acciones e índices! Versión MT5                   DESCRIPCI
Reversal-Arrow: Identifica Puntos de Inversión con Precisión y Fiabilidad Reversal-Arrow es un indicador avanzado diseñado para ayudar a traders de todos los niveles a detectar posibles puntos de inversión de tendencia. Enfocado en proporcionar señales visuales claras, este indicador te ayuda a entender mejor el contexto del mercado, reduciendo la incertidumbre y facilitando el proceso de toma de decisiones. Reversal-Arrow está optimizado específicamente para los pares XAUUSD y XAUEUR en los mar
TPSpro RFI Levels
Roman Podpora
4.82 (22)
INSTRUCCIONES      RUSO  -  ING     Se recomienda utilizar con un indicador.   -    TPSpro   TENDENCIA PRO -   Versión MT5 Un elemento clave en el trading son las zonas o niveles desde los que se toman las decisiones de compra o venta de un instrumento de trading. A pesar de los intentos de los principales actores de ocultar su presencia en el mercado, inevitablemente dejan rastros. Nuestra tarea era aprender a identificar estos rastros e interpretarlos correctamente. Funciones principales: ¡Mo
Dynamic Forex28 Navigator
Bernhard Schweigert
5 (2)
Dynamic Forex28 Navigator: la herramienta de trading de Forex de última generación. ACTUALMENTE CON UN 49 % DE DESCUENTO. Dynamic Forex28 Navigator es la evolución de nuestros indicadores populares de larga data, que combina el poder de tres en uno: Indicador avanzado Currency Strength28 (695 reseñas) + Indicador avanzado Currency IMPULSE con ALERT (520 reseñas) + Señales combinadas CS28 (bonificación). Detalles sobre el indicador https://www.mql5.com/en/blogs/post/758844 ¿Qué ofrece el i
Gold Channel is a volatility-based indicator, developed with a specific timing algorithm for the XAUUSD pair, which consists of finding possible corrections in the market. This indicator shows two outer lines, an inner line (retracement line) and an arrow sign, where the theory of the channel is to help identify overbought and oversold conditions in the market. The market price will generally fall between the boundaries of the channel. If prices touch or move outside the channel it is a tra
¡Actualmente 20% OFF ! ¡La mejor solución para cualquier novato o trader experto! Este software funciona con 28 pares de divisas. Se basa en 2 de nuestros principales indicadores (Advanced Currency Strength 28 y Advanced Currency Impulse). Proporciona una gran visión general de todo el mercado de divisas. Muestra los valores de Advanced Currency Strength, la velocidad de movimiento de las divisas y las señales para 28 pares de divisas en todos los (9) marcos temporales. Imagine cómo mejorar
Ultimate Gold Advisor para MetaTrader 4 El Ultimate Gold Advisor es una herramienta tecnológica avanzada diseñada para optimizar la experiencia de trading en MetaTrader 4. Creada para satisfacer las necesidades de los traders más experimentados, este indicador combina precisión, análisis sofisticado y funcionalidad versátil, ofreciendo soporte para tomar decisiones de trading informadas. Ideal para el trading de oro, pero también aplicable a una amplia gama de activos, el Ultimate Gold Advisor p
Gann Swing Structure
Kirill Borovskii
5 (1)
This indicator is based on the mathematics of the great trader W.D. Ganna. With its help, you can easily find strong levels by analyzing swings to find the optimal entry point. The indicator works on all instruments and all timeframes. The indicator is fully manual and has control buttons. All you need to do is press the NEW button, a segment will appear, which you can place on any movement, swing or even 1 candle that you want to analyze. By placing the segment, press the OK button. A grid (th
Presentamos ON Trade Waves Patterns Harmonic Elliot Wolfe, un indicador avanzado diseñado para detectar diversas formas de patrones en el mercado mediante métodos tanto manuales como automáticos. A continuación, te explicamos cómo funciona: Patrones Armónicos: Este indicador puede identificar patrones armónicos que aparecen en tu gráfico. Estos patrones son esenciales para los traders que practican la teoría del trading armónico, tal como se popularizó en el libro de Scott Carney "Harmonic Tradi
Supply and Demand Dashboard PRO
Bernhard Schweigert
4.8 (20)
¡Actualmente 20% OFF ! Este tablero de instrumentos es una pieza muy poderosa de software de trabajo en múltiples símbolos y hasta 9 marcos de tiempo. Se basa en nuestro indicador principal (Mejores críticas: Advanced Supply Demand ).  El tablero de instrumentos da una gran visión general. Se muestra:  Valores filtrados de Oferta y Demanda, incluyendo la calificación de fuerza de la zona, Pips distancias a / y dentro de las zonas, Destaca las zonas anidadas, Da 4 tipos de alertas para los s
Enigmera
Ivan Stefanov
5 (3)
ENIGMERA: El núcleo del mercado https://www.enigmera.com Introducción Este indicador y sistema de negociación es un enfoque extraordinario de los mercados financieros. ENIGMERA utiliza los ciclos fractales para calcular con precisión los niveles de soporte y resistencia. Muestra la auténtica fase de acumulación y proporciona dirección y objetivos.  Un sistema que funciona tanto si estamos en una tendencia como en una corrección.  ¿Cómo funciona? ENIGMERA consta de tres líneas: la línea de s
¡LEA LA INFORMACIÓN A CONTINUACIÓN ANTES DE COMPRAR EL PRODUCTO! ¡Apollo Pips PLUS SP es un producto único! ¡ES PARA AQUELLOS QUE QUIEREN OBTENER MI NUEVO INDICADOR "APOLLO PIPS" MÁS BONO "SUPER PACK" CON ACCESO A TODOS MIS INDICADORES COMERCIALES! Al comprar el producto Apollo Pips PLUS SP, en realidad está comprando una versión absolutamente nueva de mi indicador Apollo Pips. Esta versión del indicador tiene un algoritmo mejorado y un parámetro fácil de usar que le brinda la oportunidad de uti
XQ Indicator MetaTrader 4
Marzena Maria Szmit
4 (4)
Step into the realm of Forex trading with confidence and precision using XQ, a cutting-edge Forex indicator designed to elevate your trading game to unprecedented heights. Whether you're a seasoned trader or just stepping into the world of currency exchange,   XQ Forex Indicator   empowers you with the insights and signals needed to make informed trading decisions. The signal conditions are a combination of three indicators, and XQ Forex Indicator only display  medium and long-term trends . The
TrendMaestro
Stefano Frisetti
5 (3)
note: this indicator is for METATRADER4, if you want the version for METATRADER5 this is the link:  https://www.mql5.com/it/market/product/108106 TRENDMAESTRO ver 2.4 TRENDMAESTRO recognizes a new TREND in the bud, he never makes mistakes. The certainty of identifying a new TREND is priceless. DESCRIPTION TRENDMAESTRO identifies a new TREND in the bud, this indicator examines the volatility, volumes and momentum to identify the moment in which there is an explosion of one or more of these data a
ACB Breakout Arrows
KEENBASE SOFTWARE SOLUTIONS
4.15 (34)
The ACB Breakout Arrows indicator provides a crucial entry signal in the market by detecting a special breakout pattern. The indicator constantly scans the chart for a settling momentum in one direction and provide the accurate entry signal right before the major move.  Get multi-symbol and multi-timeframe scanner from here - Scanner for ACB Breakout Arrows MT4 Key features Stoploss and Take Profit levels are provided by the indicator. Comes with a MTF Scanner dashboard which tracks the brea
(Actualmente 30% DE DESCUENTO) Antes de leer la descripción de este indicador, solo quiero presentarles el siguiente concepto LÍNEA PROMEDIO EN MOVIMIENTO: promedio móvil típico que se basa en un solo gráfico. LÍNEA DE FUERZA DE LA DIVISA: el promedio móvil de un determinado par en el que la fuerza se basa en 28 pares. Se puede decir que es la LÍNEA PROMEDIO EN MOVIMIENTO REAL. De hecho, la media móvil es uno de los indicadores más populares que utilizan casi todos los operadore
Shepherd Harmonic Pattern
Abdullah Alrai
4.65 (49)
Este indicador detectará patrones armónicos que se dibujen en el gráfico mediante métodos manuales y automáticos. Puede consultar el manual del usuario en el siguiente enlace: Agregue su opinión y contáctenos para obtenerlo Existe una versión gratuita para probar este producto en mt4. Puede utilizarlo para detectar patrones de Gartley y Nenstar: https://www.mql5.com/en/market/product/30181 Puede comprar la versión completa de MT4 en: https://www.mql5.com/en/market/product/15212 Notas El indicad
Currency Strength Exotics
Bernhard Schweigert
4.87 (31)
¡ACTUALMENTE 20% DE DESCUENTO ! ¡La mejor solución para cualquier operador novato o experto! Este indicador está especializado en mostrar la fuerza de la divisa para cualquier símbolo como Pares Exóticos, Materias Primas, Índices o Futuros. Es el primero de su clase, cualquier símbolo se puede añadir a la 9 ª línea para mostrar la verdadera fuerza de la moneda de Oro, Plata, Petróleo, DAX, US30, MXN, TRY, CNH etc. Se trata de una herramienta de trading única, de alta calidad y asequible por
Bomb Bank Signal
Igor Pereira Calil
5 (1)
Señal de Bomb Bank: su indicador de confianza en MetaTrader 4 Bomb Bank Signal es un poderoso indicador para MetaTrader 4, diseñado para identificar las tendencias más relevantes en el mercado financiero. Si buscas una herramienta que anticipe los movimientos con precisión, el Bomb Bank es el aliado que necesitas. Cómo funciona: Este indicador combina tres métodos distintos (análisis de volumen, cierre de velas y tendencia simétrica) para detectar y señalar oportunidades de compra y venta
Sneaky Busters 4
Mushfiq Faysal
5 (2)
This indicator is designed for those familiar with smart money concepts, specifically accumulation and distribution. It tracks subtle moves by institutional traders, not always aligned with traditional strategies. Ensure it fits your trading style by testing thoroughly before purchasing. Sneaky Buster is designed to help retail traders identify smart money moves. Traditional indicators often miss these subtle maneuvers, which inspired the creation of this tool. It effectively detects price cons
TPA True Price Action indicator reveals the true price action of the market makers through 100% non-repainting signals (except early signals mode) strictly at the close of a candle! TPA shows entries and re-entries, every time the bulls are definitely stronger than the bears and vice versa. Not to confuse with red/green candles. The shift of power gets confirmed at the earliest stage and is ONE exit strategy of several. There are available now two free parts of the TPA User Guide for our custo
Cycle Sniper
Elmira Memish
4.39 (36)
NEW YEAR SALE PRICE FOR LIMITED TIME!!! Please contact us after your purchase and we will send you the complimentary indicators to complete the system Cycle Sniper is not a holy grail but when you use it in a system which is explained in the videos, you will feel the difference. If you are not willing to focus on the charts designed with Cycle Sniper and other free tools we provide, we recommend not buying this indicator. We recommend watching the videos about the indiactor and system before pu
Up down v6T
Guner Koca
5 (2)
Thise indicator is up down v6  comes with tradingwiev pinescript. purchased people, after installed on terminal ,contact me on mql5  to get BONUS  TradingView pinescript. up-down indicator is no repaint and works all pairs and lower than weekly time frames charts. it is suitable also 1 m charts for all pairs. and hold long way to signal. dont gives too many signals. when red histogram cross trigger line that is up signal.and price probably will down when blue histogram cross trigger line that
REMINDER: Early buyers hot price discount: Price subject to rise after first 20 copies. Starting price $65 and final price will be $1275. Secure your discounted copy Now! Smart Money Analyser Indicator User Manual 1. Introduction Welcome to the   Smart Money Analyser Indicator This powerful tool provides traders with comprehensive market analysis by combining various technical indicators to generate actionable trading signals. Designed to be user-friendly, this indicator helps traders of a
Fibonacci Sniper
Elmira Memish
5 (2)
Fibonacci Sniper MT4 - No Repaint Features:  - Indicator sends signals and notifications on key Fibonacci Retracement and Fibonacci Extensions Levels - Once the buy/sell signal is set, targets ( TP1 TP2 TP3 )and stop loss levels are drawn by the indicator. - Fibonacci Calculations and Custom Patterns are identified by the last 3 or 5 Zig Zag exterum. - You can easily identify key harmonic patterns like Gartley, Bat, Butterfly and Crab patterns. Important Settings:  - Choose the Zig
The Binary Profit Maker,  This indicator works on MT4 and is very easy to use. When you receive a signal from it, you wait for that candle with the signal to close and you enter your trade at the beginning of the next new candle . A Up Purple arrow means Buy and a Down Purple arrow means Sell. All arrows comes with Alert  like for easy identification of trade signal. Are you okay with that? How To Enter Trade? 1 minute candle 1 minute expire
PZ Day Trading
PZ TRADING SLU
3.67 (3)
Este indicador detecta reversiones de precios en forma de zig-zag, utilizando solo análisis de acción de precios y un canal donchian. Ha sido diseñado específicamente para el comercio a corto plazo, sin repintar ni pintar en absoluto. Es una herramienta fantástica para comerciantes astutos con el objetivo de aumentar el tiempo de sus operaciones. [ Guía de instalación | Guía de actualización | Solución de problemas | FAQ | Todos los productos ] Increíblemente fácil de comerciar Proporciona
Otros productos de este autor
[V 1.00] ¡Se ha lanzado MTF NRPA 5 Moving Average RTD! Panel de control en tiempo real de flecha sin repintar. Si está buscando el mejor indicador de promedio móvil, entonces está en la página correcta. Generalmente, la gente instalará dos medias móviles porque la intersección de las dos medias móviles (el cruce) determinará la dirección de la próxima tendencia de precios. Si el promedio móvil rápido se cruza con el promedio móvil lento y rápido > lento, entonces la tendencia es alcista. Po
Analizar múltiples marcos de tiempo de un par de divisas en una ventana puede confundirlo. Para analizar múltiples marcos de tiempo, necesita indicadores confiables. Uno de ellos está usando 9TF MACD Curve. He estado trabajando día y noche para crear un código que sea simple pero confiable y cubra los nueve marcos de tiempo en un solo indicador. Veamos algunas de las ventajas de este indicador: Histograma colorido. El color de la curva en cada período de tiempo es diferente entre sí.
Analizar múltiples marcos de tiempo de un par de divisas en una ventana puede confundirlo. Para analizar múltiples marcos de tiempo, necesita indicadores confiables. Uno de ellos está utilizando 9TF STOCH RSI. He estado trabajando día y noche para crear un código que sea simple pero confiable y cubra los nueve marcos de tiempo en un solo indicador. Veamos algunas de las ventajas de este indicador: Histograma colorido. El color de la curva en cada período de tiempo es diferente entre s
Analyzing multiple time frames of a currency pair in one window can make you confused. To analyze multiple time frames, you need reliable indicators. One of them is using 9TF RSI MA . I've been working day and night to create code that is simple but reliable and covers all nine time frames in just one indicator .  Let's look at some of the advantages of this indicator: Colorful histogram . The color of the curve in each timeframe is different from one another.  Arrows indicating the crossing of
Analyzing multiple time frames of a currency pair in one window can make you confused. To analyze multiple time frames, you need reliable indicators. One of them is using 9TF MACD Limited Bar . I've been working day and night to create code that is simple but reliable and covers all nine time frames in just one indicator .  Attention! When first installed, the indicator does not look intact. Changing the timeframe will solve the problem. Let's look at some of the advantages of this indicator: C
Analyzing multiple time frames of a currency pair in one window can make you confused. To analyze multiple time frames, you need reliable indicators. One of them is using 9TF STOCH RSI LIMITED BAR . I've been working day and night to create code that is simple but reliable and covers all nine time frames in just one indicator .  Attention! When first installed, the indicator does not look intact. Changing the timeframe will solve the problem. Let's look at some of the advantages of this indicat
Analizar múltiples marcos de tiempo de un par de divisas en una ventana puede confundirlo. Para analizar múltiples marcos de tiempo, necesita indicadores confiables. Uno de ellos está usando 9TF Double RSI Double MA. He estado trabajando día y noche para crear un código que sea simple pero confiable y cubra los nueve marcos de tiempo en un solo indicador. Veamos algunas de las ventajas de este indicador: Doble RSI, es decir, RSI más rápido y RSI más lento. Doble MA, es decir, MA más r
Analizar múltiples marcos de tiempo de un par de divisas en una ventana puede confundirlo. Para analizar múltiples marcos de tiempo, necesita indicadores confiables. Uno de ellos está usando 9TF Double CCI Double MA. He estado trabajando día y noche para crear un código que sea simple pero confiable y cubra los nueve marcos de tiempo en un solo indicador. Veamos algunas de las ventajas de este indicador: Doble CCI, es decir, CCI más rápido y CCI más lento. Doble MA, es decir, MA más r
Se encuentra disponible un indicador CCI preciso. Dashboard Trend Bar Smart Level 9TF Doble CCI. Doble CCI, es decir, CCI rápido y CCI lento ¿Por qué necesita un segundo CCI? El uso de indicadores adicionales nos convencerá más en el comercio en vivo Curva CCI rápida 9TF 9TF Curva CCI lenta Ángulo CCI en tiempo real 9TF 9TF valor CCI en tiempo real 9TF dirección/fase CCI en tiempo real Barra de tendencia 9TF Nuevo algoritmo en el cálculo de la barra de tendencia. Boton de encendido / apagado.
Un indicador RSI preciso está disponible. Dashboard Trend Bar Smart Level 9TF Doble RSI. Doble RSI, es decir, RSI rápido y RSI lento ¿Por qué necesitas un segundo RSI? El uso de indicadores adicionales nos convencerá más en el comercio en vivo Curva RSI rápida 9TF 9TF Curva RSI lenta Ángulo RSI en tiempo real 9TF Valor RSI en tiempo real 9TF 9TF RSI en tiempo real dirección/fase Barra de tendencia 9TF Nuevo algoritmo en el cálculo de la barra de tendencia. Boton de encendido / apagado. Muy út
Un indicador MACD preciso está disponible. Dashboard Trend Bar Smart Level 9TF Doble MACD. MACD dual, es decir, rápido (MACD 1) y lento (MACD 2) ¿Por qué necesitas un segundo MACD? El uso de indicadores adicionales nos convencerá más en el comercio en vivo Curva 9TF Fast MACD 1 9TF Curva MACD 2 lenta Ángulo MACD en tiempo real 9TF Valor MACD en tiempo real 9TF Dirección MACD en tiempo real 9TFSe encuentra disponible un indicador MACD preciso. Dashboard Trend Bar Smart Level 9TF Doble MACD.
Un indicador estocástico preciso está disponible. Dashboard Trend Bar Smart Level 9TF Dual Stochastic. Estocástico dual, es decir, estocástico rápido y estocástico lento ¿Por qué necesitas un segundo estocástico? El uso de indicadores adicionales nos convencerá más en el comercio en vivo Curva estocástica rápida 9TF Curva estocástica lenta 9TF Ángulo estocástico en tiempo real 9TF 9TF valor estocástico en tiempo real 9TF dirección/fase estocástica en tiempo real Barra de tendencia 9TF Nuevo a
Si a menudo pierde operaciones porque solo usa un indicador, pruebe esta herramienta comercial. Esta herramienta comercial utiliza más de un indicador. A menudo observo a traders que sólo utilizan el indicador RSI. Muy a menudo el mercado está sobrevendido pero todavía está abajo o el mercado está sobrecomprado pero todavía está arriba. Por este motivo, es necesario utilizar más de un indicador. Presentamos la nueva versión V 3.40 MTF PPAAF: Flecha de acción de precio precisa de múltiples marco
[V 1.00] ¡Se ha lanzado MTF NRPA 5 RSI RTD! Panel de control en tiempo real de flecha sin repintar. Si está cansado de usar varios indicadores RSI pero descubre que son inexactos, pruebe esta herramienta. Por lo general, las personas solo instalan 1 RSI para determinar el nivel de OBOS en un período de tiempo. La mala noticia es que no puede ver los niveles y las tendencias de OBOS en varios períodos de tiempo a la vez. Es por eso que desarrollé esta herramienta comercial. Así es como se
Introducing the advanced trading tools of 2023. MTF PPAAF Model S. This is sub window version of my best trading tool : MTF Precise Price Action Arrow Filtered.  Click here to learn more about MTF PPAAF . This trading tool is equipped with various powerful features : MTF = Multi Time Frame = Time Frame can be changed. On/off button. Non Repaint Arrows.  Customizable parameter, color etc.  Can show all time frame (ATF) crossover arrows of fast stochastic main line & fast stochastic signal line (
If you are curious about the position of the stochastic, RSI, CCI curve, whether it is at the OBOS level or not, then this trading tool is for you. Introducing the advanced trading tools of 2024. ATF Trend Following Trend Bar OBOS. This indicator is similar to MTF PPAAF Model S but have two layers.  Click here to learn more about MTF PPAAFS . This trading tool is equipped with various powerful features : MTF = Multi Time Frame = Time Frame can be changed. On/off button. Customizable parameter,
Hola comerciantes. Presentamos mi mejor herramienta comercial. DM PPAAF Modelo T. Marco de tiempo múltiple Flecha de acción de precio precisa filtrada Modelo T.  Esta herramienta comercial es mi mejor trabajo después de años de crear varias herramientas comerciales. ¿Por qué esta herramienta comercial es la mejor y confiable?  1. Esta herramienta utiliza 6 indicadores:  Doble CCI = CCI rápido x CCI lento Estocástico dual = estocástico rápido (línea principal del estocástico
Con esta herramienta comercial, puede escanear 15 mercados simultáneamente. Presentamos el nuevo indicador comercial 2024: ️ Panel de control Multidivisa Multiplazo Doble CCI. Hay al menos dos razones por las que creé esta herramienta comercial: En primer lugar, estoy aburrido de observar sólo un mercado. En segundo lugar, no quiero perder el momento de entrada en otro mercado. Por eso quiero conocer al mismo tiempo otras condiciones del mercado. Por este motivo, necesito un escáne
Con esta herramienta comercial, puede escanear 15 mercados simultáneamente. Presentamos el nuevo indicador comercial 2024: ️ Panel de control Multidivisa Múltiple Marco de tiempo Doble RSI. Hay al menos dos razones por las que creé esta herramienta comercial: Primero, estoy aburrido de observar sólo un mercado. En segundo lugar, no quiero perder el momento de entrada en otro mercado. Por eso quiero conocer al mismo tiempo otras condiciones del mercado. Por este motivo, necesito un
Filtro:
No hay comentarios
Respuesta al comentario
Versión 1.40 2024.09.26
In this new Version V 1.40 :
- Adding default prefix and suffix
- Optimizing
Versión 1.30 2024.09.19
In this new Version V 1.30 :
- New algo crossover arrows of stochastic curve
Versión 1.20 2024.05.13
In this new Version V 1.20 :
- Fixing dashboard multi currency and single currency
Versión 1.10 2024.04.29
In this new Version V 1.10 :
- Fixing prefix and suffix
- Fixing extra width of both dashboard and TPC
- Adding arrows crossover scheme