• Información general
  • Comentarios
  • Discusión
  • Novedades

NakaSide

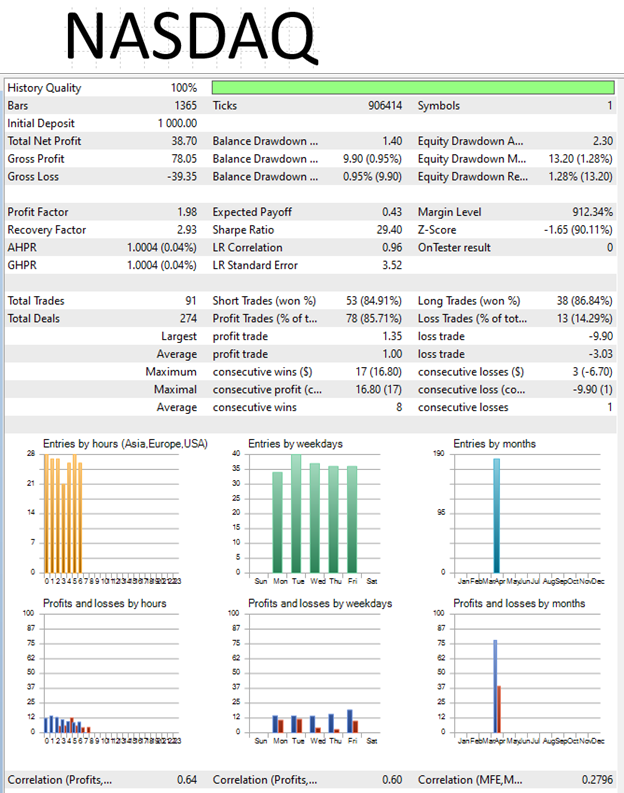
¡Presentamos NakaSide - Tu Indicador Definitivo de Oportunidades en el Mercado!

¿Estás cansado de perder oportunidades de trading rentables? ¿Estás listo para llevar tu trading al siguiente nivel? ¡No busques más, porque NakaSide está aquí para revolucionar la forma en que operas!

NakaSide no es solo otro indicador común y corriente; es tu arma secreta para navegar el complejo mundo de los mercados financieros con confianza y precisión. Con sus avanzados algoritmos y tecnología de vanguardia, NakaSide está diseñado para detectar cambios de tendencia y descubrir oportunidades lucrativas tanto en mercados alcistas como bajistas.

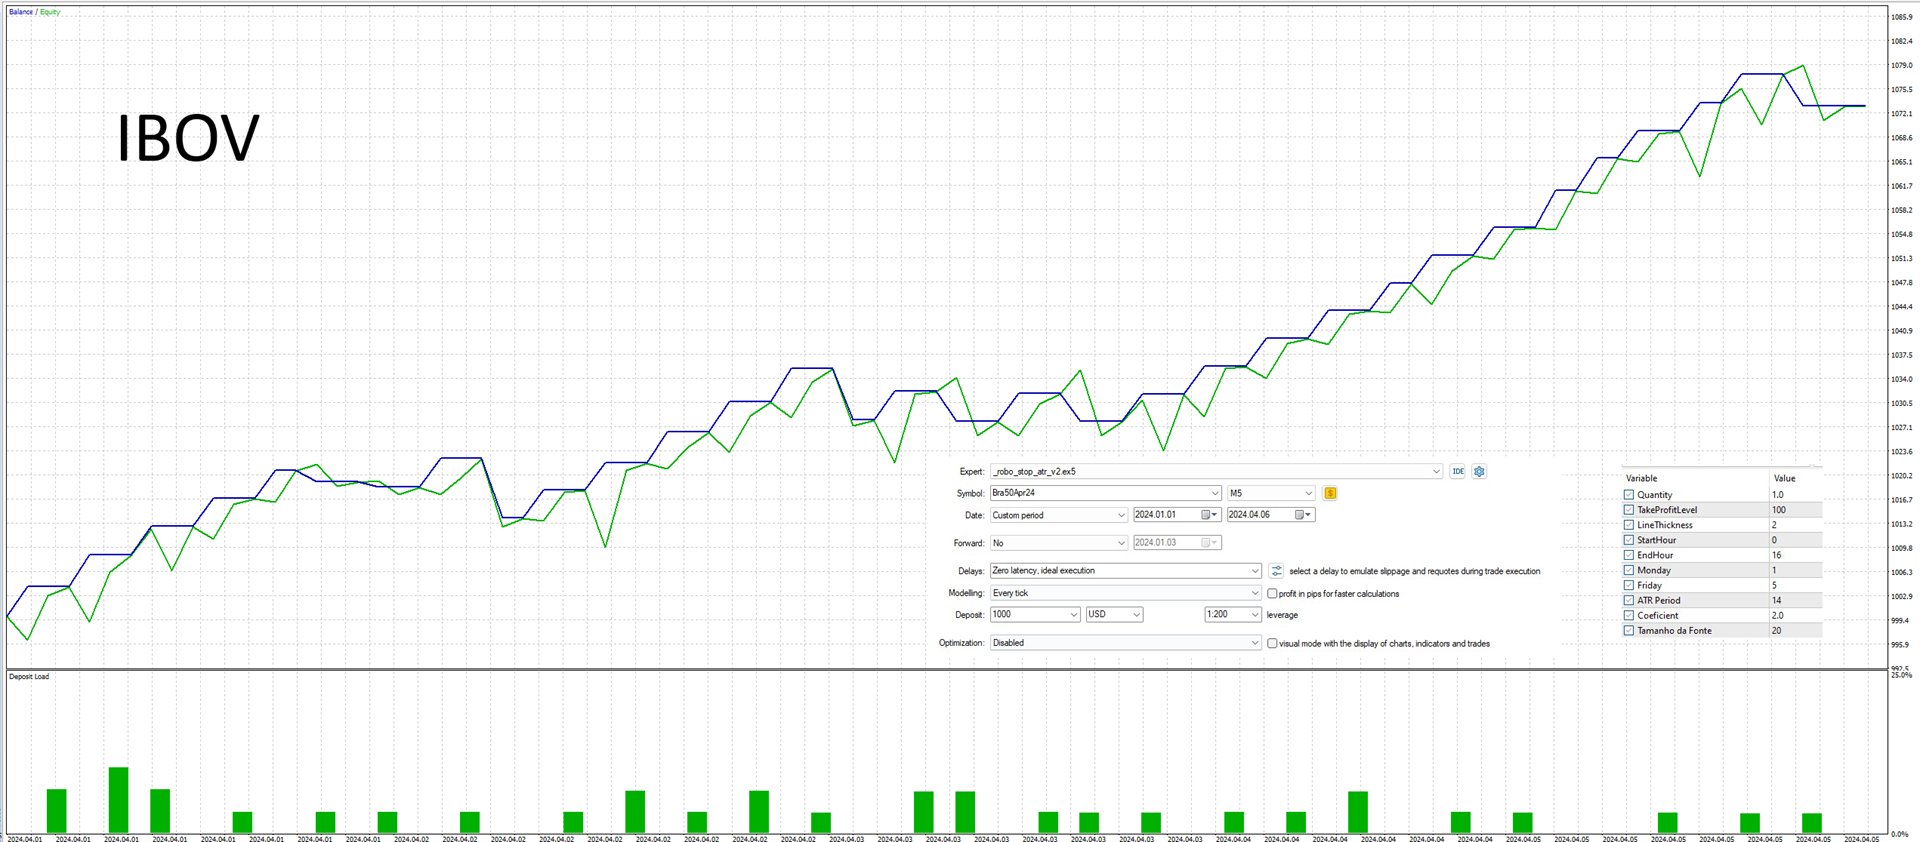
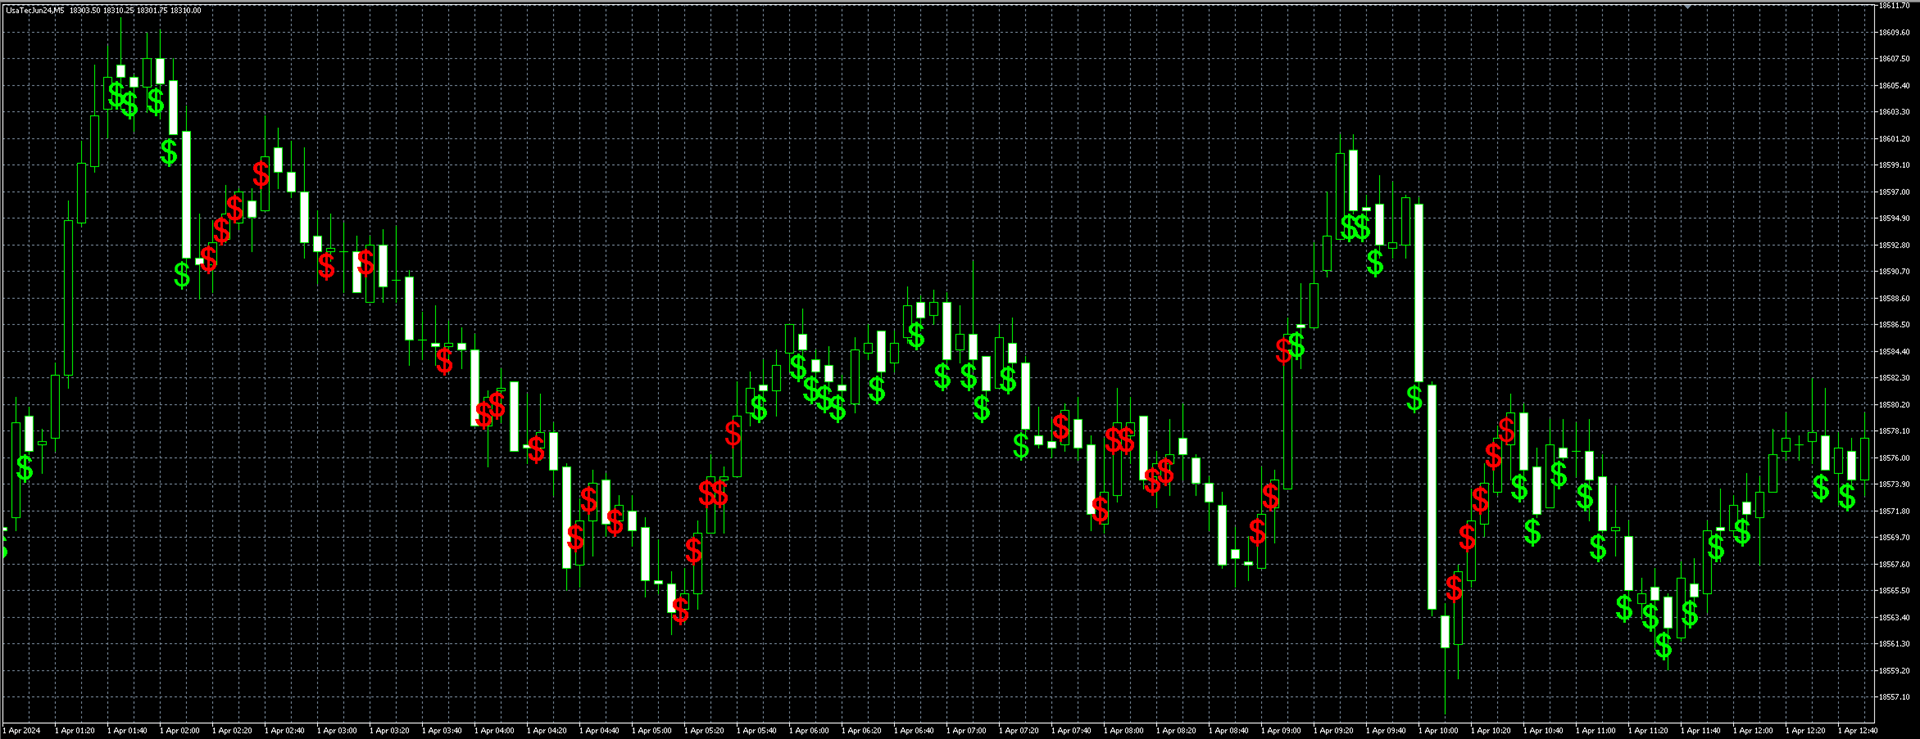
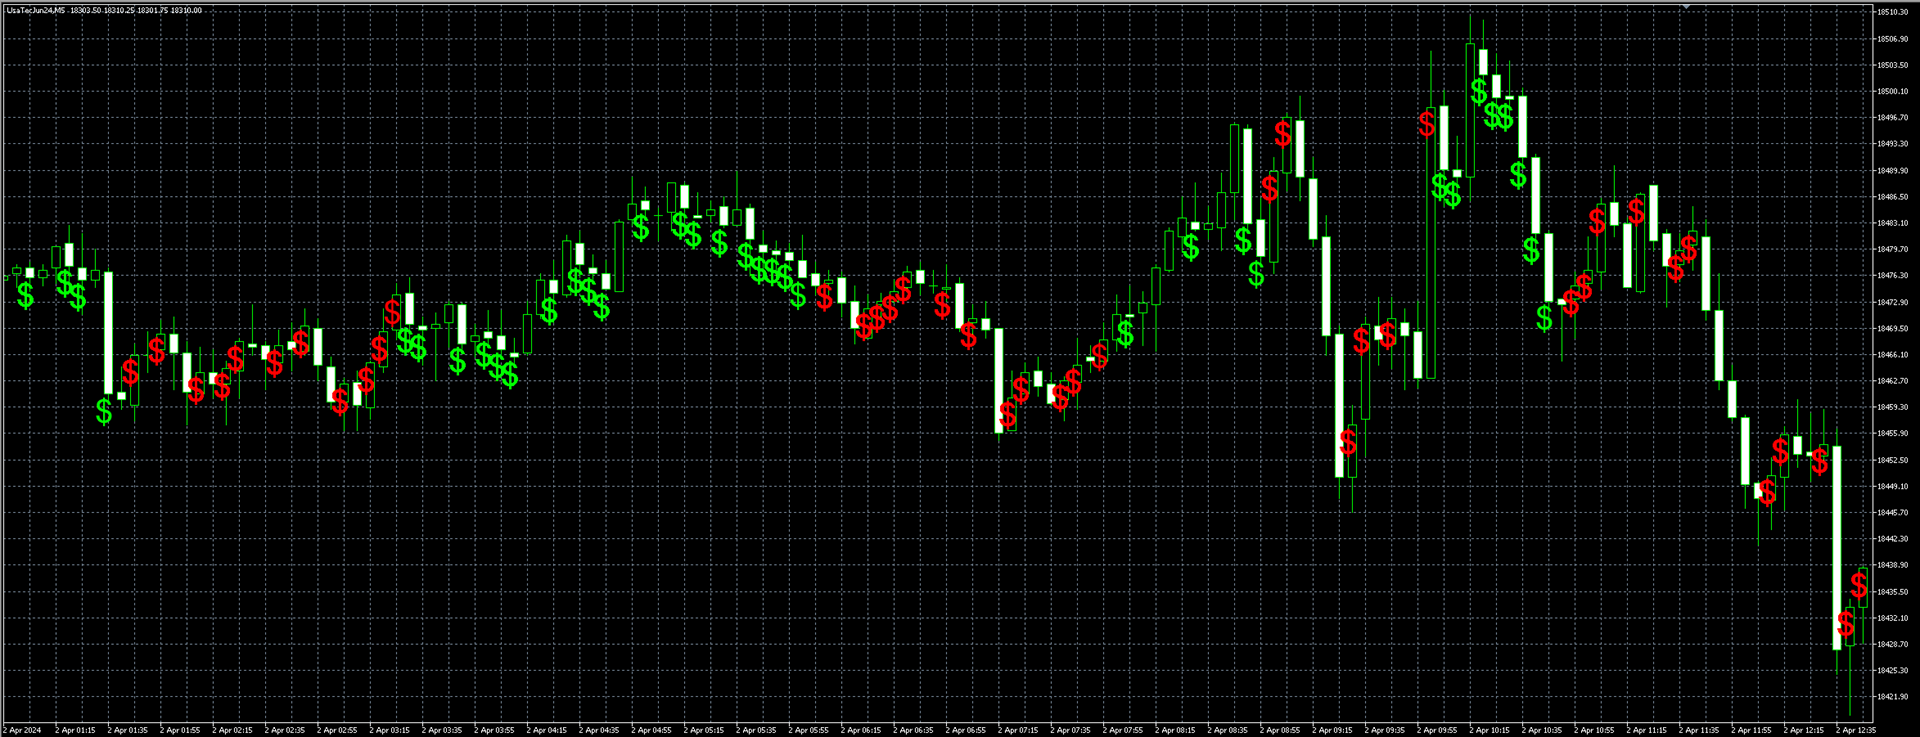
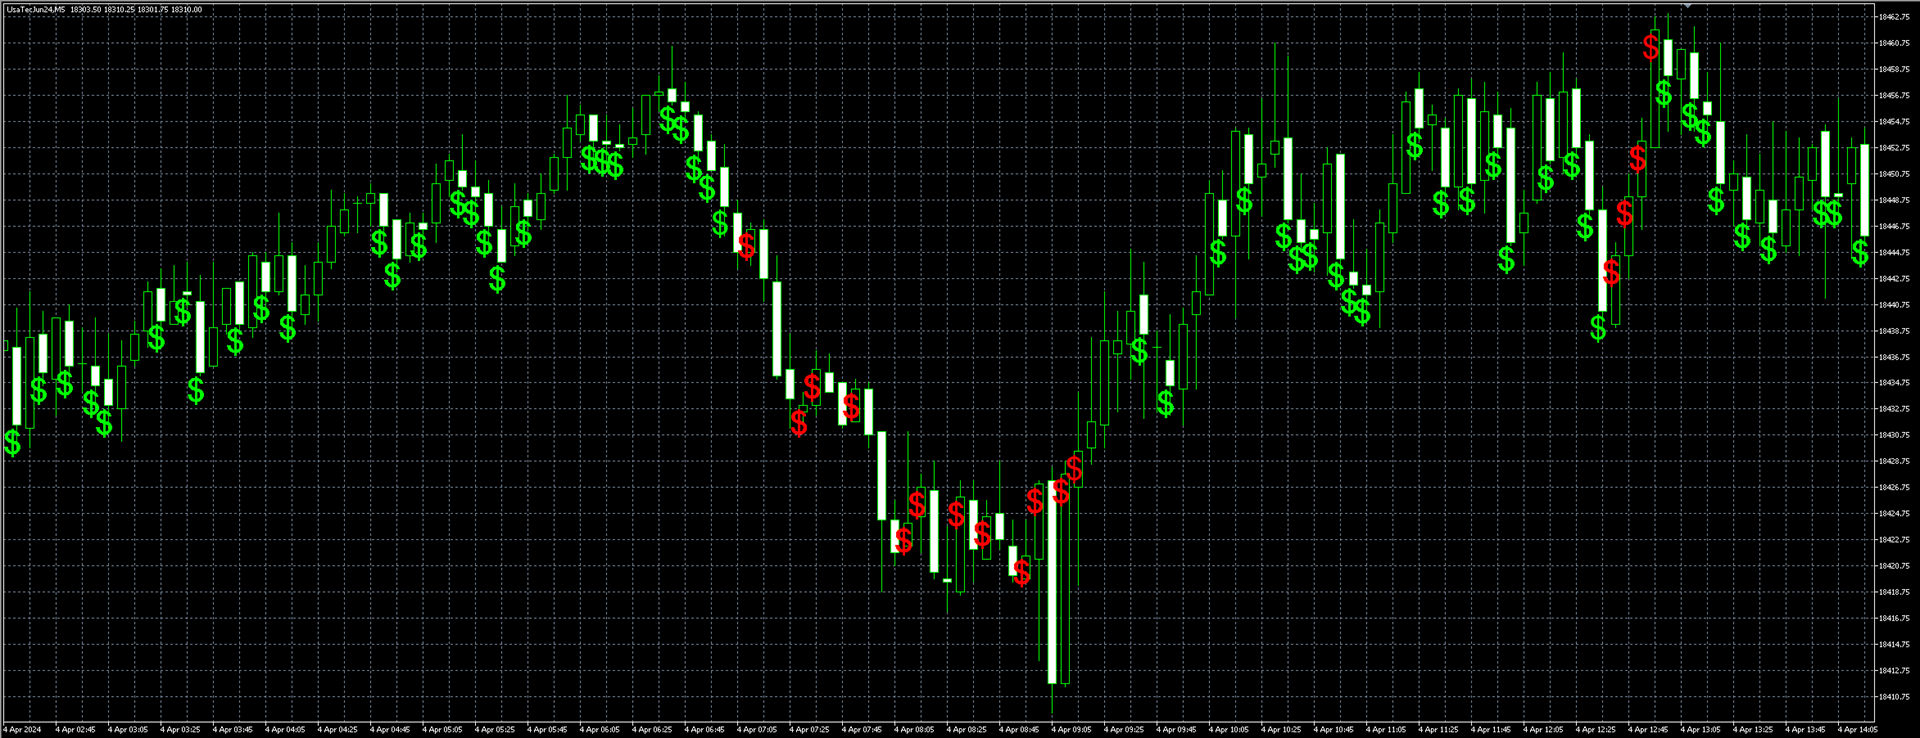
Cuando NakaSide detecta un cambio hacia una tendencia alcista, señala con un vibrante signo de dólar verde, indicando una posible oportunidad de compra. Por el contrario, si la tendencia cambia de dirección, aparece un llamativo signo de dólar rojo, señalando una posible oportunidad de venta.

Pero aquí es donde NakaSide realmente se destaca: no se limita a identificar tendencias. En mercados laterales, donde otros pueden tener dificultades, NakaSide brilla con luz propia, esparciendo múltiples signos de dólar en el gráfico, indicando numerosos puntos de entrada potenciales. ¡Esto significa más oportunidades para capitalizar los movimientos del mercado, ya sea al alza, a la baja o de lado!

Pero eso no es todo: NakaSide te da la flexibilidad de tomar el control de tus operaciones permitiendo la entrada manual de órdenes. Ya sea que estés ejecutando una orden de compra o venta, simplemente sigue las indicaciones: verde para comprar, rojo para vender, y aprovecha el momento para entrar en el mercado con confianza.

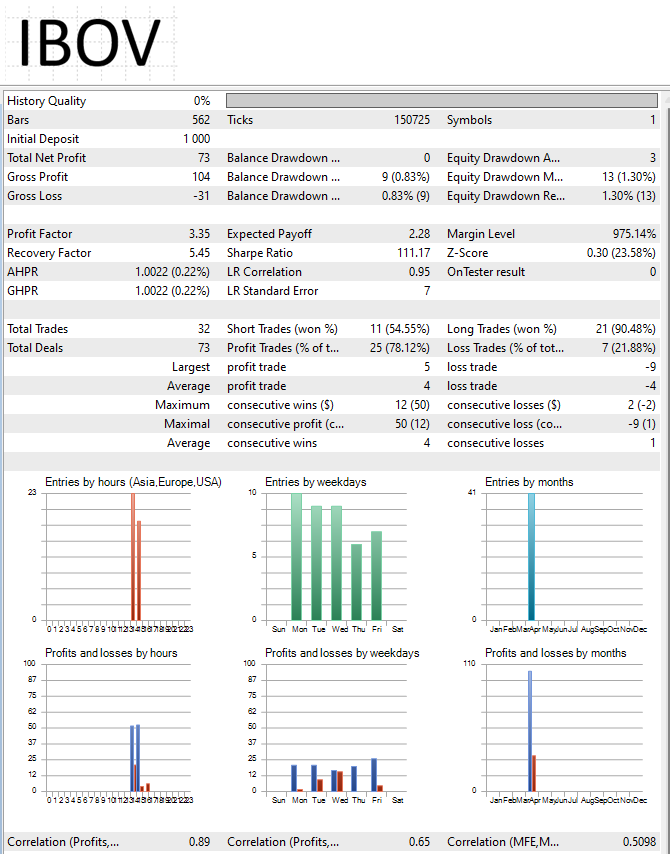
Es importante recordar que si bien NakaSide proporciona información valiosa y señales, la decisión de entrar o salir de una operación finalmente recae en ti. Por eso es crucial ejercer prácticas sólidas de gestión del riesgo e implementar una estrategia bien pensada. Después de todo, el éxito en el trading no se trata solo de hacer operaciones; se trata de manejar el riesgo de manera efectiva y mantener la disciplina en tu enfoque.

Con NakaSide a tu lado, obtendrás una ventaja en los mercados como nunca antes. Ya seas un trader experimentado o recién estés comenzando, NakaSide ofrece una gran cantidad de oportunidades para maximizar tus ganancias y alcanzar tus objetivos financieros.

¡No dejes pasar otra oportunidad! ¡Aprovecha el poder de NakaSide y desbloquea un mundo de posibilidades infinitas en el trading hoy mismo!
Productos recomendados
nuestro indicador   Basic Support and Resistance   es la solución que necesita para aumentar su análisis técnico.Este indicador le permite proyectar niveles de soporte y resistencia en el gráfico/ mt4 gratuita características Integración de los niveles de Fibonacci: Con la opción de mostrar los niveles de Fibonacci junto con los niveles de soporte y resistencia, nuestro indicador le brinda una visión aún más profunda del comportamiento del mercado y las posibles áreas de inversión. Optimiza
Noize Absorption Index - is the manual trading system that measures the difference of pressure between bears forces and bulls forces. Green line - is a noize free index that showing curent situation. Zero value of index shows totally choppy/flat market.Values above zero level shows how powerfull bullish wave is and values below zero measures bearish forces.Up arrow appears on bearish market when it's ready to reverse, dn arrow appears on weak bullish market, as a result of reverse expectation.
Was: $249  Now: $99   Market Profile defines a number of day types that can help the trader to determine market behaviour. A key feature is the Value Area, representing the range of price action where 70% of trading took place. Understanding the Value Area can give traders valuable insight into market direction and establish the higher odds trade. It is an excellent addition to any system you may be using. Inspired by Jim Dalton’s book “Mind Over Markets”, this indicator is designed to suit the
Trading Utility for Forex Currency Pairs Only not for Gold  Functions Auto Lot Calculation based on Risk Auto stoploss  Auto TakeProfit Breakeven Auto Close Half % Close in percentage with respect to the PIPs Pending Orders BuyLimit Sell Limit with distances BuyStop Sell Stop    with distances Trading Informations Risk in percentage For Multiple trades Combine Takeprofit and Combine Stoplosses
Your Trend Friend
Luigi Nunes Labigalini
5 (1)
The trend is your friend! Look at the color of the indicator and trade on that direction. It does not  repaint. After each candle is closed, that's the color of the trend. You can focus on shorter faster trends or major trends, just test what's most suitable for the symbol and timeframe you trade. Simply change the "Length" parameter and the indicator will automatically adapt. You can also change the color, thickness and style of the lines. Download and give it a try! There are big movements
The best time to trade Using this Indicator is when the time reach exactly hour,half,45 minutes,15 minutes and sometimes 5 minutes.. This indicators is helpful to those who trade boom and crash indecies.How to read this indicator first you'll see Blue allow and Red allow all these allows used to indicate or to detect the spike which will happen so the allow happens soon before the spike happen.This indicator works properly only in boom and crash trading thing which you have to consider when
The Volumebyprice.com Indicator for MetaTrader 5 features Volume Profile and Market Profile TPO (Time Price Opportunity). Volume and TPO histogram bar and line charts. Volume Footprint charts. TPO letter and block marker collapsed and split structure charts. Session filtering and grouping. Static, dynamic and flexible range segmentation and compositing methods with relative and absolute visualizations. Graphical layering, positioning and styling options to suit the user's analytic and aesthetic
Volality Index Scalper
Lesedi Oliver Seilane
5 (1)
Volality Index scalper indicator  Meant for Volality pairs such as Volality 10, 25, 50, 75 and 100 The indicator works on all timeframes from the 1 minute to the monthly timeframe the indicator is non repaint the indicator has 3 entry settings 1 color change on zero cross 2 color change on slope change 3 color change on signal line cross Orange line is your sell signal Blue line is your buy signal.
Mine Farm
Maryna Kauzova
5 (1)
Mine Farm is one of the most classic and time-tested scalping strategies based on the breakdown of strong price levels. Mine Farm is the author's modification of the system for determining entry and exit points into the market... Mine Farm - is the combination of great potential with reliability and safety. Why Mine Farm?! - each order has a short dynamic Stop Loss - the advisor does not use any risky methods (averaging, martingale, grid, locking, etc.) - the advisor tries to get
¡El nivel Premium es un indicador único con más del 80% de precisión de predicciones correctas! ¡Este indicador ha sido probado por los mejores especialistas en comercio durante más de dos meses! ¡El indicador del autor no lo encontrarás en ningún otro lugar! ¡A partir de las capturas de pantalla, puede ver por sí mismo la precisión de esta herramienta! 1 es ideal para operar con opciones binarias con un tiempo de vencimiento de 1 vela. 2 funciona en todos los pares de divisas, accion
US30NinjaMT5
Satyaseelan Shankarananda Moodley
US30 Ninja is a 5 minute scalping indicator that will let know you when there is a trade set up (buy or sell). Once the indicator gives the trade direction, you can open a trade and use a 30 pip stop loss and a 30 pip to 50 pip take profit. Please trade at own own risk. This indicator has been created solely for the US30 market and may not yield positive results on any other pair. 
You can change the time period of the chart at the touch of a button. You can also change multiple charts at the touch of a button. You can also change multiple charts at the touch of a button,   saving you the trouble of changing time periods. We are live-streaming the actual operation of the system. Please check for yourself if it is usable. Please check it out for yourself. https://www.youtube.com/@ganesha_forex We do not guarantee your investment results. Investments should be made at y
PZ Trend Trading MT5
PZ TRADING SLU
3.67 (3)
Trend Trading es un indicador diseñado para sacar el máximo provecho posible de las tendencias que tienen lugar en el mercado, mediante el cronometraje de retrocesos y rupturas. Encuentra oportunidades comerciales al analizar qué está haciendo el precio durante las tendencias establecidas. [ Guía de instalación | Guía de actualización | Solución de problemas | FAQ | Todos los productos ] Opere en los mercados financieros con confianza y eficiencia Aproveche las tendencias establecidas sin s
Before installing the HeatMap indicator make sure you are using a broker that gives you access to the Depth of market (DOM) !! This indicator creates a heatmap on your chart allowing you to see the buy or sell limit orders easily and in real time. You have the possibility to change the setting and the colors of the HeatMap in order to adapt to all markets and all charts. Here is an example of a setting you can use with the NASDAQ100 on the AMPGlobal broker :  https://www.youtube.com/watch?v=x0
Market Profile MetaTrader System  — is a classic Market Profile implementation that can show the price density over time, outlining the most important price levels, value area, and control value of a given trading session. This indicator can be attached to timeframes between M1 and D1 and will show the Market Profile for daily, weekly, monthly, or even intraday sessions. Lower timeframes offer higher precision. Higher timeframes are recommended for better visibility. It is also possible to use a
Este es un indicador MTF de niveles de soporte y resistencia basado en los   extremos del indicador Advanced ZigZag Dynamic   y / o   Extended Fractals   con etiquetas de precio (se puede deshabilitar). Se pueden seleccionar TF más altos para el modo MTF. De forma predeterminada, los niveles se generan en función de los puntos indicadores de ZigZag. Los puntos indicadores de fractales también se pueden usar junto con ZigZag o en su lugar. Para simplificar el uso y ahorrar tiempo de CPU, el cálcu
Snipeer2
Ignacio Agustin Mene Franco
Sniper2 ,  Cuenta con puntos  de lineas , con colores que te estan mostrando una entrada ,  que funcionan como soporte y resistencia !  las lineas de puntos verdes verde muestra entrada en venta ,  las lineas de puntos rojos muestra entrada en compra , fijarse en los soportes   que funcionan como roptura para agarrar velas largas en mayor temporalidad .  funciona para forex todo los pares  funciona para indices sinteticos todo los pares !  indicador en oferta ! 
Una de las secuencias numéricas se llama "Secuencia de incendios forestales". Ha sido reconocida como una de las secuencias nuevas más bellas. Su característica principal es que esta secuencia evita tendencias lineales, incluso las más cortas. Es esta propiedad la que formó la base de este indicador. Al analizar una serie de tiempo financiera, este indicador intenta rechazar todas las opciones de tendencia posibles. Y solo si falla, entonces reconoce la presencia de una tendencia y da la señal
Magic Finger can help you identify trends and trading opportunities clearly. The finger points to the open position signal, and the discoloration line is confirmed by the trend. If you are a day trader, you can choose to trade during a period of active trading, referring to the discoloration line as the basis for the next order, finger signal as a filter. If you are a trend trader, you can choose a period above H1, wait for the appearance of the finger signal in the key price area, and enter
Owl Smart Levels MT5
Sergey Ermolov
4.39 (38)
Versión MT4  |  FAQ El Indicador Owl Smart Levels es un sistema comercial completo dentro de un indicador que incluye herramientas de análisis de mercado tan populares como los fractales avanzados de Bill Williams , Valable ZigZag que construye la estructura de onda correcta del mercado y los niveles de Fibonacci que marcan los niveles exactos de entrada. en el mercado y lugares para tomar ganancias. Descripción detallada de la estrategia Instrucciones para trabajar con el indicador Asesor de c
Market profile was developed by Peter Steidlmayer in the second half of last century. This is a very effective tool if you understand the nature and usage. It's not like common tools like EMA, RSI, MACD or Bollinger Bands. It operates independently of price, not based on price but its core is volume. The volume is normal, as the instrument is sung everywhere. But the special thing here is that the Market Profile represents the volume at each price level. 1. Price Histogram The Price Histogram
Heikin Ashi candlesticks are a powerful tool for traders, offering a clear and smooth visualization of market trends. Unlike traditional candlesticks, they filter out market noise, providing a cleaner view of the market's direction and strength, which helps traders make more informed decisions. The Hull Heikin Ashi Smoothed indicator from Minions Labs takes this a step further by integrating the Hull Moving Average for enhanced smoothing and precision. This indicator not only simplifies trend id
The Supernova Momentums indicator simplifies the visual perception of the price chart and reduces the time for analysis: if there is no signal, the deal is not opened, and if an opposite signal appears, it is recommended to close the current position. This arrow indicator is designed to determine the trend. Supernova Momentums implements a trend trading strategy, filters out market noise, and includes all the necessary features in one tool. Its work is based on automatically determining the c
El indicador de sesiones de trading destaca los inicios y finales de cada sesión de trading . Versión de pago del producto Trading_Sessions_Indicator_Free con la posibilidad de personalizar el Inicio/final de las sesiones. [OPCIONES] Asian session Open Asian session Close Asian session OpenSummertime Asian session CloseSummertime European session Open European session Close European session Open European session Close Timeshift Utilice los marcos de tiempo M15-H2 para obtener los mejores
Ante todo, vale la pena enfatizar que esta Herramienta de Trading es un Indicador No Repintado, No Redibujado y No Retrasado, lo que la hace ideal para el trading profesional. Curso en línea, manual del usuario y demostración. El Indicador de Conceptos de Acción del Precio Inteligente es una herramienta muy potente tanto para traders nuevos como experimentados. Combina más de 20 indicadores útiles en uno solo, combinando ideas avanzadas de trading como el Análisis del Trader del Círculo Inte
Laguerre SuperTrend Clouds   adds an Adaptive Laguerre averaging algorithm and alerts to the widely popular SuperTrend indicator. As the name suggests,   Laguerre SuperTrend Clouds (LSC)   is a trending indicator which works best in trendy (not choppy) markets. The SuperTrend is an extremely popular indicator for intraday and daily trading, and can be used on any timeframe. Incorporating Laguerre's equation to this can facilitate more robust trend detection and smoother filters. The LSC uses the
HMA Trend Professional MT5
Pavel Zamoshnikov
4.5 (6)
Improved version of the free HMA Trend indicator (for MetaTrader 4) with statistical analysis. HMA Trend is a trend indicator based on the Hull Moving Average (HMA) with two periods. HMA with a slow period identifies the trend, while HMA with a fast period determines the short-term movements and signals in the trend direction. The main differences from the free version: Ability to predict the probability of a trend reversal using analysis of history data. Plotting statistical charts for analyz
Provided Trend is a complex signal formation indicator. As a result of the work of internal algorithms, you can see only three types of signals on your chart. The first is a buy signal, the second is a sell signal, and the third is a market exit signal. Options: CalcFlatSlow - The first parameter that controls the main function of splitting the price chart into waves. CalcFlatFast - The second parameter that controls the main function of splitting the price chart into waves. CalcFlatAvg - Par
Scanner
Ervand Oganesyan
Escáner de mercado multiplazo y multisímbolo. El indicador probará la estrategia técnica seleccionada en todos los instrumentos y plazos de su elección y mostrará los resultados del escaneo en una fracción de segundo. Caso de uso Inicie el indicador, establezca el tiempo de negociación y la lógica comercial. Asegúrese de que los resultados del escaneo sean rentables en la mayoría de los instrumentos, luego cambie al gráfico deseado con un solo clic del mouse. Las señales comerciales están list
¿Cansado de trazar líneas de soporte y resistencia? La resistencia de soporte es un indicador de marco de tiempo múltiple que detecta y traza automáticamente los soportes y las líneas de resistencia en el gráfico con un giro muy interesante: a medida que los niveles de precios se prueban con el tiempo y aumenta su importancia, las líneas se vuelven más gruesas y oscuras. [ Guía de instalación | Guía de actualización | Solución de problemas | FAQ | Todos los productos ] Mejora tu análisis técnic
Los compradores de este producto también adquieren
SMCpro
Arief
5 (1)
Currently Price  20% OFF  ( for unlimited use ) Indicator   USER MANUAL , trade setups, solving issues, etc :  Direct Download Here     (  for users only  ) Hello World! Introducing.. SMCpro tool and Indicator for  MetaTrader 5 , a cutting-edge feature designed to revolutionize your trading experience. With innovative ICT Smart Money Concept, you gain unparalleled insight into market dynamics, empowering you to make informed trading decisions like never before. SMC Indicator built on th
Go Way TREND
Ywsf Hsyn Hmad Alrsh
Vaya con la tendencia.  Sí, espera una señal de entrada, ya sea de compra o de venta, y entra con el precio, y se toma la ganancia cuando cambia la línea del dibujo, se contabiliza la ganancia o cuando aparece una señal contraria. Es muy simple y funciona en todos. divisas, metales, índices y en todos los marcos.   ¿Cómo entrar?  Espere una señal de compra o venta y entre con ella. Puede tomar o reservar ganancias después de que aparezca un cambio en la línea del dibujo o la aparición de una señ
Dragon Multi Indicator MT5
Mansour Babasafary
5 (5)
3 Indicators in 1 indicator Strategy based on price action Made specifically for the best forex currency pairs Can be used in the best time frame of the market at a very reasonable price This indicator is basically 3 different indicatos . But we have combined these 3 indicators in 1 indicator so that you can use 3 indicators at the lowest price. All three strategies are based on price action. But based on different trends. Long term, medium term and short term Attributes : No repaintin
TrendMaestro5
Stefano Frisetti
note: this indicator is for METATRADER4, if you want the version for METATRADER5 this is the link:  https://www.mql5.com/it/market/product/108106 TRENDMAESTRO ver 2.4 TRENDMAESTRO recognizes a new TREND in the bud, he never makes mistakes. The certainty of identifying a new TREND is priceless. DESCRIPTION TRENDMAESTRO identifies a new TREND in the bud, this indicator examines the volatility, volumes and momentum to identify the moment in which there is an explosion of one or more of these data a
Piranha version 2
Maria Strudov
5 (1)
"Piranha" - an autonomous trading system that determines overbought and oversold levels on the chart. Red and blue zones represent overbought and oversold levels respectively. Entry points are marked with arrows: a downward arrow in the red zone for "sell" and an upward arrow in the blue zone for "buy". The Take profit level is indicated by the green moving average. Key features: Adjusting the Take profit level as the green moving average changes position. Averaging ability when a new market e
ESTE INDICADOR, BASADO EN INTELIGENCIA ARTIFICIAL, identifica posibles puntos de reversión del mercado leyendo la huella y señala CON ANTICIPACIÓN pequeños movimientos del mercado antes de que ocurran. A diferencia de los indicadores de precio y volumen, que generan entradas "tardías", es decir, cuando ya se ha producido una confirmación en el precio o en el volumen de un cambio de dirección y, por lo tanto, a menudo el movimiento ya ha terminado, este indicador señala, basándose en lo que lee
FxaccurateLS
Shiv Raj Kumawat
WHY IS OUR FXACCCURATE LS MT5 THE PROFITABLE ? PROTECT YOUR CAPITAL WITH RISK MANAGEMENT Gives entry, stop and target levels from time to time. It finds Trading opportunities by analyzing what the price is doing during established trends. POWERFUL INDICATOR FOR A RELIABLE STRATEGIES We have made these indicators with a lot of years of hard work. It is made at a very advanced level. Established trends provide dozens of trading opportunities, but most trend indicators completely ignore them!
Introduction to X3 Chart Pattern Scanner X3 Cherart Pattern Scanner is the non-repainting and non-lagging indicator detecting X3 chart patterns including Harmonic pattern, Elliott Wave pattern, X3 patterns, and Japanese Candlestick patterns. Historical patterns match with signal patterns. Hence, you can readily develop the solid trading strategy in your chart. More importantly, this superb pattern scanner can detect the optimal pattern of its kind. In addition, you can switch on and off individu
Introducing the South African Sniper indicator created by a small group of traders with a few years trading trading the financial market profitably . This is a plug and play indicator that provides you with  BUY and SELL (SNIPER ENTRY) signals with TARGET and trail stops. The indicator Works with all MT5 trading instruments. The indicator uses previous  chart data as receipt to speculate on future market moves.  "The South African Sniper indicator community are very happy with the indicator an
Difícil de encontrar y escasa en frecuencia, las divergencias son uno de los escenarios comerciales más confiables. Este indicador busca y escanea las divergencias regulares y ocultas automáticamente usando su oscilador favorito. [ Guía de instalación | Guía de actualización | Solución de problemas | FAQ | Todos los productos ] Fácil de comerciar Encuentra divergencias regulares y ocultas Admite muchos osciladores bien conocidos Implementa señales comerciales basadas en rupturas Muestra n
Scalping Tool for Deriv Description: This trading indicator is designed for traders specializing in scalping. It provides signals for trading in the direction of short-term price movements. The indicator is optimized for use on the M1 timeframe and supports Boom and Crash indices (300, 500, 1000). Features: Trading direction: towards short-term price movements. Filters and indicators: Reaction volume indicator: displays activity zones. Trend indicator: analyzes price movement direction. Maxim
All in One package includes the  Oscillator Predictor ,  MACD Predictor ,  Thrust Scanner  and  Advanced Fibonacci  indicators which are mandatory for applying  Dinapoli  trade plans.  Please visit below links for detailed explanations of indicators. Advanced Fibonacci Indicator =>  https://www.mql5.com/en/market/product/107933 Thrust Scanner Indicator =>  https://www.mql5.com/en/market/product/52829 Overbought /Oversold Predictor indicator => https://www.mql5.com/en/market/product/52628 Macd
PZ Swing Trading MT5
PZ TRADING SLU
5 (4)
Swing Trading es el primer indicador diseñado para detectar oscilaciones en la dirección de la tendencia y posibles oscilaciones de reversión. Utiliza el enfoque de intercambio de línea de base, ampliamente descrito en la literatura comercial. El indicador estudia varios vectores de precios y tiempos para rastrear la dirección de la tendencia agregada y detecta situaciones en las que el mercado está sobrevendido o sobrecomprado y listo para corregir. [ Guía de instalación | Guía de actualización
PZ Day Trading MT5
PZ TRADING SLU
2.83 (6)
Este indicador detecta reversiones de precios en forma de zig-zag, utilizando solo análisis de acción de precios y un canal donchian. Ha sido diseñado específicamente para el comercio a corto plazo, sin repintar ni pintar en absoluto. Es una herramienta fantástica para comerciantes astutos con el objetivo de aumentar el tiempo de sus operaciones. [ Guía de instalación | Guía de actualización | Solución de problemas | FAQ | Todos los productos ] Increíblemente fácil de comerciar Proporciona
IVISTscalp5
Vadym Zhukovskyi
5 (5)
Te presentamos el indicador iVISTscalp5, que no solo es único sino también efectivo en operaciones de trading. Este indicador se basa en datos temporales y es el resultado de muchos años de experiencia y análisis profundo de los mercados financieros. El indicador iVISTscalp5 es una excelente herramienta para el trading manual. La conveniencia, simplicidad y visualización, toda la complejidad está oculta en su interior. Hemos simplificado al máximo la configuración y uso del indicador iVISTscalp5
El indicador genera señales de entrada para OPCIONES BINARIAS, dibujando una flecha en el gráfico y emitiendo una alerta audible. HORARIO DE FUNCIONAMIENTO: 6:00 GMT/ 17:00 GMT (no recomendado después de las 17:00 GMT y durante la noche debido a la volatilidad demasiado baja y la falta de volúmenes) PARES: EUR/USD (@EU6), GBP/USD (BP6). Plazos: 1,2,3,5,10,15 minutos Mejor marco de tiempo: 3 minutos CADUCIDAD: 1 vela El indicador necesita volúmenes reales (sin volúmenes de ticks) para
Introducing the Power Trade Plus indicator designed by a small group of traders with a few years of experience trading the market profitably.  The Power Trade Plus is derived from the Power Trade indicator,  the indicator strive in powerful sniper entries and take profit levels,  with an algorithm that's can determine the markets volatility and Provides entries based on the current market volatility. This indicator is much more effective in stock ,currencies and indices.
EQ Cutrim Theory
Marco Aurelio Santos Costa
Ronal Cutrim has been a dedicated mathematician for 14 years and has more than 10 years of experience in the financial market. The concept of the theory is simple, find imbalance between buyers and sellers. Which makes a lot of sense, because nothing goes up forever, nothing falls forever.   When you find an asset with a mathematical probability of unbalanced equilibrium, it is a great way to get into trading:  TUTORIAL: Turn on the subtitles, the video is subtitled
Offer 249 down from 350 for the next 1 copies. then back to 350 $ Are you tired of using outdated indicators that leave you guessing where to set your profit targets? Look no further than the AK CAP Opening Range Breakout Indicator. This powerful tool is backed by a US patent and has already helped countless traders pass funded challenges like FTMO. We use it daily on our prop traders and internal funds, and now it's available to you as well. The calculation behind the indicator is incredibly
Eng Gold
Ely Alkrar Xshkaky
ENG-GOLD Scalper It is an auxiliary indicator that identifies potential targets and determines the place of entry with a stop loss that works on Heiken Ashi candles  The green lines are usually the targets, the red lines are the stop loss, and the yellow lines are the entry location.  This file is recognized on small and medium frames, usually less than the watch frame I highly recommend using XAUUSD US100 US30 USOIL 
NIVELES CRITICOS DE RAD Los procesos de Acumulación y Distribución de Volumen generan los soportes y resistencias naturales del mercado.  A medida que estos proceso se generan, los niveles en los que el volumen relevante se posiciona se convierten en zonas de difíciles de franquear al alza o a la baja. El indicador RAD,   rastrea el Volumen Relevante en tiempo real, identificando los  procesos de acumulación y distribución, graficándolos como  zonas de SOPORTE o RESISTENCIA.  Mediante el uso de
Weis Wave with Alert MT5
Trade The Volume Waves Single Member P.C.
4.93 (15)
Rental/Lifetime Package Options and Privileges  * For optimum results the yearly or lifetime package is suggested due to live training ! Rent Monthly Six Months   Yearly/Lifetime Weis Wave with Speed with Alert+Speed Index x x x Manual  x x x Quick Set up Video x x x Blog x x x Lifetime Updates x x x Setup and Training Material x x Free Rectangle Break Alert Tool      x Discord Access Channel "The SI traders" x 2-hour live methodology training x How to trade with it:    http://
VTrende Pro
Andrii Diachenko
5 (1)
VTrende Pro - MTF indicator for trend trading with a display panel for MT5 *** Videos can be translated into any language using subtitles (video language - Russian) Although the signals of the VTrende Pro indicator can be used as signals of a full-fledged trading system, it is recommended to use them in conjunction with the Bill Williams TS. VTrende Pro is an extended version of the VTrende indicator. Difference between Pro version and VTrende: - Time zones - Signal V - signal 1-2 waves
Elliot Waves Analyzer Pro
Viktor Weidenthal
3.25 (4)
Elliot Waves Analyzer Pro calculates Elliot Waves to Help Identify Trend direction and Entry Levels. Mainly for Swing Trading Strategies. Usually one would open a Position in trend direction for Wave 3 or a Correction for Wave C . This Indicator draws Target Levels for the current and next wave. Most important Rules for Elliot Wave Analysis are verified by the Indicator.  The Pro version analyzes Multiple Timeframes and shows the Subwaves and Target-Levels.   For an Overview  " Elliot Waves Anal
INDICADOR basado en INTELIGENCIA ARTIFICIAL que genera posibles entradas de compra y venta de opciones binarias. El indicador funciona con 3 estrategias diferentes: 1) al leer volúmenes, envía una señal cuando el precio debería revertirse 2) a través de la divergencia entre precio y volumen, envía una señal de cuándo la tendencia debe continuar o revertirse 3) a través de la convergencia entre precio y volumen, envía una señal de cuándo debe continuar la tendencia. el indicador fu
Multi-currency, multi-timeframe, harmonic pattern indicator AB = CD. Supports sending push notifications about signals to a mobile device, messages on e-mail, as well as messages using alerts on all available currency pairs and timeframes. This indicator was based on the indicator Harmonic ABCD Universal. Version for MetaTrader 5:  https://www.mql5.com/en/market/product/44972 . See also: Harmonic ABCD Universal for MetaTrader 4 . Using modern software development methods has made the indicator a
Fibonacci Suavizado
Cesar Juan Flores Navarro
Indicador en MQL5, que obtiene el promedio de 10 EMAS, que son alineadas según Fibonacci, obteniendo un promedio, que sera suavizado.  Se puede ingresar un numero desde 2 a N, que multiplica a los EMA-Fibonacci. Funciona en cualquier criptomoneda, etc. etc... pudiendo calcular el futuro segun la tendencia de las EMAS. Funciona excelentemente en tramos largos, determinando exactamente el mejor inicio/salida. El precio inicial por apertura sera por un periodo de tiempo, luego aumentará.
TREND HARMONY MT5 – Multi Timeframe Trend and Phase and Pullback Level Visualizer indicator for Metatrader5 The TREND HARMONY indicator automates deep trend analysis and generates visualizations for you. Take control of your trades by eliminating uncertainty! Revolutionize your trading experience with precision and insight through the TREND HARMONY Multi Timeframe indicator – your ultimate MT5 trend visualization indicator. [  Features and Manual   | MT4 version |   All Products   ] Are you t
The indicator is designed to close positions on the market in time. For example: to take profits ahead of schedule if the price has not reached TakeProfit, and the market is turning around. The indicator analyzes the momentum, not the trend. He does not give any information about the trend. The indicator is well suited for finding divergence. The Ershov 38 Parrots indicator dynamically adjusts to the market and detects price movement impulses of medium and high amplitude. It almost does not rea
DOWN and UP trend
Ywsf Hsyn Hmad Alrsh
It makes it easier for you to trade by providing trend charts in all frames from bottom to top. If it touches the upward trend, it is a good opportunity to sell, and the target is the downward trend, and vice versa. If it touches the downward trend, it is a good opportunity to buy, and the target is the upward trend. It can automatically redraw the trend. You can monitor higher frames and trade on lower frames for speculation .
Otros productos de este autor
NakaTrend
Ricardo De Andrade Nakano
"Presentamos NakaTrend: ¡Su Detector de Tendencias Definitivo para MetaTrader 5! ¿Listo para revolucionar su experiencia de trading? Conozca a NakaTrend, su indicador de confianza para identificar cambios de tendencia con precisión y facilidad. Con NakaTrend, nunca más perderá una oportunidad de capitalizar cambios en el mercado. Cuando surge una tendencia alcista, NakaTrend la señala con un signo de dólar verde, indicándole que ingrese una orden de compra. Y cuando la tendencia se vuelve b
FREE
NakaTrendBot
Ricardo De Andrade Nakano
¡Presentamos NakaTrendBot: tu compañero definitivo en el trading de tendencias! ¿Estás cansado de perder oportunidades cuando el mercado cambia? No busques más, porque NakaTrendBot está aquí para ayudarte a navegar en el mundo dinámico del trading de tendencias. NakaTrendBot es más que un simple robot; es una sofisticada máquina algorítmica diseñada para detectar cambios de tendencia y consolidaciones con precisión. Utilizando algoritmos avanzados de aprendizaje automático y análisis técnic
NakaSideBot
Ricardo De Andrade Nakano
¡Presentamos a NakaSideBot - Tu Campeón Definitivo en el Mercado Lateral! ¿Estás cansado de perder oportunidades cuando el mercado cambia de dirección? ¡Saluda a NakaSideBot, tu campeón definitivo en el mercado lateral! Este robot de vanguardia está diseñado para prosperar en condiciones de mercado cambiantes, lo que lo hace perfecto tanto para mercados en tendencia como laterales. NakaSideBot sobresale cuando el mercado hace transiciones o se consolida, aprovechando oportunidades que otros
Filtro:
No hay comentarios
Respuesta al comentario
Versión 1.3 2024.04.07
Adjusted the $ position and added the function to clear the graph when removing the indicator.
Versión 1.1 2024.04.07
Fixed the bug it was not calculating old bars