TradingwievHeikenAshi
- Indicadores
- Volkan Mustafaoglu
- Versión: 1.0
- Activaciones: 5
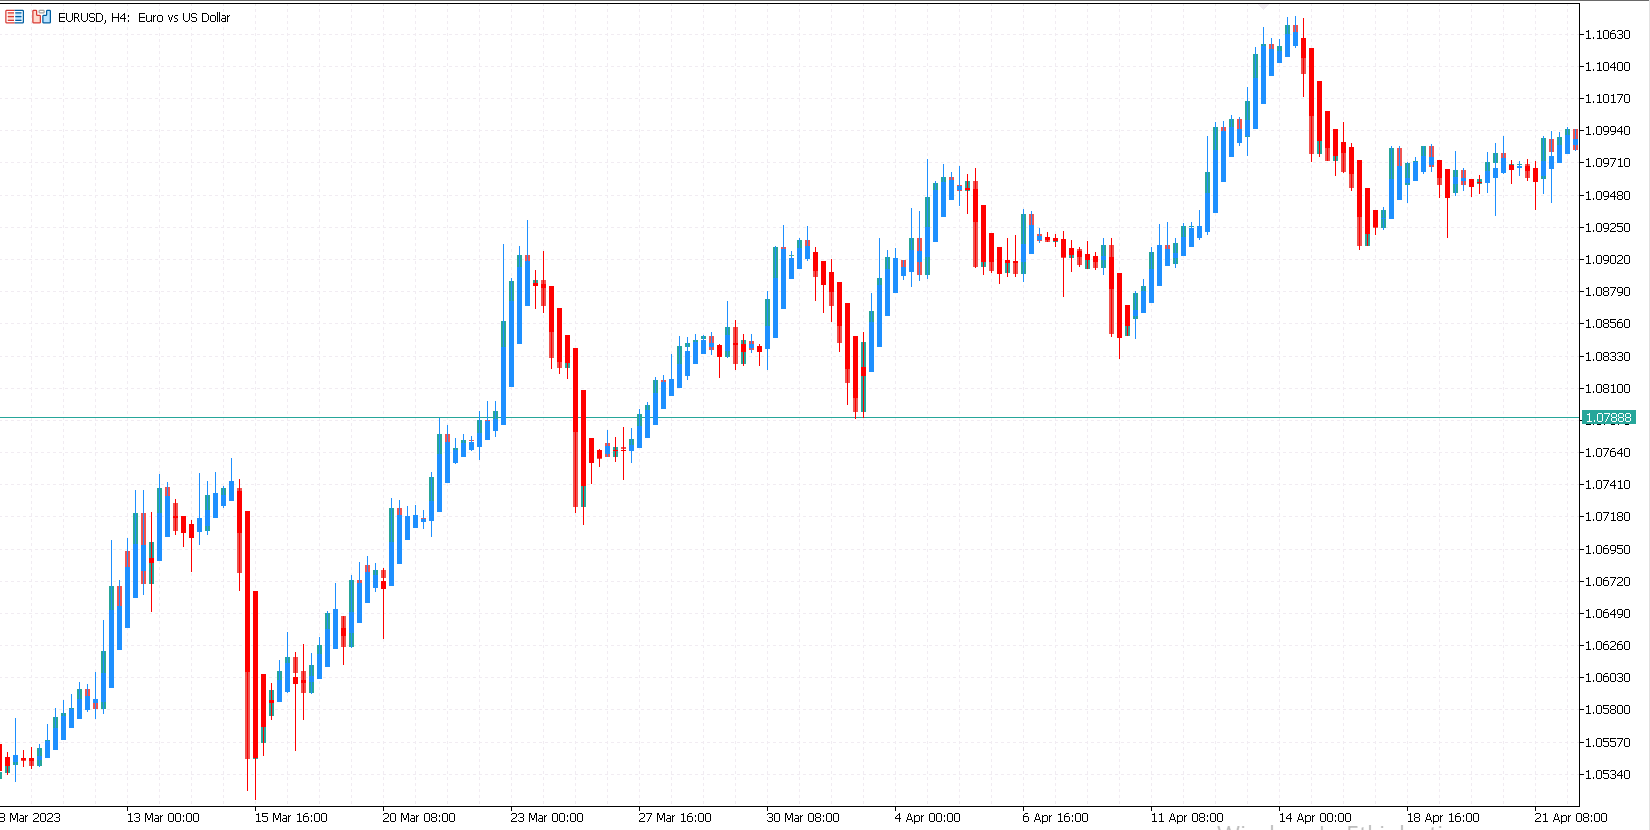
Heikin Ashi
Heikin Ashi is a charting technique that can be used to predict future price movements. It is similar to traditional candlestick charts. However, unlike a regular candlestick chart, the Heikin Ashi chart attempts to filter out some of the market noise by smoothing out strong price swings to better identify trend movements in the market.
To create Heiken Ashi, a formula is used in which price data is entered, while ordinary candles are built only on bare numbers, without using any calculations.
How to calculate candles on Heikin Ashi chart?
Heikin Ashi uses the OCHL formula to calculate: Open, Close, High, Low. These are four components that affect the shape, size and direction of candles. The formula for their calculation is given below:
- Open = (Previous Open + Previous Close) / 2.
In normal candles, the open level is at the close of the previous candle (unless there is a gap in the market). In Heikin Ashi, a new candlestick opens at the intermediate level, between the open and close of the previous one.
- Close = (Close + Open + High + Low) / 4.
The average value of the current candle between the low, high, open and close.
- High = Recent high, highest value of opening or closing value.
Low = Recent low, lowest value of the open or close.
Occasionally some of these values will be equal, which will affect the overall appearance of the chart. The choice of time frame will also have a big impact on the appearance of the chart.
From the above formulas it becomes clear that the current candlestick of the indicator is calculated with a delay, therefore the signals given by Heikin Ashi are of a delayed nature. In this case, the calculation of a new candle will be possible only after the next one appears on the price chart.
When trading volatile assets on small time frames, the indicator can help effectively filter out market noise, false breakouts and entry points. However, it is worth noting that when operating in a market with low volatility and/or on wide time frames, Heikin Ashi will rarely signal.