B4S ICT Key Open Lines
- Indicadores
- Henry Waribu Macharia
- Versión: 2.0
- Actualizado: 1 junio 2024
- Activaciones: 5
Brief Description
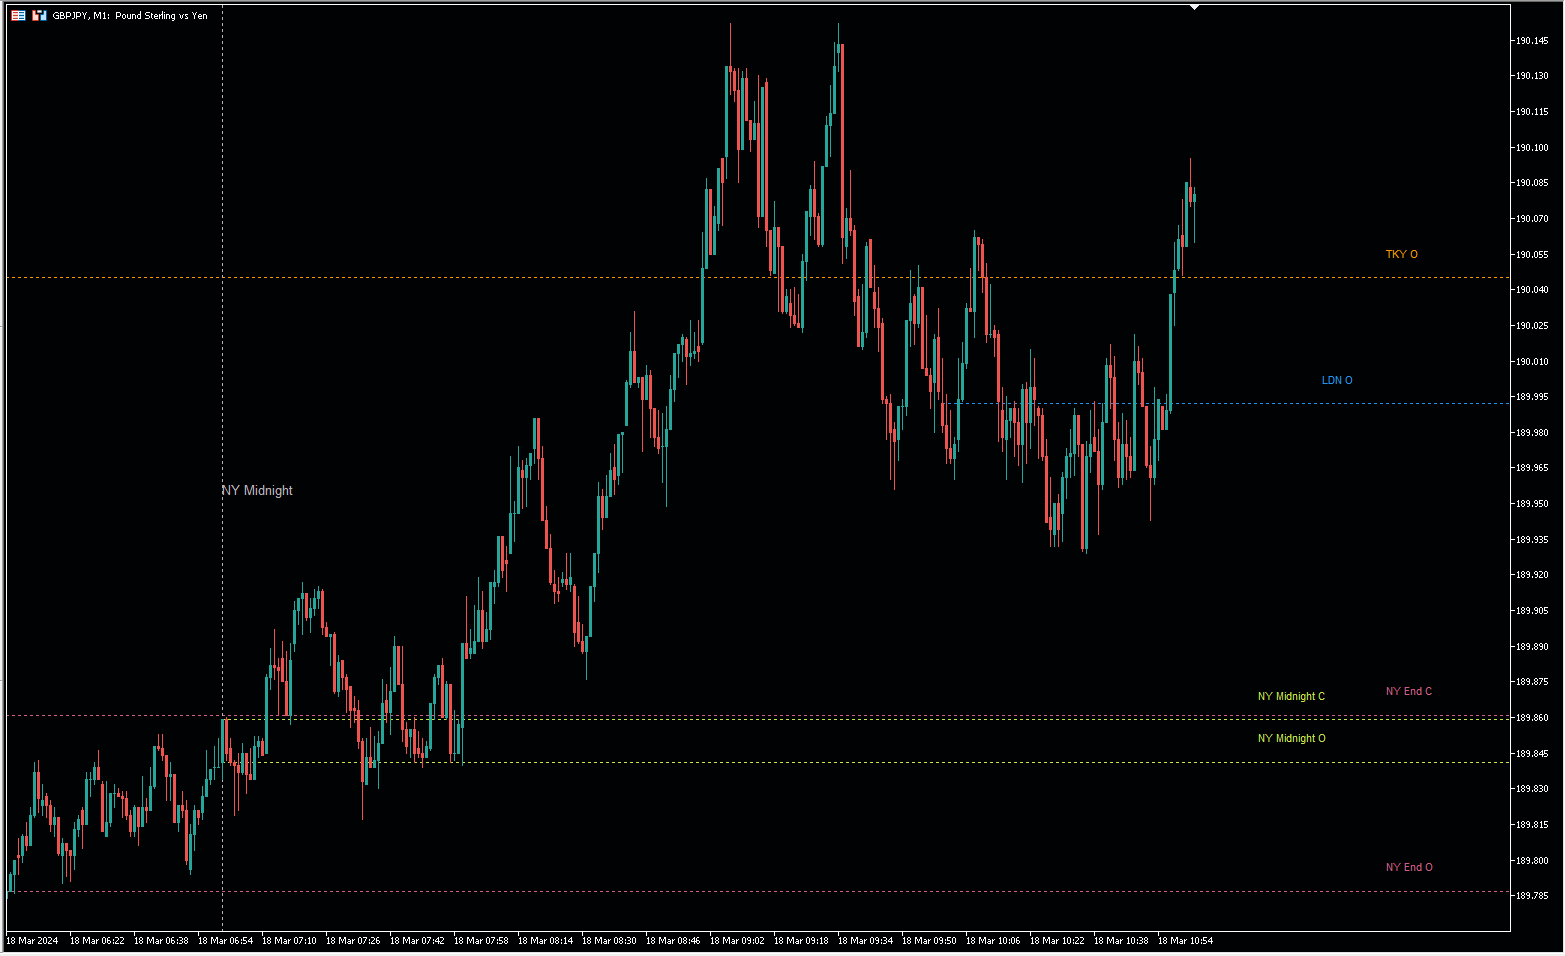
The indicator is a powerful tool based on Inner Circle Trader's trading theory. It strategically plots lines at key prices relative to time, highlighting crucial market moments such as Tokyo Open, New York Midnight, London Open, New York Open, New York 8:30 AM, and New York Session End. The indicator is built on the foundation of Inner Circle Trader's trading theory, emphasizing the significance of key open times as liquidity and reference zones. These zones act as magnets for price action, as market participants seek to execute trades during these pivotal moments.
Features
- Strategic Time-based Lines: The indicator draws lines at essential times based on ICT’s trading model, providing a visual representation of key market moments.
- ICT Trading Theory Integration: Aligned with Inner Circle Trader's teachings, the indicator emphasizes the importance of specific price points in relation to time.
- Persistence of User Settings: Set your preferred configurations once, and they will persist through restarts. Modify settings effortlessly with a simple Boolean toggle in the input section.
- Local Time Zone Input: Users can now enter times according to the local time zone of the key open times (e.g., New York Midnight) without needing to convert to their broker's time zone.
- Automatic Updates: The indicator automatically adjusts and detects new levels as time goes by.
- Automated timezone conversions Automated timezone conversions provide a more user-friendly experience, reducing manual input and potential errors related to time zone conversions.
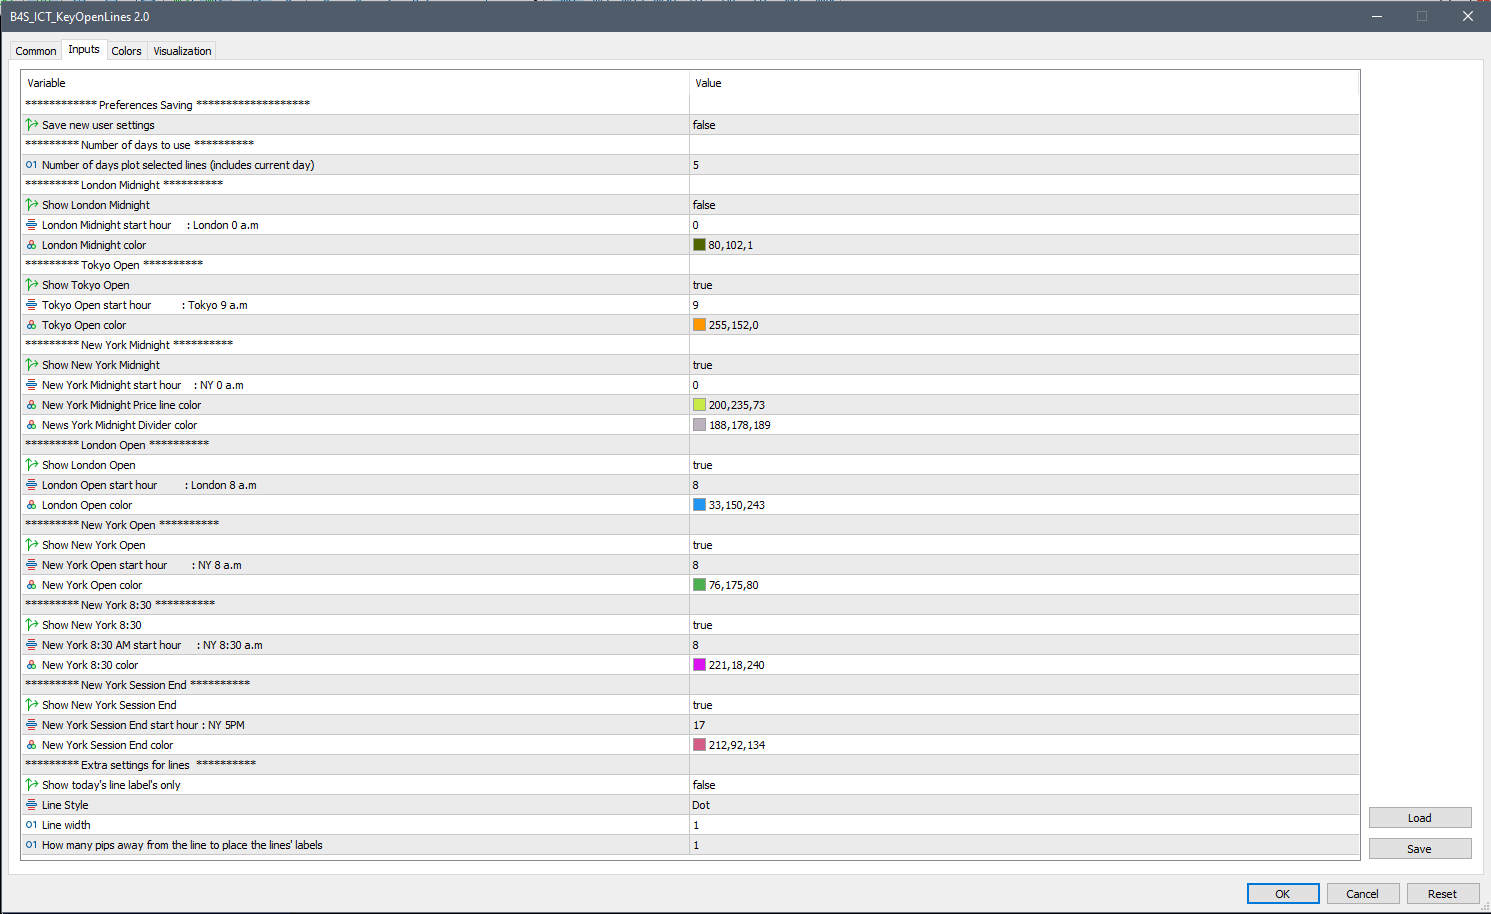
User Settings
- Number of Days to Plot: Customize the number of days for which lines are plotted, including the current day.
- Selective Line Visibility: Toggle visibility for individual lines based on your preference.
- Flexible Starting Hours: Adjust the starting hours for each key open time tailored to the local time zone rather than having to do manual manual timezone conversions.
- Automatic Level Detection: The indicator automatically checks for new levels, enhancing flexibility and adaptability without requiring manual time entry.
- Color Customization: Personalize the appearance with a range of color options for each key open time.
- Line Properties: Fine-tune the visual representation with options for line style, width, and label placement.
Importance of Key Open Time Levels
Strategic Time-Based Analysis
The ICT Key Open Lines Indicator plays a pivotal role in strategic time-based analysis, offering traders valuable insights into the market's rhythm. By plotting lines at key open times, the indicator provides reference points that carry significant importance in predicting price movements.
<- Tokyo Open
Asian Session Kickoff: The Tokyo Open marks the beginning of the Asian trading session. The indicator's line at this time serves as a reference for the initial market sentiment, setting the tone for the day. - New York Midnight
Transition to a New Trading Day: New York Midnight signifies the start of a new trading day. The indicator's line here acts as a reference for traders looking to assess the overnight developments and plan their strategies accordingly. - London Open
European Market Activation: The London Open is crucial as it initiates the European trading session. The corresponding line offers insight into how European traders may respond to overnight developments and news. - New York Open
Liquidity Increase: The New York Open sees a surge in liquidity as it overlaps with the end of the European session. Traders often look to this time for potential breakouts and trend formations. - New York 8:30 AM
Economic Data Releases: The 8:30 AM mark in New York coincides with the release of key economic data. The indicator's line at this time aids traders in anticipating and reacting to market reactions following these releases. - New York Session End
End-of-Day Evaluation: The New York Session End serves as a reference for assessing the day's overall performance. Traders often analyze price action during this time to make informed decisions for the next trading day.
Predictive Value of Time-Relative Price Points
The key open time levels provided by the indicator are not arbitrary; they are strategically chosen based on Inner Circle Trader's trading theory. These levels have proven to be pivotal in understanding market dynamics and predicting potential price movements. Traders can leverage these time-relative price points to:
- Identify Market Turning Points: The indicator's lines offer clues about potential turning points in the market, aiding traders in making timely decisions.
- Plan Entry and Exit Points: By referencing these key open times, traders can strategically plan entry and exit points, aligning their trades with the natural ebb and flow of the market.
- Anticipate Volatility: Certain key open times are associated with increased market activity and volatility. Traders can use this information to anticipate and navigate through volatile market conditions.
How It Integrates with ICT Trading Model
1. Smart Money Accumulation:
- The indicator aligns with ICT's concept of Smart Money, indicating institutional traders strategically accumulating or distributing positions during specific timeframes.
- Key open times, such as London Open and New York Open, are often associated with increased trading activity, creating liquidity zones.
2. Market Maker Behavior:
- ICT's model suggests that market makers play a crucial role in price manipulation.
- By plotting lines at key open times, the indicator provides a visual guide to where market makers may initiate or liquidate positions, influencing price movement.
3. Predictive Nature of Key Times:
- The indicator's lines serve as predictive markers, offering insights into potential price reversals, breakouts, or trend continuations.
- Traders can anticipate market behavior around these zones, enhancing decision-making.
4. Order Flow Dynamics:
- Understanding order flow is central to ICT's approach. Liquidity zones attract orders, leading to increased order flow and potentially significant price movements.
- The indicator's lines serve as reference points for monitoring order flow dynamics.
Why Choose ICT Key Open Lines Indicator
- Strategic Insight: Gain a deeper understanding of the market by visualizing key open times and their impact on price movement.
- Time Efficiency: Save time and effort with persisting user settings, ensuring a seamless trading experience.
- Adaptability: Customize the indicator to align with your trading preferences and strategies.
Holistic Trading Approach
The ICT Key Open Lines Indicator, in conjunction with Inner Circle Trader's trading model, provides traders with a comprehensive framework for understanding market dynamics. By recognizing key open times as liquidity zones, traders can enhance their strategies, improve timing, and gain a deeper insight into the nuanced behavior of price action. This holistic approach empowers traders to make informed decisions in a dynamic and ever-changing market environment.
In essence, the ICT Key Open Lines Indicator goes beyond being a visual tool; it becomes a strategic ally for traders seeking a deeper understanding of time-related price dynamics, enabling them to make more informed and timely trading decisions. Unlock the potential for improved market analysis and decision-making. The ICT Key Open Lines Indicator empowers traders with strategic insights into price movements, enhancing overall trading proficiency.
Related Topics
- B4S
- #ICT Trading Theory
- #Inner Circle Trader Concepts
- #Market Liquidity Zones
- #Key Market Times Analysis
- #Price Action Analysis
- #Institutional Trading
- #Order Flow Dynamics
- #Tokyo Open Strategy
- #London Open Trading
- #NewYork Open Tactics
- #Impact Of Economic News on Open Times
- #Market Volatility During Open Times
- #Price Action Around Key Market Opens
- #Price Behavior During Session Transitions
- #Intraday Price Movements Analysis
- #MarketSentiment During KeyOpens
- #Breakout Trading At Market Opens
- #Range Trading Around Market Opens
- #Impact Of Economic News On Open Times
- #LondonRushHourTrading
- #NYMorningSessionAnalysis
- #AsiaSessionPricePatterns
- #Market Maker Manipulation
- #Smart Money Accumulation
- #Trading Model Analysis
- #MarketVolatilityAnalysis
- #ForexTradingStrategies
- #Liquidity Zones
- #MarketVolatility
- #ICT Mentorship
- #ICT Market Structure Analysis