B4S ICT Historical OHLC Lines
- Indicadores
- Henry Waribu Macharia
- Versión: 2.0
- Actualizado: 4 junio 2024
- Activaciones: 5
Brief Description:
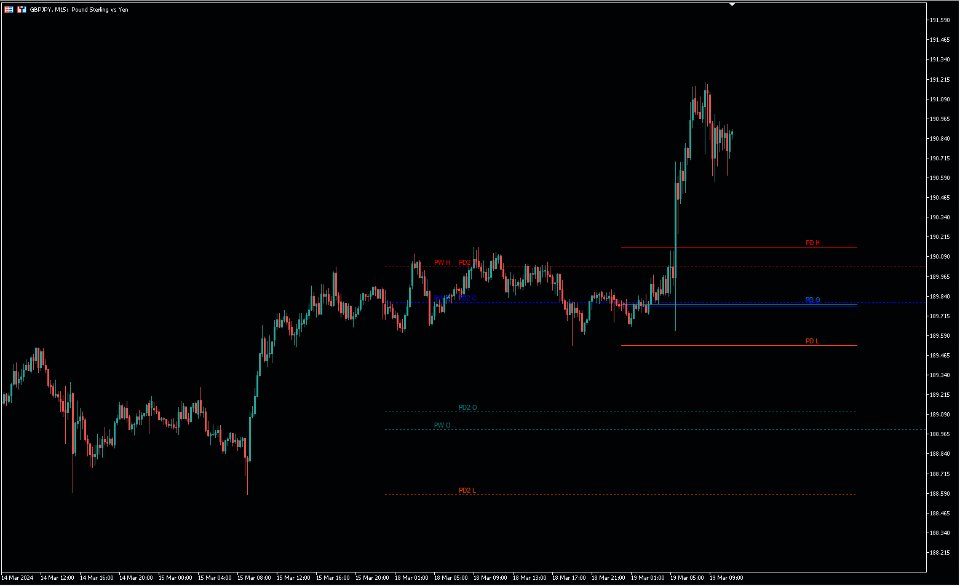
A tool to display historical Open, High, Low, and Close (OHLC) price points for various time periods. Gain insights into market behavior with data from yesterday, the day before, the previous week, and the previous month. Recognize liquidity zones effectively.
Features:
1. Comprehensive Timeframe Insights:
- Visualize crucial OHLC points for different timeframes.
- Historical data for yesterday, day before yesterday, previous week, and previous month.
2. Built on ICT's Teachings:
- Aligned with Inner Circle Trader (ICT) teachings, emphasizing historical price points in predicting future movements.
3. User-friendly Customization:
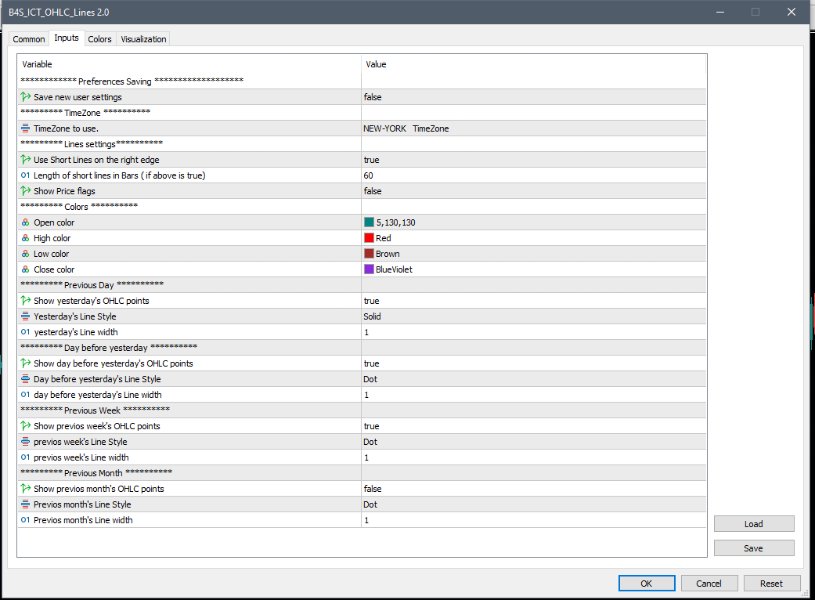
- Customize visibility for each timeframe.
- Choose from various line styles, widths, and colors.
4. Persistent User Settings:
- Set configurations once; they persist through restarts.
- Modify settings with a simple Boolean toggle.
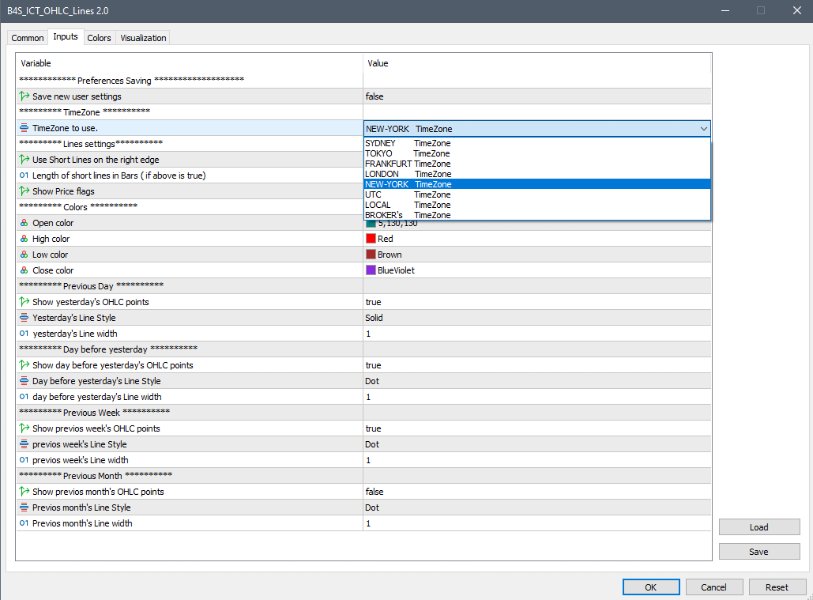
5. Enhanced Time Zone Flexibility:
- Select the time zone for OHLC calculations, rather than defaulting to the local time zone.
6. Neat and Clutter-Free Display:
- Option to draw shorter lines to the right edge of the chart, reducing clutter and making the chart neater.
Using Historical OHLC Levels to understand Market Liquidity:
- Liquidity at Key Levels: Historical OHLC levels are key levels where market participants have shown interest.
- Price Attraction to Historical Zones: Price gravitates towards these historical levels due to liquidity presence.
- Stop-Loss and Take-Profit Zones: Traders set orders around historical OHLC levels, leading to increased activity.
- Institutional Trading Strategies: Institutional traders use historical levels as decision-making reference points.
- Confirmation of Breakouts and Reversals: Significant movements often occur near historical OHLC levels.
- Enhanced Predictive Analysis: Incorporating liquidity zones into technical analysis enhances predictive power.
- Risk Management Considerations: Identifying liquidity zones helps in effective risk management.
- Adaptability to Current Market Conditions: Understanding historical zones helps adapt strategies to current conditions.
Related Topics:
- B4S
- B4S Indicator
- #ICT (Inner Circle Trader)
- #Market Liquidity Zones
- #Historical Price Analysis
- #Key OHLC Levels
- #Price Reactions to Historical Zones
- #Predictive Analysis with OHLC Data
- #Institutional Trading Techniques
- #OHLC Breakout Confirmation
- #Risk Management around OHLC Zones
- #Adaptive Trading Strategies
- #MetaTrader 5 Indicator Insights
- #Technical Analysis Tools
- #Price Behavior Patterns
- #Market Sentiment and OHLC Levels
- #Price Gravity and Liquidity Zones
- #OHLC Support and Resistance Levels
- #Market Depth Analysis with OHLC Data
- #Price Action Strategies with Historical Levels
- #Trading Psychology around OHLC Zones
- #Price Volatility and OHLC Patterns
- #OHLC Trend Identification Techniques
- #Timeframe Analysis for Price Prediction
- #Price Manipulation and OHLC Levels
- #OHLC Scalping Techniques
- #Swing Trading with Historical OHLC Points
- #Price Consolidation Patterns and OHLC Zones
- #OHLC Breakout

