• Información general
  • Comentarios (1)
  • Discusión
  • Novedades

SpectorChart

5
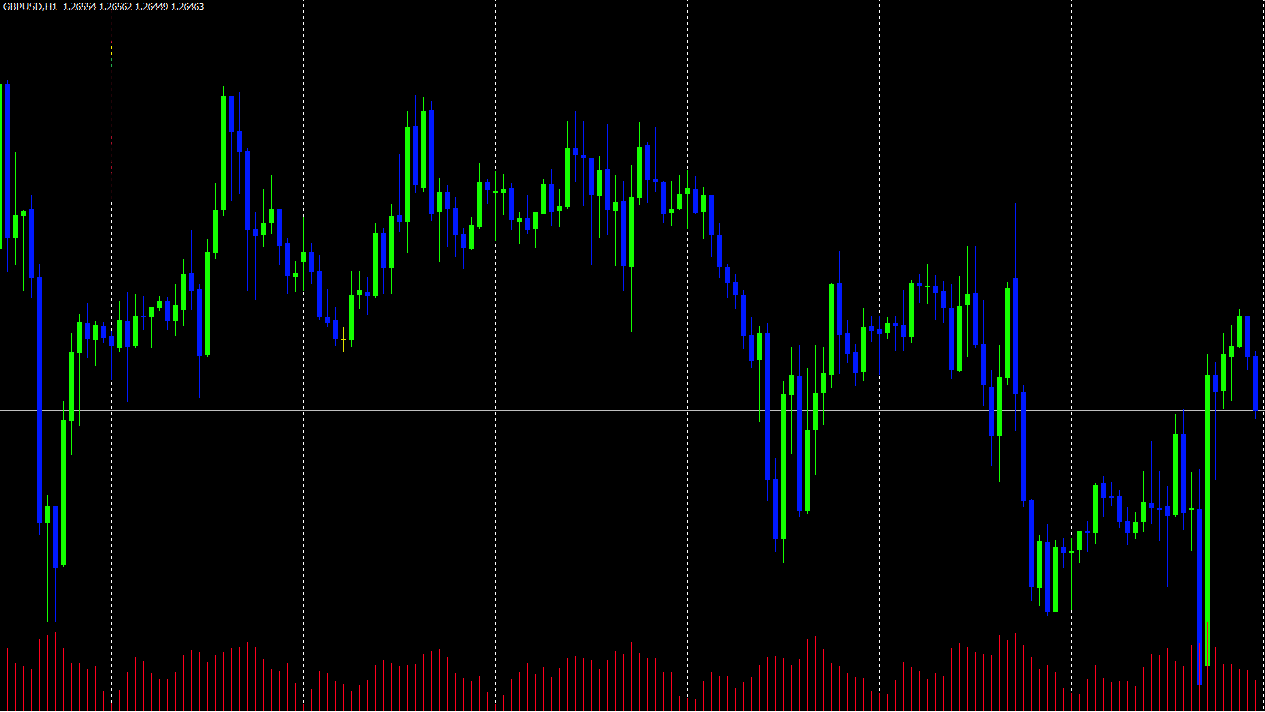
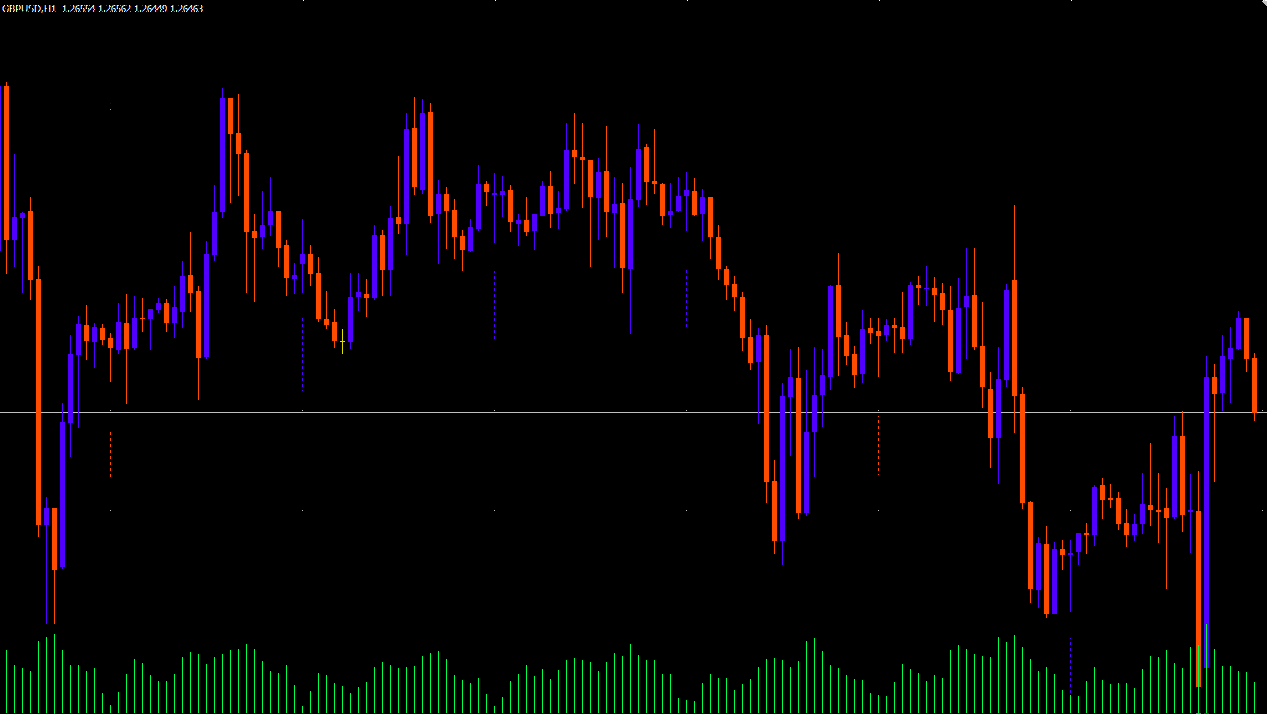
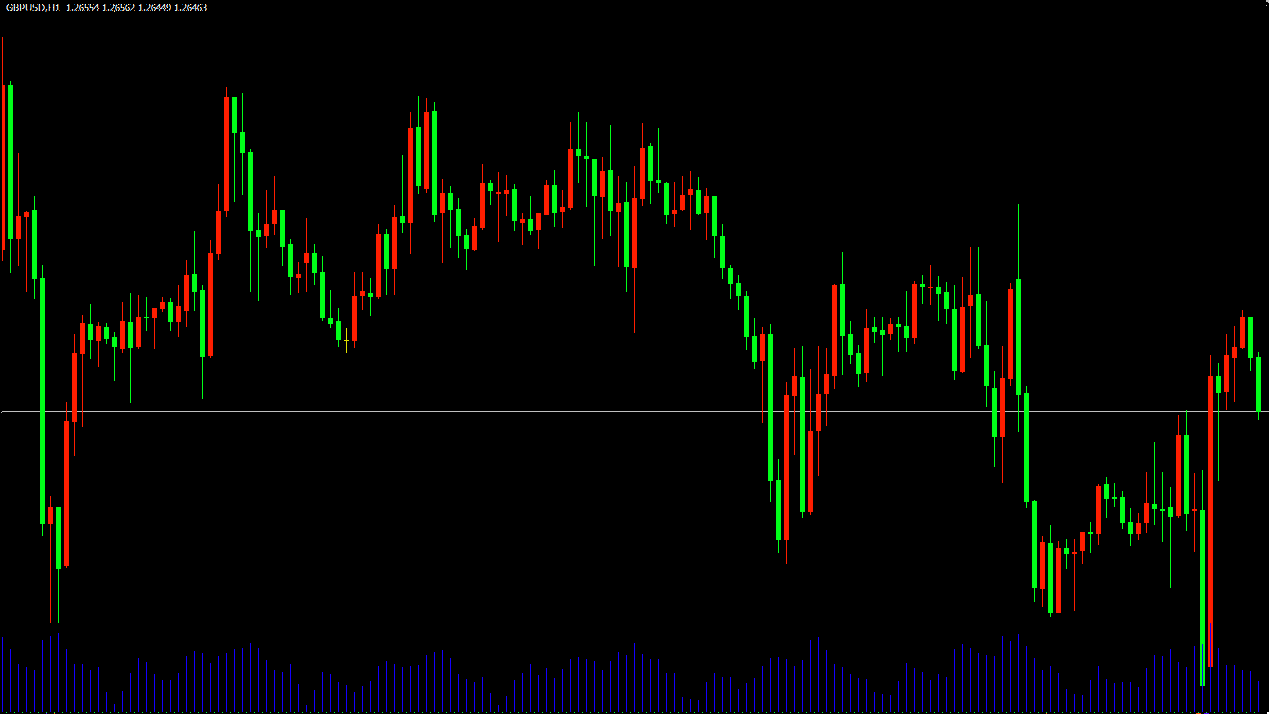
Este indicador cambia continuamente el color de los bordes y cuerpos de las velas, así como el color de los volúmenes en tiempo real. El indicador es fácil de usar. La paleta de colores es variada.
Este producto es una solución gráfica, por lo que es difícil describir lo que hace mediante texto, es más fácil verlo descargándolo, además el producto es gratuito.
El indicador es adecuado para los bloggers que quieren crear una hermosa imagen de un gráfico para la edición de vídeo o comerciantes que quieren hacer su gráfico vivo, cambiando de color en tiempo real.
Comentarios 1
Coreentrades
172
Coreentrades 2024.06.03 09:01 
 

Great support

Productos recomendados
Pointer View
Andrei Gerasimenko
The indicator marks the points on the chart where the standard ZigZag indicator has drawn its top or bottom. With this indicator, you can easily understand where the top or bottom was formed, and where it was redrawn. The indicator gives an alert when a new point appears. Warning! Parameter  Applied Price   -   expands the possibilities of building the indicator.   It is possible to build at OPEN, CLOSE and standard HIGH/LOW prices. Input parameters ----------- Depth   - period of the ZigZag ind
FREE
El indicador "MR BEAST ALERTAS DE LIQUIDEZ" es una herramienta avanzada diseñada para proporcionar señales y alertas sobre la liquidez del mercado basándose en una serie de indicadores técnicos y análisis de tendencias. Ideal para traders que buscan oportunidades de trading en función de la dinámica de precios y los niveles de volatilidad, este indicador ofrece una visualización clara y detallada en la ventana del gráfico de MetaTrader. Características Principales: Canal ATR Adaptativo: Calcula
Forex Gump
Andrey Kozak
2.75 (4)
Forex Gump is a fully finished semi-automatic trading system. In the form of arrows, signals are displayed on the screen for opening and closing deals. All you need is to follow the instructions of the indicator. When the indicator shows a blue arrow, you need to open a buy order. When the indicator shows a red arrow, you need to open a sell order. Close orders when the indicator draws a yellow cross. In order to get the most effective result, we recommend using the timeframes H1, H4, D1. There
Blahtech Market Profile
Blahtech Limited
4.46 (13)
Was: $249  Now: $99   Market Profile defines a number of day types that can help the trader to determine market behaviour. A key feature is the Value Area, representing the range of price action where 70% of trading took place. Understanding the Value Area can give traders valuable insight into market direction and establish the higher odds trade. It is an excellent addition to any system you may be using. Blahtech Limited presents their Market Profile indicator for the MetaTrader community. Ins
MyVolume
Igor Kryuchkov
4.67 (3)
This indicator is an original view on volumes. It is known that volumes show the amount of buyers and sellers for a certain period of time. A candle is used a period of time. Volumes at a candle High show the buyers. Volumes at a candle Low show the sellers. A candle Open shows the Delta. Delta indicates who was dominant on a given candle, buyers or sellers. Input parameters Distance - distance of the volumes text from High and Low. Font size - text font size. The indicator provides levels tha
FREE
Master Scalping M1 es un indicador innovador que utiliza un algoritmo para determinar la tendencia de forma rápida y precisa. El indicador calcula el tiempo de apertura y cierre de posiciones, los algoritmos del indicador le permiten encontrar los momentos ideales para ingresar a una operación (comprar o vender un activo), lo que aumenta el éxito de las transacciones para la mayoría de los comerciantes. Beneficios del indicador: Fácil de usar, no sobrecarga el gráfico con información innecesari
Volume indicator Effect Volume , in the Forex market volumes are unique (tick). This volume indicator demonstrates the level of financial and emotional involvement. When the indicator forms a new top, it indicates that buyers are stronger than sellers over a certain period of time. If the indicator decreases, this indicates that the bears are stronger. Why is it impossible to track normal volumes in Forex? The fact is that this is an over-the-counter market. Consequently, it is practically im
TWO PAIRS SQUARE HEDGE METER INDICATOR Try this brilliant 2 pairs square indicator It draws a square wave of the relation between your two inputs symbols when square wave indicates -1 then it is very great opportunity to SELL pair1 and BUY Pair2 when square wave indicates +1 then it is very great opportunity to BUY pair1 and SELL Pair2 the inputs are : 2 pairs of symbols         then index value : i use 20 for M30 charts ( you can try other values : 40/50 for M15 , : 30 for M30 , : 10 for H1 ,
Matrixs
Andriy Sydoruk
Matrix is a Forex arrow indicator. Displays signals simply and clearly! The arrows show the direction of the transaction, and are colored accordingly, which can be seen in the screenshots. As you can see, trading with such an indicator is easy. I waited for an arrow to appear in the desired direction - I opened a deal. An arrow formed in the opposite direction - closed the deal. The indicator also displays the lines with the help of which the arrow signals are formed, taking into account the int
Introduction It is common practice for professional trades to hide their stop loss / take profit from their brokers. Either from keeping their strategy to the themselves or from the fear that their broker works against them. Using this indicator, the stop loss / take profit points will be drawn on the product chart using the bid price. So, you can see exactly when the price is hit and close it manually.  Usage Once attached to the chart, the indicator scans the open orders to attach lines fo
Super Trend Trading View 4
Mohammad Taher Halimi Tabrizi
The SuperTrend indicator is a popular technical analysis tool used by traders and investors to identify trends in the price of a financial instrument, such as a stock, currency pair, or commodity. It is primarily used in chart analysis to help traders make decisions about entering or exiting positions in the market. this version of super trend indicator is exactly converted from trading view to be used in MT4
Magic Balance
Daniil Evstratenko
The indicator shows which trading pairs, strategies, robots and signals that you use are profitable and which are not. The statistic of trades and balance graph are displayed in the account currency and pips - to switch simply click on the graph. button "$"(top left) - minimize/expand and move the indicator panel button ">"(bottom right) - stretching and resetting to the original size Statistic of trades 1 line - account balance, current profit and lot of open trades; 2 line - the number of al
PipFinite Exit EDGE
Karlo Wilson Vendiola
4.75 (77)
Did You Have A Profitable Trade But Suddenly Reversed? In a solid strategy, exiting a trade is equally important as entering. Exit EDGE helps maximize your current trade profit and avoid turning winning trades to losers. Never Miss An Exit Signal Again Monitor all pairs and timeframes in just 1 chart www.mql5.com/en/blogs/post/726558 How To Trade You can close your open trades as soon as you receive a signal Close your Buy orders if you receive an Exit Buy Signal. Close your Sell orde
El indicador construye cotizaciones actuales, que se pueden comparar con las históricas y, sobre esta base, hacer un pronóstico de movimiento de precios. El indicador tiene un campo de texto para una navegación rápida a la fecha deseada. Opciones: Símbolo - selección del símbolo que mostrará el indicador; SymbolPeriod - selección del período del cual el indicador tomará datos; IndicatorColor - color del indicador; HorisontalShift: cambio de cotizaciones dibujadas por el indicador
Order Book
Thomas Bradley Butler
Combine con Delta Footprint Chart para obtener una imagen completa del perfil de volumen del mercado:   https://www.mql5.com/en/market/product/9415 3 El indicador "Libro de pedidos" muestra un histograma en el gráfico de precios que representa los grupos de volumen de oferta y demanda.   El indicador analiza los datos de precios históricos y calcula los grupos de volumen de oferta y demanda para cada nivel de precio dentro de un número específico de barras. Los grupos de volumen de oferta s
VPO Profile MT4
Kyra Nickaline Watson-gordon
5 (1)
Definition : VPO is a Volume Price Opportunity. Instead of using bars or candles with an Open, High, Low, and Close price, each "bar" in a Market Profile is represented by horizontal bars against the price It is called Market Profile terminology. In other words volume-price-opportunity (VPO) profiles are histograms of how many volumes were traded at each price within the span of the profile. By using a VPO chart, you are able to analyze the amount of trading activity, based on volume, for eac
The Chaikin Oscillator is a technical indicator developed by Marc Chaikin that combines price and volume data to measure the accumulation and distribution of a financial instrument. It aims to identify potential buying and selling opportunities in the market. The Chaikin Oscillator is calculated by subtracting a 10-day exponential moving average of the Accumulation Distribution Line (ADL) from a 3-day exponential moving average of the ADL. Here's how to use the Chaikin Oscillator indicator in tr
This multicurrency indicator is the Lite version of the Cosmic Diviner Reversal Zone Pro indicator. The indicator is based on original formulas for analyzing the volatility and price movement strength. This allows determining the overbought and oversold states of instruments with great flexibility, as well as setting custom levels for opening buy or sell orders when the overbought or oversold values of the instruments reach a user-defined percentage. A huge advantage of Reversal Zone Lite is the
Perfil del mercado Forex (FMP para abreviar) Si prefiere ver esto en un gráfico en vivo en lugar de leer la descripción, puede descargar instantáneamente una demostración gratuita aquí. Que esto no es: FMP no es la pantalla clásica de TPO codificada por letras, no muestra el cálculo general del perfil de datos del gráfico y no segmenta el gráfico en períodos ni los calcula. Que hace : Lo más importante es que el indicador FMP procesará los datos que residen entre el borde izquierdo del
FREE
Price Line
Nikolay Likhovid
High, Low, Open, Close — isn't this too much? Sometimes you need a unique history of prices. But if choose one thing, you lose the rest. Smoothing also leads to data loss. Often you lose one of the most important market details: information about extremes. It is due to the preservation of information about the highs and lows, the correct "smoothing" for the history of price is a zigzag. But zigzags also have drawbacks — they do not provide intermediate values. The Price Line indicator solves thi
FREE
This copier was originally developed for the professional order management of a team of traders and therefore, first of all, a risk manager was built into it. For simple operation, you need to configure the following settings: For the master! 1. Select the program type ''Program mode'' - master 2. Enter a new name for the ''Folder name'' folder, in which the EA will record information on working with orders. The name must be the same for both master and slave!!! 3. In the ''Feedback from
VR Cub
Vladimir Pastushak
VR Cub es un indicador para obtener puntos de entrada de alta calidad. El indicador fue desarrollado para facilitar los cálculos matemáticos y simplificar la búsqueda de puntos de entrada a una posición. La estrategia comercial para la cual se diseñó el indicador ha demostrado su eficacia durante muchos años. La simplicidad de la estrategia comercial es su gran ventaja, que permite que incluso los operadores novatos negocien con éxito con ella. VR Cub calcula los puntos de apertura de posiciones
Noize Absorption Index MT4
Ekaterina Saltykova
5 (1)
Noize Absorption Index - is the manual trading system that measures the difference of pressure between bears forces and bulls forces. Green line - is a noize free index that showing curent situation. Zero value of index shows totally choppy/flat market.Values above zero level shows how powerfull bullish wave is and values below zero measures bearish forces.Up arrow appears on bearish market when it's ready to reverse, dn arrow appears on weak bullish market, as a result of reverse expectation. S
A "Volume Profile" is an advanced charting indicator that displays total volume traded at every price level over a user specified time period. The main components of the volume profile are POC ( Point Of Control - the price level, at which the maximum number of contracts were executed during a selected period), VAH ( Value Area High - the highest price in the Value Area) and VAL ( Value Area Low - the lowest price in the Value Area). When we settled on the original indicator, we spent a lot o
Kangaroo Tailz
Brenden Caleb Luebeck
Looking for an indicator that identifies high-probability price action patterns? Love counter-trend trading? The Kangaroo Tailz indicator might be just for you. This indicator is meant to be used as a reversal detector. I personally would rather enter a position at the beginning of a trend rather than catch the last couple of moves. This indicator does a good job of alerting when price may reverse by identifying price action patterns that occur frequently in markets. Even though this indicator i
Displays the local time with the time difference you set. (It does not correspond to the time difference in 30-minute increments.) It also displays a price line with a good price, such as 100.000 .100 or .200. The standard gridlines are displayed with the time and price by MT4, but they are very confusing as they become the broker's time and are displayed at the halfway point along with the price. It hides them and displays gridlines at user-defined time differences and prices in easy-to-und
Dollar mint indicator is a special workmanship with years of experience in forex.   Dollar mint ea is a fully non repaint indicator optimised with price action data such that once it gives you a signal t . The indicator   can be used to trade anything on the mt4 with much ease. Benefits ; Fully non repaint Use in any timeframe Use in all the available tradable assets on mt4 Best to use on h4. It generates fully analysed buy and sell signals based on trend and also filters out retracement
Limited-Time Offer: Only $49! Get   Insight Flow  now for just   $49   (was $99)! Hurry, this special price is valid until   30th August . After that, the price returns to   $99 . Don't miss out—boost your market analysis today! First and foremost, the Insight Flow Indicator stands out as a Non-Repainting, Non-Redrawing, and Non-Lagging tool. This makes it a prime choice for both manual and algorithmic trading, ensuring reliable and consistent signals. User Manual: Settings, Inputs, and Strat
PW Oscillator
Svyatoslav Kucher
PW Oscillator   - индикатор предназначенный для поиска локальных экстремумов, определения текущей тенденции. В расчетах индикатора используется авторская методика. С помощью индикатора можно определять места возможного разворота цены желательно в направлении тенденции, но также с достаточной точностью и против нее. Также с помощью индикатора можно определять текущую тенденцию. Индикатор подходит для любых валютных пар, но для адекватного отображения показания необходимо, чтобы было достаточно ис
Gioteen Volatility Index (GVI)   - your ultimate solution to overcoming market unpredictability and maximizing trading opportunities. This revolutionary indicator helps you in lowering your losing trades due to choppy market movements. The GVI is designed to measure market volatility, providing you with valuable insights to identify the most favorable trading prospects. Its intuitive interface consists of a dynamic red line representing the volatility index, accompanied by blue line that indicat
Los compradores de este producto también adquieren
Gann Made Easy
Oleg Rodin
4.84 (58)
Gann Made Easy es un sistema de comercio de Forex profesional y fácil de usar que se basa en los mejores principios de comercio utilizando la teoría del Sr. W. D. Gann. El indicador proporciona señales precisas de COMPRA y VENTA, incluidos los niveles de Stop Loss y Take Profit. Puede comerciar incluso sobre la marcha utilizando notificaciones PUSH. ¡Por favor, póngase en contacto conmigo después de la compra! ¡Compartiré mis consejos comerciales con usted y excelentes indicadores de bonificació
Atomic Analyst
Issam Kassas
5 (2)
En primer lugar, vale la pena enfatizar que este Indicador de Trading no repinta, no redibuja y no se retrasa, lo que lo hace ideal tanto para el trading manual como para el automatizado. Manual del usuario: configuraciones, entradas y estrategia. El Analista Atómico es un Indicador de Acción del Precio PA que utiliza la fuerza y el impulso del precio para encontrar una mejor ventaja en el mercado. Equipado con filtros avanzados que ayudan a eliminar ruidos y señales falsas, y aumentan el poten
Trend Punch
Mohamed Hassan
5 (13)
This indicator is unstoppable when combined with our other indicator called  Support & Resistance . After purchase, send us a message and you will get it   for  FREE as a BONUS! Introducing Trend Punch , the revolutionary forex trend indicator that will transform the way you trade! Trend Punch is uniquely designed to provide precise buy and sell arrows during strong market trends, making your trading decisions clearer and more confident. Whether you're trading major currency pairs or exotic sym
Gold Stuff
Vasiliy Strukov
4.89 (202)
Gold Stuff: un indicador de tendencia diseñado específicamente para el oro, también se puede usar en cualquier instrumento financiero. El indicador no se vuelve a dibujar ni se retrasa. El marco de tiempo recomendado es H1. Este indicador está escrito por EA Gold Stuff Advisor, puede encontrarlo en mi perfil.  Puede obtener una copia gratuita de nuestro indicador Strong Support y Trend Scanner, por favor envíe un mensaje privado. ¡a mí! IMPORTANTE! Póngase en contacto conmigo inmediatamente d
FX Power MT4 NG
Daniel Stein
5 (12)
Obtenga su actualización diaria del mercado con detalles y capturas de pantalla a través de nuestro Morning Briefing aquí en mql5 y en Telegram ! FX Power MT4 NG es la nueva generación de nuestro popular medidor de fuerza de divisas, FX Power. ¿Y qué ofrece este medidor de fuerza de nueva generación? Todo lo que le encantaba del FX Power original PLUS Análisis de fuerza de ORO/XAU Resultados de cálculo aún más precisos Períodos de análisis configurables individualmente Límite de cálculo persona
TPSproTREND PrO
Roman Podpora
4.78 (18)
TPSpro TREND PRO   es un indicador de tendencia que analiza automáticamente el mercado y proporciona información sobre la tendencia y cada uno de sus cambios, además de dar señales para ingresar operaciones sin volver a dibujar. El indicador utiliza cada vela, analizándolas por separado. refiriéndose a diferentes impulsos: impulso hacia arriba o hacia abajo. ¡Puntos de entrada exactos a transacciones de divisas, criptomonedas, metales, acciones e índices! Versión MT5                   DESCRIPCI
Scalper Inside PRO
Alexey Minkov
4.69 (49)
An exclusive indicator that utilizes an innovative algorithm to swiftly and accurately determine the market trend. The indicator automatically calculates opening, closing, and profit levels, providing detailed trading statistics. With these features, you can choose the most appropriate trading instrument for the current market conditions. Additionally, you can easily integrate your own arrow indicators into Scalper Inside Pro to quickly evaluate their statistics and profitability. Scalper Inside
TPSpro RFI Levels
Roman Podpora
4.8 (20)
反转第一脉冲水平 (RFI)     指示     俄羅斯     -        ESP   Recomendamos utilizar con   el indicador -   TPSpro 趋势专业版 -   MT5版本 Un elemento clave importante en el comercio son las zonas o niveles a partir de los cuales se toman decisiones para comprar o vender un instrumento comercial. A pesar de los intentos de los grandes actores de ocultar su presencia en el mercado, inevitablemente dejan rastros. Nuestra tarea era aprender a encontrar estos rastros e interpretarlos correctamente. Funciones principales:
Trend Pulse
Mohamed Hassan
5 (2)
Please contact me after purchase to immediately get your PDF strategy + documentation for Trend Pulse !  Official release price of $89  (1 /50 copies left). Next price is $199 . Introducing Trend Pulse , a unique and robust indicator capable of detecting bullish, bearish, and even ranging trends! Trend Pulse uses a special algorithm to filter out market noise with real precision. If the current symbol is moving sideways, Trend Pulse will send you a ranging signal, letting you know that it'
Currency Strength Wizard es un indicador muy poderoso que le proporciona una solución todo en uno para operar con éxito. El indicador calcula el poder de este o aquel par de divisas utilizando los datos de todas las monedas en múltiples marcos de tiempo. Estos datos se representan en forma de índice de moneda fácil de usar y líneas eléctricas de moneda que puede usar para ver el poder de esta o aquella moneda. Todo lo que necesita es adjuntar el indicador al gráfico que desea operar y el indicad
Ante todo, vale la pena enfatizar que esta Herramienta de Trading es un Indicador No Repintado, No Redibujado y No Retrasado, lo que la hace ideal para el trading profesional. Curso en línea, manual del usuario y demostración. El Indicador de Conceptos de Acción del Precio Inteligente es una herramienta muy potente tanto para traders nuevos como experimentados. Combina más de 20 indicadores útiles en uno solo, combinando ideas avanzadas de trading como el Análisis del Trader del Círculo Interio
ACTUALMENTE 26% DE DESCUENTO ¡La mejor solución para cualquier operador novato o experto! Este indicador es una herramienta única, de alta calidad y asequible porque hemos incorporado una serie de características propias y una nueva fórmula. ¡Con sólo UN gráfico puede leer la Fuerza de la Divisa para 28 pares de Divisas! Imagínese cómo mejorará su operativa porque podrá señalar el punto exacto de activación de una nueva tendencia o de una oportunidad de scalping. Manual del usuario: haga
RelicusRoad Pro
Relicus LLC
4.54 (80)
Ahora $ 147 (aumentando a $ 499 después de algunas actualizaciones) - Cuentas ilimitadas (PC o Mac) Manual de usuario de RelicusRoad + Videos de capacitación + Acceso al grupo privado de Discord + Estado VIP UNA NUEVA MANERA DE VER EL MERCADO RelicusRoad es el indicador comercial más poderoso del mundo para divisas, futuros, criptomonedas, acciones e índices, y brinda a los comerciantes toda la información y las herramientas que necesitan para mantenerse rentables. Brindamos análisis téc
ACTUALMENTE 31% DE DESCUENTO Este indicador es una herramienta de transacción única, de alta calidad y asequible porque hemos incorporado una serie de características propias y una fórmula secreta. Con solo un gráfico, da Alertas para los 28 pares de divisas. ¡Imagina cómo mejorarás porque puedes identificar el punto de activación exacto de una nueva tendencia u oportunidad de crecimiento! Basado en nuevos algoritmos subyacentes , hace que sea aún más fácil identificar y confirmar operaciones po
¡Actualmente 20% OFF ! ¡La mejor solución para cualquier novato o trader experto! Este software funciona con 28 pares de divisas. Se basa en 2 de nuestros principales indicadores (Advanced Currency Strength 28 y Advanced Currency Impulse). Proporciona una gran visión general de todo el mercado de divisas. Muestra los valores de Advanced Currency Strength, la velocidad de movimiento de las divisas y las señales para 28 pares de divisas en todos los (9) marcos temporales. Imagine cómo mejorar
Bomb Bank Signal
Igor Pereira Calil
Señal de Bomb Bank: su indicador de confianza en MetaTrader 4 Bomb Bank Signal es un poderoso indicador para MetaTrader 4, diseñado para identificar las tendencias más relevantes en el mercado financiero. Si buscas una herramienta que anticipe los movimientos con precisión, el Bomb Bank es el aliado que necesitas. Cómo funciona: Este indicador combina tres métodos distintos (análisis de volumen, cierre de velas y tendencia simétrica) para detectar y señalar oportunidades de compra y venta
- Real price is 80$ - 40% Discount ( It is 49$ now ) Contact me for instruction, any questions! Related EA Product: Bitcoin Expert Introduction The breakout and retest strategy is traded support and resistance levels. it involves price breaking through a previous level.  The break and retest strategy is designed to help traders do two main things, the first is to avoid false breakouts. Many false breakouts start with a candlestick that breaks out of a level but ends with an immediate candlestic
Trend Screener
STE S.S.COMPANY
4.79 (81)
Indicador de tendencia, solución única e innovadora para el comercio y filtrado de tendencias con todas las funciones de tendencias importantes integradas en una sola herramienta. Es un indicador 100% sin repintar de marcos temporales y monedas múltiples que se puede usar en todos los símbolos/instrumentos: divisas, materias primas, criptomonedas, índices y acciones. Trend Screener es un indicador de seguimiento de tendencia eficiente que proporciona señales de tendencia de flecha con puntos en
Order Block Hunter
Noha Mohamed Fathy Younes Badr
5 (1)
Order block hunter indicator is the best indicator for  hunt the order blocks that area where there has been a large concentration of limit orders waiting to be executed Order blocks are identified on a chart by observing previous price action and looking for areas where the price experienced significant movement or sudden changes in direction .This indicator does that for you by using very complicated codes and helps you to take the best areas To buy and sell because it make marks at the best a
Introduciendo       Indicador Quantum Trend Sniper   , el innovador indicador MQL5 que está transformando la forma en que identificas y negocias los cambios de tendencia. Desarrollado por un equipo de comerciantes experimentados con experiencia comercial de más de 13 años,       Indicador de francotirador de tendencia cuántica       está diseñado para impulsar su viaje comercial a nuevas alturas con su forma innovadora de identificar cambios de tendencia con una precisión extremadamente alta.
You will get Huge Bonus in case of Full Purchase (not for Rent) contact me after purchase, Leave comment or DM me. Backtest and Read Overview Before buying Chart patterns have been a topic of debate among traders; some believe they are reliable signalers, while others do not. Our Chart Patterns All-in-One indicator displays various chart patterns to help you test these theories for yourself. The profitability of these patterns is not a reflection of the indicator's effectiveness but rather an ev
Conviértase en un Breaker Trader y obtenga beneficios de los cambios en la estructura del mercado a medida que se invierte el precio. El indicador de ruptura de bloque de órdenes identifica cuándo una tendencia o movimiento de precio se acerca al agotamiento y está listo para revertirse. Le alerta sobre cambios en la estructura del mercado que generalmente ocurren cuando una reversión o un retroceso importante están a punto de suceder. El indicador utiliza un cálculo patentado que identific
Gold Channel is a volatility-based indicator, developed with a specific timing algorithm for the XAUUSD pair, which consists of finding possible corrections in the market. This indicator shows two outer lines, an inner line (retracement line) and an arrow sign, where the theory of the channel is to help identify overbought and oversold conditions in the market. The market price will generally fall between the boundaries of the channel. If prices touch or move outside the channel it is a tra
Best Currency Strength Indicator
Tumelo Patrick Rakotsoane
4.54 (41)
Advanced Currency Strength Indicator The Advanced Divergence Currency Strength Indicator. Not only it breaks down all 28 forex currency pairs and calculates the strength of individual currencies across all timeframes , but, You'll be analyzing the WHOLE forex market in 1 window (In just 1 minute) . This indicator is very powerful because it reveals the true movements of the market.  It is highly recommended to  analyze charts knowing the performance of individual currencies or the countries ec
¡LEA LA INFORMACIÓN A CONTINUACIÓN ANTES DE COMPRAR EL PRODUCTO! ¡Apollo Pips PLUS SP es un producto único! ¡ES PARA AQUELLOS QUE QUIEREN OBTENER MI NUEVO INDICADOR "APOLLO PIPS" MÁS BONO "SUPER PACK" CON ACCESO A TODOS MIS INDICADORES COMERCIALES! Al comprar el producto Apollo Pips PLUS SP, en realidad está comprando una versión absolutamente nueva de mi indicador Apollo Pips. Esta versión del indicador tiene un algoritmo mejorado y un parámetro fácil de usar que le brinda la oportunidad de uti
M1 Arrow
Oleg Rodin
4.67 (12)
Una estrategia intradía basada en dos principios fundamentales del mercado. El algoritmo se basa en el análisis de volúmenes y ondas de precios utilizando filtros adicionales. El algoritmo inteligente del indicador da una señal solo cuando dos factores de mercado se combinan en uno. El indicador calcula ondas de cierto rango en el gráfico M1 utilizando los datos del marco de tiempo más alto. Y para confirmar la onda, el indicador utiliza el análisis por volumen. Este indicador es un sistema come
IX Power MT4
Daniel Stein
5 (5)
IX Power lleva por fin la insuperable precisión de FX Power a los símbolos que no son de Forex. Determina con exactitud la intensidad de las tendencias a corto, medio y largo plazo de tus índices, acciones, materias primas, ETF e incluso criptodivisas favoritas. Puede analizar todo lo que su terminal le ofrece. Pruébalo y experimenta cómo tu timing mejora significativamente a la hora de operar. Características principales de IX Power Resultados de cálculo 100% precisos y sin repintado -
ICT, SMC, SMART MONEY CONCEPTS, SMART MONEY, Smart Money Concept, Support and Resistance, Trend Analysis, Price Action, Market Structure, Order Blocks, BOS/CHoCH,   Breaker Blocks ,  Momentum Shift,   Supply&Demand Zone/Order Blocks , Strong Imbalance, HH/LL/HL/LH,    Fair Value Gap, FVG,  Premium  &   Discount   Zones, Fibonacci Retracement, OTE, Buy Side Liquidity, Sell Side Liquidity, BSL/SSL Taken, Equal Highs & Lows, MTF Dashboard, Multiple Time Frame, BigBar, HTF OB, HTF Market Structure, 
Scalper Vault
Oleg Rodin
5 (22)
Scalper Vault es un sistema profesional de reventa que le brinda todo lo que necesita para una reventa exitosa. Este indicador es un sistema comercial completo que puede ser utilizado por operadores de divisas y opciones binarias. El marco de tiempo recomendado es M5. El sistema le proporciona señales de flecha precisas en la dirección de la tendencia. También le proporciona señales superiores e inferiores y niveles de mercado de Gann. Los indicadores proporcionan todo tipo de alertas, incluidas
Clear Breakout
Martin Alejandro Bamonte
El indicador "Breakout Buy-Sell" está diseñado para identificar y resaltar posibles oportunidades de compra y venta basadas en rupturas de precios durante diferentes sesiones del mercado (Tokio, Londres y Nueva York). Este indicador ayuda a los traders a visualizar claramente las zonas de compra y venta , así como los niveles de toma de ganancias (TP) y stop loss (SL). Estrategia de Uso El indicador se puede utilizar de la siguiente manera: Configuración Inicial : Selecciona la sesión del merc
Otros productos de este autor
SpectorMA
Sergii Krasnyi
5 (1)
Le presentamos un indicador que no sólo mejora el aspecto visual del gráfico, sino que también le confiere un carácter vivo y dinámico. Nuestro indicador es una combinación de uno o más indicadores de Media Móvil (MA), que cambian constantemente de color, creando un aspecto interesante y colorido. Este producto es una solución gráfica, por lo que es difícil describir lo que hace en texto, es más fácil verlo descargándolo, además el producto es gratuito. Este indicador es adecuado para los blo
FREE
SpreadChartOscillator es un indicador que muestra la línea de propagación del símbolo en la subventana del oscilador. En los parámetros es posible especificar otro símbolo a partir del cual se emitirá la línea de spread. Si el parámetro "Símbolo" se deja vacío, la línea de spread se mostrará desde el símbolo actual en el que está fijado el indicador. Esta herramienta es ideal para los operadores que desean ver la dinámica del spread en el formato del oscilador y utilizarla para protegerse de en
FREE
TickChartOscillator es un indicador que muestra un gráfico de ticks de un símbolo en la subventana del oscilador. Ofrece una configuración flexible para su personalización: - La posibilidad de desactivar la visualización de la línea de precios en el oscilador. - La posibilidad de especificar un símbolo diferente del que emitir el gráfico de ticks. Si el parámetro "Símbolo" se deja vacío, el gráfico de tick se mostrará para el símbolo actual en el que está fijado el indicador. Esta her
FREE
ZoomChart2
Sergii Krasnyi
El indicador ZoomChart funciona con dos gráficos: el gráfico actual en el que se ejecuta y el siguiente. El indicador traslada el segundo gráfico al momento en que se encuentra el primero. De este modo, el segundo gráfico muestra la misma situación en el primer gráfico (en el que se ejecuta el indicador), pero en un marco temporal diferente. En otras palabras, este indicador sirve de lupa o, por el contrario, reduce el gráfico para mostrar la situación en un marco temporal mayor. El indicador
FREE
ChartOverlay indicator has two main functions 1. mirroring - i.e. for example, it will make USDEUR from EURUSD 2. displaying the price chart of the selected financial instrument (with selected period)  in the subwindow of the main chart. This tool allows traders to easily analyze the relationship between different currency pairs and assets, offering unique customization and visualization features. Key Features: Price Chart Display: The indicator displays the price chart of the selected instrum
FREE
ZoomChart
Sergii Krasnyi
The ZoomChart indicator displays data from other timeframes on the current chart in the subwindow, acting as a magnifying glass or, conversely, shrinking the chart to display larger timeframes. The ZoomChar indicator automatically tracks the current outermost bar on the chart and moves with the chart as it shifts. The indicator can display data from another financial instrument, not limited to the main chart instrument. The robot carries the function of “mirroring” - The ability to conver
FREE
Filtro:
Coreentrades
172
Coreentrades 2024.06.03 09:01 
 

Great support

Sergii Krasnyi
1361
Respuesta del desarrollador Sergii Krasnyi 2024.06.26 11:05
Thank you for the review. It's my pleasure.
Respuesta al comentario
Versión 1.40 2024.03.25
The names of the parameters are written in more detail
Versión 1.30 2024.03.25
added parameter - maximum and minimum RGB value
Versión 1.20 2024.03.03
desired program version
Versión 1.10 2024.03.03
on/off parameter - translated into English
Versión 1.1 2024.03.03
Se ha añadido el parámetro "Tasa de cambio de color", que tiene tres opciones: "lenta", "media" y "rápida".