• Información general
  • Comentarios
  • Discusión

Sunrise SMT Divergence MT5

Make no mistake, this is not just another indicator; it's much more than that!

Welcome to a groundbreaking approach! Sunrise Divergence is not just another tool; it represents a deep understanding in how market dynamics are analyzed and traded. This indicator is crafted for traders who seek to navigate the markets with precision, leveraging the powerful concept of asset correlation, both positive and negative, to unveil trading opportunities that many overlook.

In the markets, understanding the intricate relation between correlated assets can be the key to unlocking significant advantages. Whether these correlations are positive, where assets move in tandem, or negative, where they move in opposite directions, the ability to identify and exploit these relationships is what sets Sunrise Divergence apart. It's about making informed decisions based on the synchronous movements of assets, tapping into a deeper layer of market insight that goes beyond the surface fluctuations.


Why Focus on Correlation?

The rationale behind focusing on highly correlated assets, either positively or negatively, is rooted in the concept of market efficiency. Correlated assets often share common drivers, whether they be economic indicators, geopolitical events, or sector-specific news. By analyzing these relationships, traders can anticipate movements in one asset based on the movements of another, thereby gaining an edge in their trading strategy.


Sunrise Divergence elevates this concept by providing a sophisticated yet user-friendly tool that identifies these correlations in real-time. This approach is particularly powerful because it allows traders to:

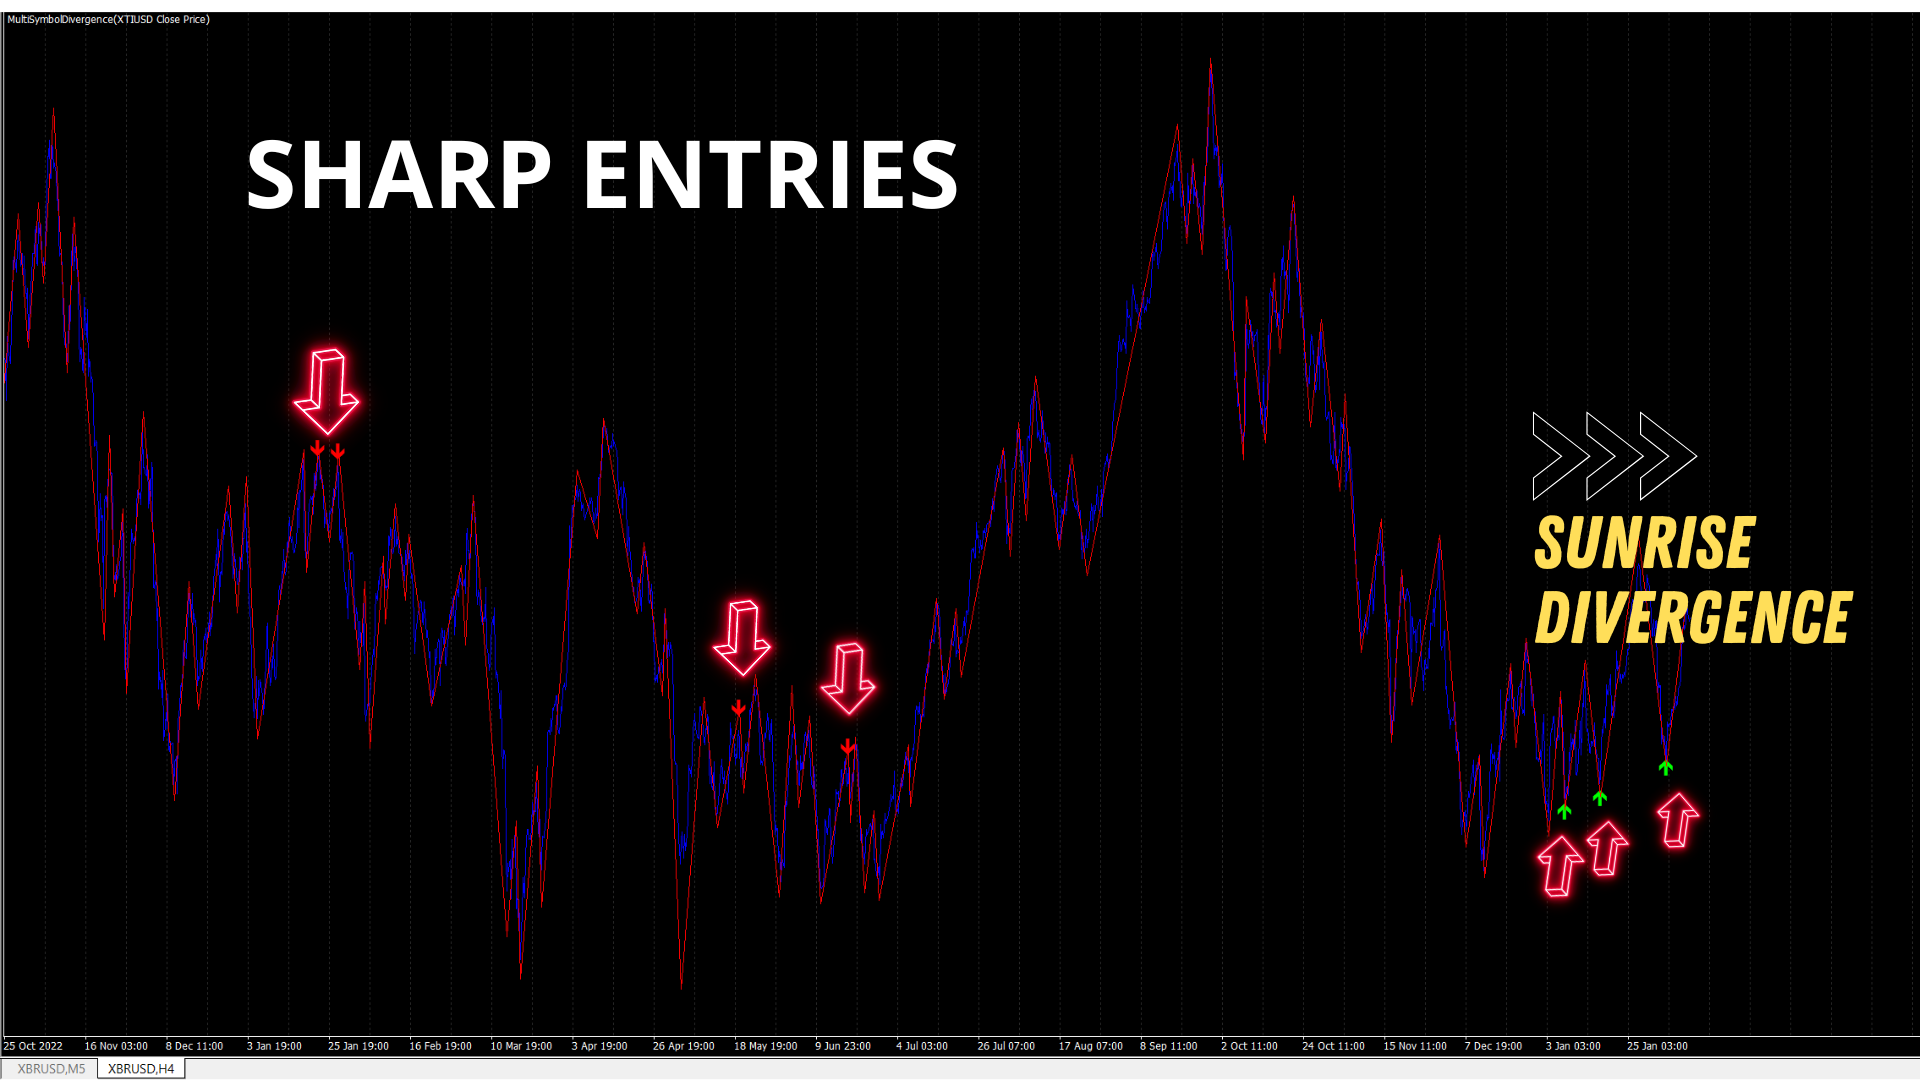
  • Spot Divergence Early: Identify when two correlated assets begin to diverge, signaling potential reversal or continuation opportunities.
  • Hedge Effectively: Use the knowledge of negative correlations to hedge positions, reducing risk without sacrificing potential returns.
  • Capitalize on Market Dynamics: Positive correlations can indicate broader market movements, enabling traders to ride the wave of momentum with confidence.


Unique Features of Sunrise Divergence

Sunrise Divergence stands out by offering features that are meticulously designed to enhance your trading experience:

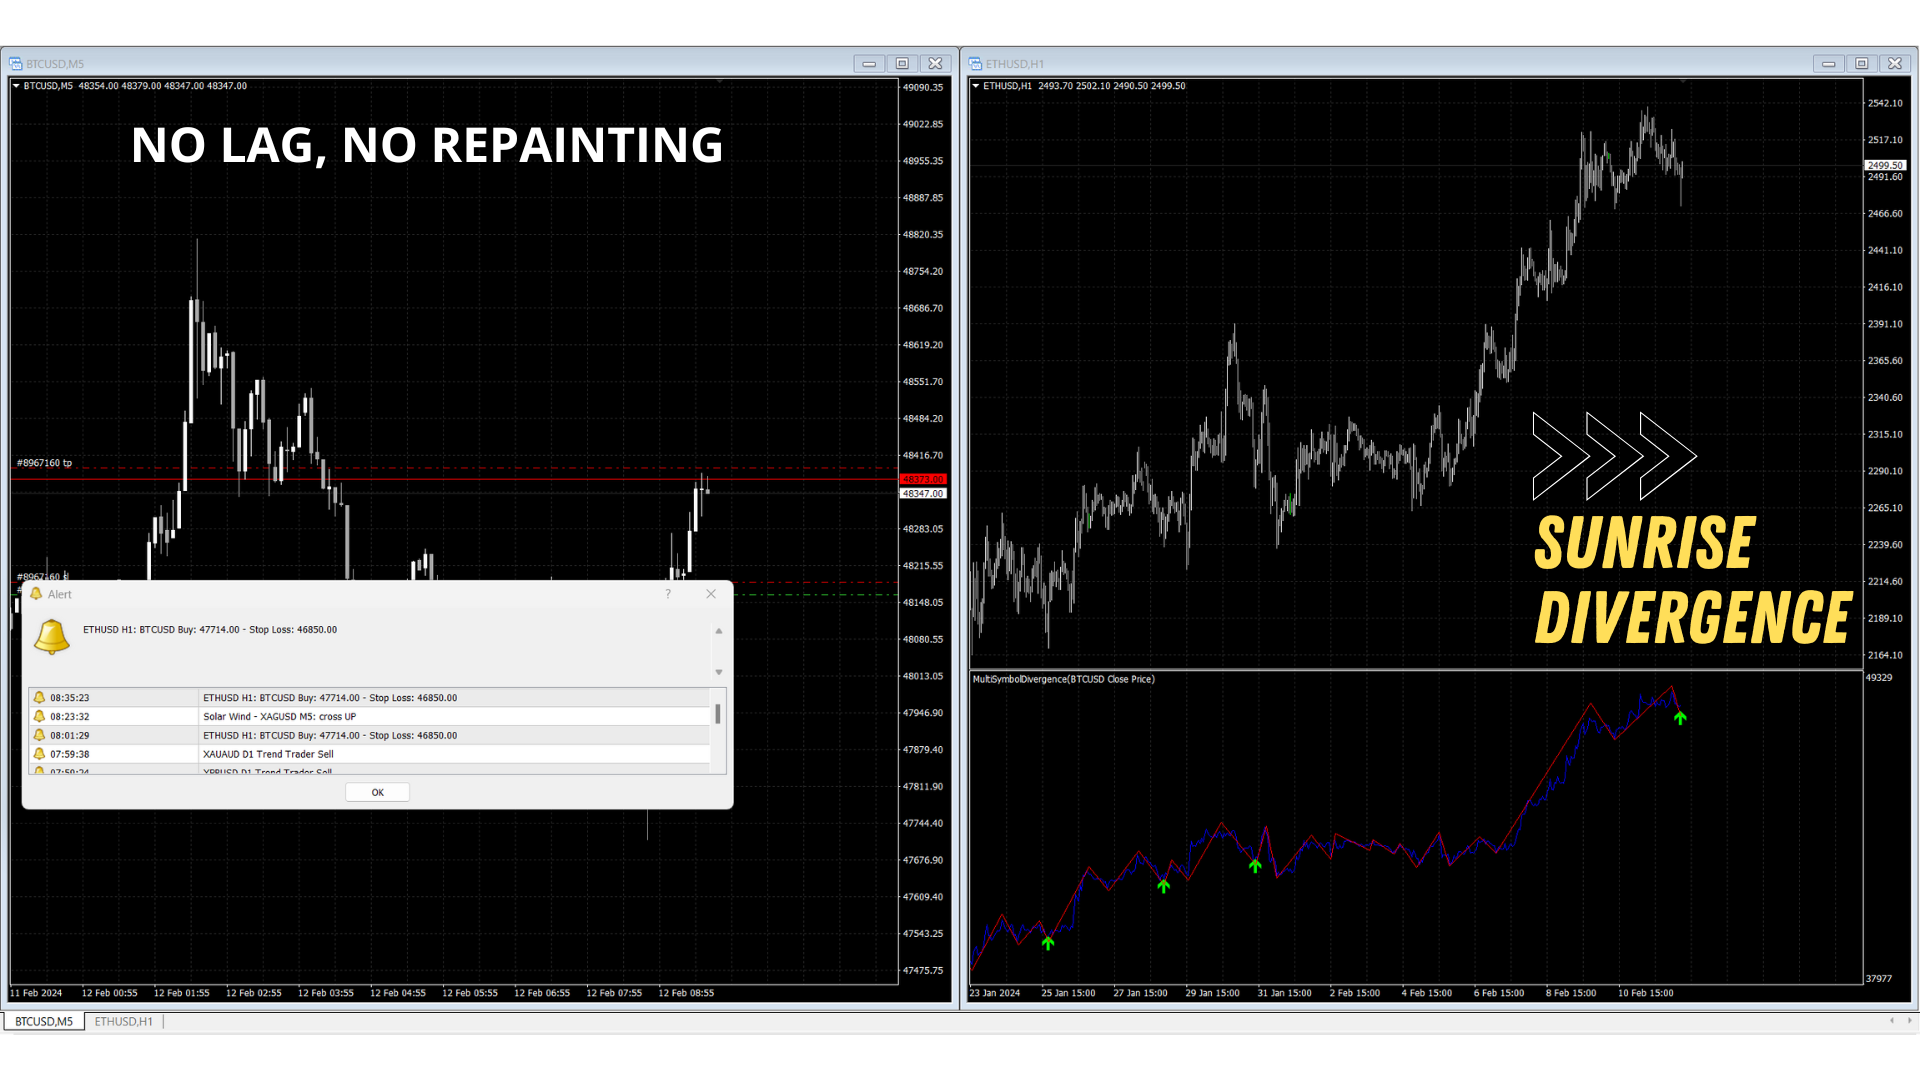
  • No Lag, No Recalculation: Alerts generated by Sunrise Divergence are definitive. Once an alert is triggered, it remains on the chart, providing clear, actionable signals without the ambiguity of repainting or recalculating.
  • Backtest Capability on Dual Assets: A standout feature is the ability to backtest strategies on two currencies simultaneously on MT4. This direct testing capability simplifies the analysis across different pairs, stocks, indices, and more, making strategy development process both efficient and effective.
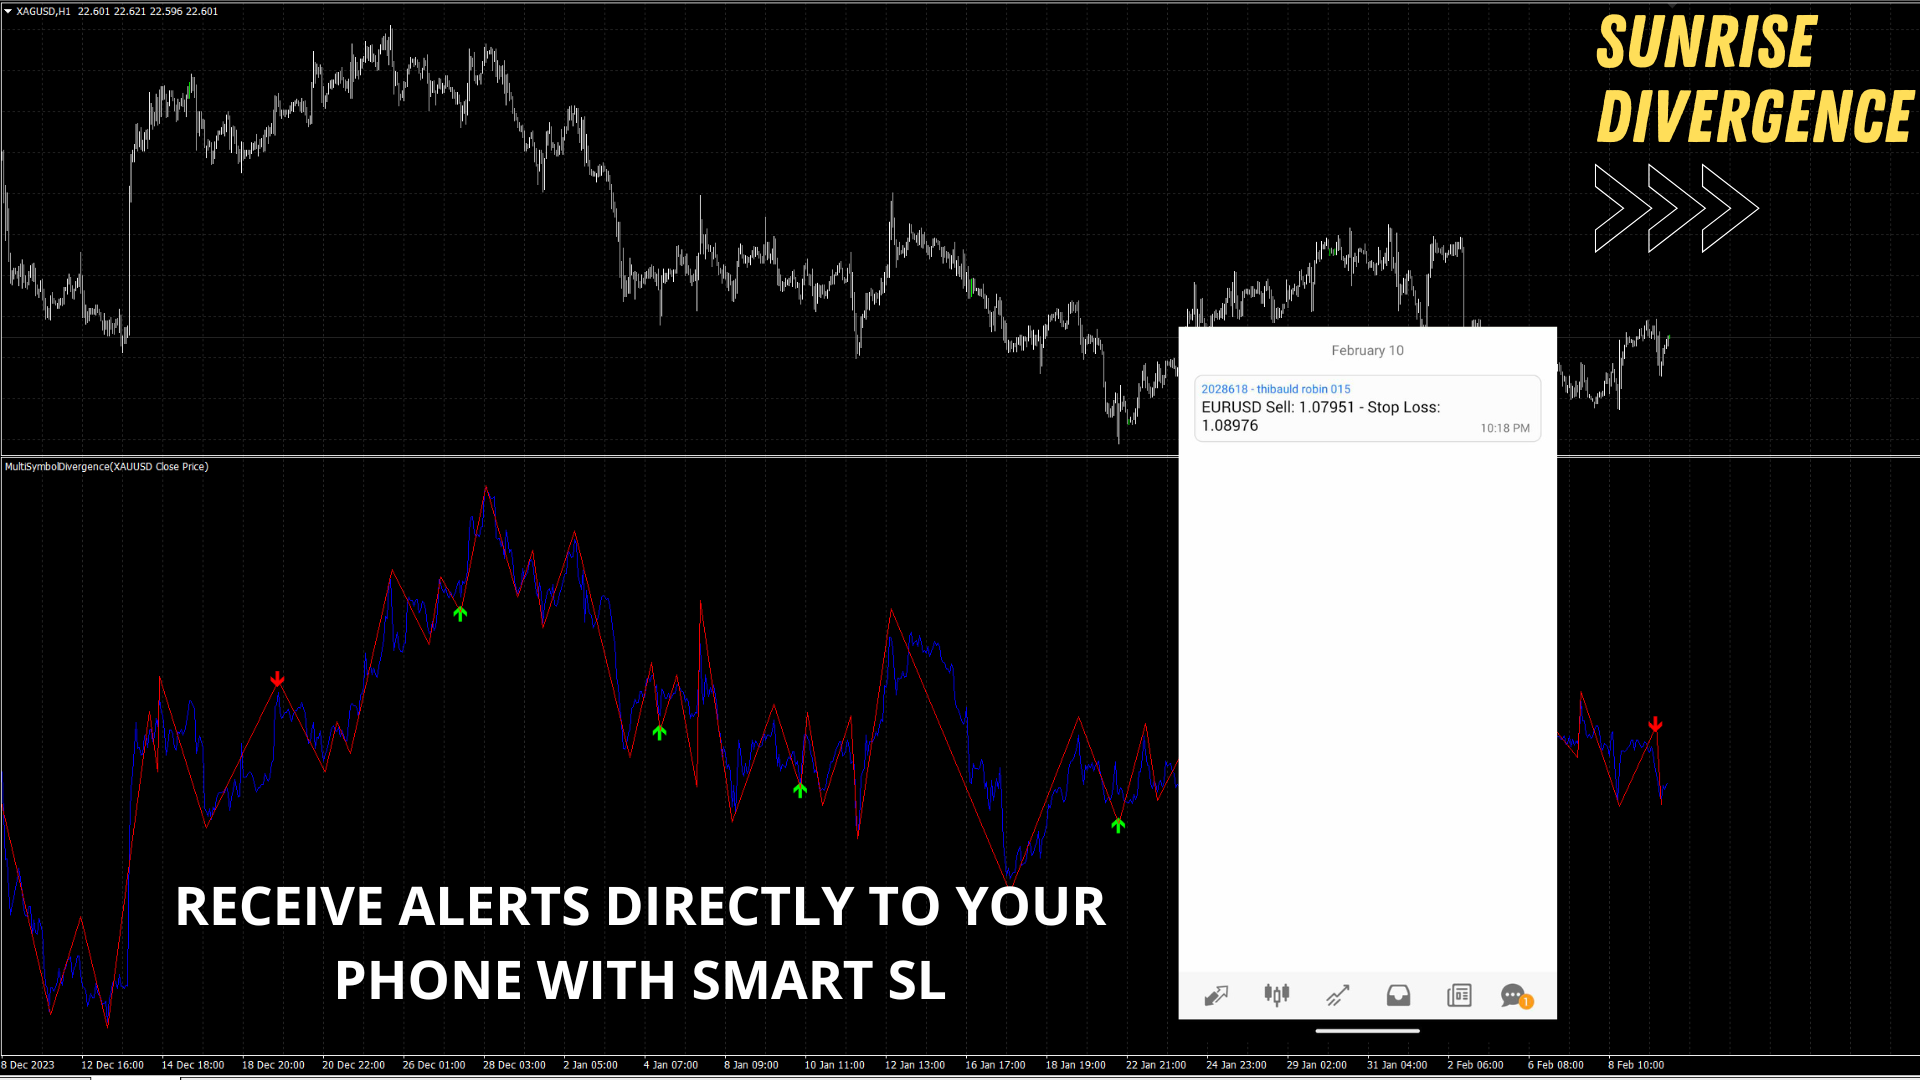
  • Smart Stop Loss Alerts: Protect your trades with intelligently calculated stop loss alerts, adding an extra layer of security to trading decisions.
  • Strong False Signals Filter: Prioritizing quality over quantity, it avoids inundating users with signals for every minor divergence. Instead, it concentrates on signals that truly matter..


Settings

Sunrise Divergence is designed with flexibility in mind, allowing traders to tailor the settings to their specific needs:

  • SecondSymbol Input: Alerts are received only for this second symbol, not the symbol in the main chart. This approach is crucial for backtesting the indicator. For example, when trading EURUSD vs GBPUSD, two charts are opened. On the EURUSD chart, alerts for GBPUSD are received, since it is designated as the SecondSymbol and vice versa.
  • Inverse Option: Adjust analysis for inversely correlated assets, enhancing strategies that involve trading pairs with opposite movements.


Leveraging Correlation in Trading

By employing Sunrise Divergence, traders can open separate charts for each asset of interest, using the SecondSymbol setting to monitor correlated assets efficiently. This method ensures a streamlined approach to spotting trading opportunities, whether you're analyzing direct correlations like EURUSD and GBPUSD, or any USD-X pairs, or at the opposite, exploring inverse relationships such as EURUSD and USDCHF, or any X-USD pair against the Dollar Index.


    IMPORTANT:

    Divergence trading requires an understanding of market dynamics, structures, and asset correlation. It's a strategy that looks into how markets relate and move, which can be complex for beginners. A basic knowledge of how assets interact is crucial to use divergences effectively.

    For newcomers or those with little experience, starting with simpler strategies is advisable. A beginner-friendly and more affordable one that lays a good foundation in trading can be found here: https://www.mql5.com/en/market/product/112683. This approach allows for a gradual build-up of trading skills and market understanding.

    Please note that the Sunrise SMT Divergence version for MT5 cannot be backtested. For backtesting capabilities, kindly visit the following link to access and download the MT4 version : https://www.mql5.com/en/market/product/112795.


    Non exhaustive list of positively correlated assets (normal settings):

    • EURUSD vs GBPUSD
    • AUDUSD vs NZDUSD
    • Gold vs Silver
    • Dow Jones vs S&P, Nasdaq, Dax
    • Crude vs Brent
    • USD-X Pair vs Dollar Index 
    • Tech Stocks vs Nasdaq
    • Google vs Facebook
    • BTC vs ETH

    Non exhaustive list of negatively correlated assets (inverse = True):

    • EURUSD vs USDCHF
    • X-USD Pair vs Dollar Index
    • Gold, Silver vs Dollar Index
    • High-Yield Bonds vs US Treasury Bonds


    FAQ

    Q: Are updates and technical support available for the SD Indicator?

    A: Updates will be periodically released to improve functionality and adapt to market changes. I'll very soon release a complete Guide on how to use it, so do not hesitate to reach out and will share it as soon as it's ready.


    Q: What kind of after-sale support is available for the SD Indicator?  

    A: After-sale support is limited to errors and bugs, a Telegram group link is provided in my profile description for community support and discussion (for both UTT and SD). 


    Q: Can the activation limit be extended beyond 20 local machines?

    A: Due to MQL5's policy, the activation limit for the SD Indicator is capped at 20 local machines, this limit cannot be extended. Additionally, no files will be shared to bypass this restriction.


    Q: How can I try out the SD Indicator before deciding to purchase?

    A: For those interested in evaluating the SD Indicator's performance, please use the backtesting features on MT4 to get an overview before taking any decisions.


    Q: Can I request a refund for the SD Trader Indicator if it does not meet my expectations?

    A: Due to MQL5's strict no-refund policy after installation, I strongly advise against purchasing if there is any doubt regarding the product's suitability for your trading needs. Additionally, this indicator is not advised for beginners.


    Productos recomendados
    A useful and convenient tool for traders when analyzing and making decisions. Peculiarity The main feature of this indicator is its fast algorithm . The gain in the speed of calculating the polynomial and its value of the standard deviation in comparison with classical algorithms reaches several thousand times. Also, this indicator includes a Strategy Tester with a clear visualization of transactions, an equity chart and simultaneous calculation and display of the following data in the form o
    AIS MT5 INDICATOR 5 ALL INCLLUSIVE SET GUIDE CHAPTER 1  IMPORTANT INFORMATION <1> THIS INDICATOR IS ONE OF THE SERIES OF NEW AIS INDICATORS AIS MT5 INDICATOR 1 =ADVANCED CLASSIC= AIS MT5 INDICATOR 2 =MULTIFRAMES= AIS MT5 INDICATOR 3 =LINES= AIS MT5 INDICATOR 4 =MARKET PROFILES= AIS MT5 INDICATOR 5 =ALL INCLUSIVE SET CHAPTER 2 GENERAL FEATURES OF THE SERIES <1> AIS MT5 INDICATOR 1 =ADVANCED CLASSIC= < DEVELOPMENT PAUSED >     DISPLAYS MAIN TIME POINTS AND PRICE LEVELS OF THE CHART     
    Trend Arrow Super The indicator does not redraw and does not change its data. Professional but very easy to use Forex system. The indicator gives accurate BUY\SELL signals. Trend Arrow Super is very easy to use, you just need to attach it to the chart and follow simple trading recommendations. Buy signal: Arrow + histogram in green color, enter immediately on the market to buy. Sell signal: Arrow + Histogram in red color, enter immediately on the market to sell.
    The volatility scanner indicator is a tool that helps traders identify and analyze  volatility in all the market timeframes for the current chart. This way you can find potentially profitable trades on every timeframe for the current symbol. What It Does? Scan all timeframes to find a volatility contraction. Color the button yellow if there is a volatility squeeze at that timeframe. Clicking on the button instantly changes timeframe. How To Use It? Just put it on the chart and click on the y
    Deriv Boom sell
    Yaovi Inoussa Atchou
    Our BOOM SELL ALERT indicator is specifically engineered to   take candles on BOOM 1000 , BOOM 500 is tool is optimized for M1 (1-minute) timeframe, ensuring you receive timely and actionable insights.   The indicator is a combination of   many indicators. -        AO Oscillator -        Stochastic   HOW TO USE THIS INDICATOR To use well this indicator , it   need to use SCHAFF TREND RSX ( 5 MIN OR M5) IF SCHAFF trend RSX is GREEN and you have a signal then SELL when you have ENTRY and out with
    Fibrillar
    Vitalii Zakharuk
    It is very easy to use the Fibrillar indicator, since the simplest is to look at the chart and act according to the indications of the colored arrows. The algorithm takes into account the measurement of prices, and this method also focuses on measuring each of the price drops (H / C, H / O, LC, LO) - which gives more detailed information, but also more averaged. When calculating this indicator, logarithmic gains are first calculated at the closing price, which allows you to filter out the tre
    Multiple Timeframe MACD indicator. This indicator was built for making multiple timeframe analysis possible in MT5 using MACD Indicator. MACD Indicator traditionally shows two lines and one histogram. MACD Line(Yellow) is calculated by subtracting 12period EMA(fast) from 26period EMA (slow). Signal Line(Blue) is created by a 9period EMA from MACD Line. Histogram is just the difference between MACD and Signal lines. Histogram is colored based on the difference between its value and the previous h
    Macd's main chart indicator 1. You can determine the price at which the MACD will change from buy to sell, and vice versa. It is the cousin of the oscillator predictor. If you know a position at the time, then the exact price, current and next (future) columns will need to reach the MACD crossover. You can also see how far the market has to go before your current position is helped or blocked by the next MACD crossover force. You can do this in all time frames because the predictor is updated
    Super Zone   For several years of observing the principles of the market, Super Zone worked, both then and now, because the indicator  allows you to see the trading range of the  week and even the month that major market participants use. It’s very easy to use, we work on H4 in the weekly range (  in the tester it doesn’t work in the demo mode  ) - we sell from the upper zones, we buy from the lower ones. It marks the zones from the beginning of the week (month) that are  not redrawn  , works on
    Hello There, Today I want to show you my new researchable fore BUY SELL indicator, Golden Scalp System v2 it work all asset, it work all time frame, but i recommend start 5 minute to H1 when you receive a signal just take trade and stay wait for your take profit asset All Major Pair And minor IT WORK ALSO XAUUSD Fantastic results,  for more info,,, message us thank you 
    Skiey
    Vitalii Zakharuk
    Skiey - Indicator of easy solutions! Using this indicator is very simple, since the simplest is to look at the chart and act according to the color arrows. Such a calculation option takes into account intraday price fluctuations and focuses on measuring the "candlestick" share in the trend. The algorithm takes into account the measurement of prices, this method also emphasizes the measurement of each of the price drops (H / C, H / O, LC, LO) - which gives more detailed information but also mo
    Description ABC Trend Levels Pro  is an indicator that identifies market trends and important trend support and resistance levels. Recommendations You can use this indicator to determine the trend and, accordingly, to determine the direction of opening a position or closing an opposite position. Parameters ===== _INDICATOR_SETTINGS_ =====  - indicator settings Maximum History Bars  - maximum number of history bars for calculating the indicator. Average True Range Period  - ATR indicat
    ATR Line
    Evgeny Levchenko
    El indicador - "Línea ATR" determina la tendencia actual y da señales para comprar (flecha verde hacia arriba) o vender (flecha roja hacia abajo). El cálculo del indicador se basa en la desviación del precio promedio del instrumento de su rango real promedio: ATR. La media móvil de precios se utiliza para reducir el "ruido del mercado". Si la línea principal del indicador - "Línea ATR" es más baja en el gráfico de precios del instrumento, entonces el mercado está en una tendencia "alcista". Si l
    This indicator has a unique support and resistance calculation program, which is a unique trading system. Index characteristics Imagine if you can accurately determine the important trading support and resistance areas and points in advance, how will your trading improve? Based on a unique calculation method, the indicator analyzes the trend, analyzes the current support and resistance, and obtains the current important support resistance and single direction, the calculated stop profit and st
    John Bollinger's normalized MFI (Fund Flow Index). Bollinger bands are used to calculate overbought/oversold areas. It takes three input parameters: MFI period - MFI calculation period MFI Applied Volume - Calculates the volume of MFI transactions BB period - Calculation period of the Bollinger band BB deviation - Brin deviation Calculation: NormMFI = (MFI-BL) / (TL-BL) Among them: TL = BBands(MFI, BB period, BB deviation, UPPER_BAND) BL = BBands(MFI, BB period, BB deviation, LOWER_BAND) MFI - M
    The Antique Trend Indicator is a revolutionary trend trading and filtering solution with all the important features of a trend tool built into one tool! The Antique Trend indicator is good for any trader, suitable for any trader both for Forex and binary options. There is no need to configure anything, everything has been perfected by time and experience, it works great during flats and trends. The Antique Trend indicator is a tool for technical analysis of financial markets, reflecting curre
    Unlock the Power of Scalping with this Essential Indicator for Any Currency Pair! Experience Crystal-Clear Buy/Sell Signals and Activate Instant Alerts for Maximum Precision. Introducing the Ultimate Scalping Companion: Your Key to Precision Profits!  Transform Your Trading Strategy with an Indicator that Stands the Test of Time! In the ever-evolving world of trading, consistent success hinges on smart risk management . While no tool can be the holy grail, our non-repainting indicator is a
    A lot of professional traders use high quality divergence signals as a part of their strategy to enter a position. Spotting correct divergences quickly can often be hard, especially if your eye isn’t trained for it yet. For this reason we’ve created a series of easy to use professional oscillator divergence indicators that are very customisable so you get only the signals you want to trade. We have this divergence indicator for RSI, MACD, Stochastics, CCI and OBV. RSI:   https://www.mql5.com/en/
    Introducing the Triple EMA Trend Following + Signals Indicator – the perfect tool for traders seeking precise trend identification and actionable buy/sell signals! Key Features: Triple EMA Trend Analysis : This indicator uses two Triple Exponential Moving Averages (TEMA1 and TEMA2) to capture short-term and long-term trends effectively. TEMA1 reacts to rapid price changes, while TEMA2 filters out market noise, helping you stay on the right side of the trend. RSI and ATR Filters : It incorporates
    This indicator builds upon the previously posted Nadaraya-Watson smoothers. Here we have created an envelope indicator based on Kernel Smoothing with integrated alerts from crosses between the price and envelope extremities. Unlike the Nadaraya-Watson estimator, this indicator follows a contrarian methodology. Please note that by default this indicator can be subject to repainting. Users can use a non-repainting smoothing method available from the settings. The triangle labels are designed
    ScalperMultiMT5
    Andrey Spiridonov
    ScalperMultiMT5 is a multicurrency indicator for professional traders. The indicator shows the complete market situation for the trader. The main advantage of this indicator is that it simultaneously analyzes six major currency pairs on all timeframes from M1 to MN. The indicator analyzes the trend strength. The indicator generates color-coded signals to visualize the market situation: Green - ascending trend. Red - descending trend. Yellow - trend is not defined. The indicator is excellent for
    Buy CTS scalping indicator, provide buying and selling signals, automatic channeling and sending signals to mobile phones Using technical analysis and price action methods and modern methods, CTS indicator can draw price channels and recognize price trends with high accuracy and issue entry and exit signals according to them. Traders can easily fluctuate using this indicator in different time frames and in different markets. With the CTS indicator, you can signal in different ways. This indicat
    Detector Fix
    Vitalii Zakharuk
    Detector Fix indicator. Currency pairs never rise or fall in a straight line. Their ups and downs are interspersed with rollbacks and reversals. Every rise and fall is reflected in your emotional state: hope is replaced by fear, and when it passes, hope appears again. The market uses your fear to prevent you from taking advantage of a strong position. At such moments you are most vulnerable. Everything will change if you use the Detector Fix indicator. The Detector indicator was created t
    TriggerArrow MT5
    Christopher Cyril Abu Aita
    It's a DYNAMIC PERIOD indicator which identifies best ENTRY PRICE in the direction of main trend. It's completely non-repaint indicator and very simple to use. Each arrow has a specific impact value from 1 to 10. Basically there is no important difference between impact numbers. The main point is: A higher impact value means that signal is generated from a bigger swing. When it draws a Buy arrow on a bottom, It means that we had a Trend, A correction, And now this bottom is a reliable trigger 
    Gioteen Volatility Index (GVI) - your ultimate solution to overcoming market unpredictability and maximizing trading opportunities. This revolutionary indicator helps you in lowering your losing trades due to choppy market movements. The GVI is designed to measure market volatility, providing you with valuable insights to identify the most favorable trading prospects. Its intuitive interface consists of a dynamic red line representing the volatility index, accompanied by blue line that indicate
    The multi-currency indicator Currency Strength Index Plus can be set on the chart of any of the 28 currency pairs formed by 8 currencies (USD, EUR, GBP, AUD, NZD, CAD, CHF and JPY), for example, on EURUSD, H1. The indicator is designed to determine the direction of strength of each of the 8 currencies relative to each other. Using the strength and its direction of two opposing currencies, it is possible to make a currency pair with the best trading potential. Currency indices have flexible smoot
    Dragon Machine
    Ignacio Agustin Mene Franco
    Pack Dragon . Indicador 3/3 Dragon machine , cuenta con la estrategia perfeccionada de soporte y resistencia ,  indica los pisos y techos a simple vista se ve ,  dando señal a cada circulo pink dando entrada ala alza  y el circulo verde da entrada ala baja , donde ayuda los apoyos de las lineas verdes y rojos .  Funciona para indices sinteticos y forex  todo los pares , ideal para operar crash y boom . ! 
    - This is an implementation of OCC ==> open close cross - This indicator applies twelve different averaging methods to open and close prices separately to signal the trend switching. - All MA methods are set as input as well as period and different offsets applied to linear regression and ALMA averaging. - Buffers 16 and 17 can be used in EAs to detect trend direction. - You can message in private chat for further changes you need.
    Consecutive candles can give us an indication as to the strength of a trend. With this indicator, you can set the number of consecutive bull or bear candles you wish to be present before achieving a valid signal of RSI crossing into overbought or oversold. With this information, you can better judge if a continuation or reversal situation is about to present. RSI has two settable levels Interesting settings: Number of consecutive candles needed before a valid signal Overbought level of RSI Ove
    FREE
    Elder MACD XOver
    Financial Trading Seminars Inc.
    The MACD XOver indicator was developed by John Bruns to predict the price point at which MACD Histogram will reverse the direction of its slope. The indicator is plotted one day ahead into the future, allowing, if your strategy depends on MACD Histogram, to predict its reversal point for tomorrow (or the next bar in any timeframe). If the closing price tomorrow is above the value of this indicator, then MACD Histogram will tick up. If the closing price tomorrow is below the value of this indica
    Los compradores de este producto también adquieren
    TPSpro RFI Levels MT5
    Roman Podpora
    4.75 (12)
    INSTRUCCIONES       RUSO   -   ING        Se   recomienda utilizar con un indicador.       -       TPSpro   TENDENCIA PRO -   Versión MT5 Un elemento clave en el trading son las zonas o niveles desde los que se toman las decisiones de compra o venta de un instrumento de trading. A pesar de los intentos de los principales actores de ocultar su presencia en el mercado, inevitablemente dejan rastros. Nuestra tarea era aprender a identificar estos rastros e interpretarlos correctamente. Funciones p
    TPSproTREND PrO MT5
    Roman Podpora
    4.89 (9)
    TPSpro TREND PRO  - is a trend indicator that automatically analyzes the market and provides information about the trend and each of its changes, as well as giving signals for entering trades without redrawing! The indicator uses each candle, analyzing them separately. referring to different impulses - up or down impulse. Exact entry points into transactions for currencies, crypto, metals, stocks, indices!  Version MT4               DETAILED DESCRIPTION               R ecommended to use with an
    FX Volume MT5
    Daniel Stein
    4.93 (14)
    Obtenga su actualización diaria del mercado con detalles y capturas de pantalla a través de nuestro Morning Briefing aquí en mql5 y en Telegram ! FX Volume es el PRIMER y ÚNICO indicador de volumen que proporciona una visión REAL del sentimiento del mercado desde el punto de vista de un bróker. Proporciona una visión impresionante de cómo los participantes institucionales del mercado, como los brokers, están posicionados en el mercado Forex, mucho más rápido que los informes COT. Ver esta info
    Introduciendo       Quantum Breakout PRO   , el innovador indicador MQL5 que está transformando la forma en que comercia con Breakout Zones. Desarrollado por un equipo de comerciantes experimentados con experiencia comercial de más de 13 años,       Desglose cuántico PRO       está diseñado para impulsar su viaje comercial a nuevas alturas con su innovadora y dinámica estrategia de zona de ruptura. El indicador de ruptura cuántica le dará flechas de señal en las zonas de ruptura con 5 zonas
    Este es un genial indicador para MT5 que ofrece señales precisas para entrar en una transacción sin redibujar. Se puede aplicar a cualquier activo financiero: fórex, criptomonedas, metales, acciones, índices. Nos dará valoraciones bastante precisas y nos dirá cuándo es mejor abrir y cerra una transacción. Eche un vistazo  al vídeo  (6:22), ¡contiene un ejemplo de procesamiento de una sola señal que ha amortizado el indicador! La mayoría de los tráders mejoran sus resultados comerciales durante l
    El Indicador de Cuadrados de Gann es una herramienta poderosa de análisis de mercado basada en el artículo "Fórmula Matemática para Predicciones de Mercado" escrito por W.D. Gann, que se basa en conceptos matemáticos para el análisis. Incorpora elementos de las técnicas de Gann relacionadas con los cuadrados de 144, 90 y 52, así como el cuadrado de 9. Además, incluye el método del  sobre cómo combinar el cuadrado de 9 con canales y patrones de estrellas. Manual del Usuario y Modo de Uso: Antes d
    TPA True Price Action indicator reveals the true price action of the market makers through 100% non-repainting signals strictly at the close of a candle! TPA shows entries and re-entries, every time the bulls are definitely stronger than the bears and vice versa. Not to confuse with red/green candles. The shift of power gets confirmed at the earliest stage and is ONE exit strategy of several. There are available now two free parts of the TPA User Guide for our customers. The first "The Basics"
    Quantum Trend Sniper
    Bogdan Ion Puscasu
    4.8 (49)
    Introduciendo       Indicador Quantum Trend Sniper   , el innovador indicador MQL5 que está transformando la forma en que identificas y negocias los cambios de tendencia. Desarrollado por un equipo de comerciantes experimentados con experiencia comercial de más de 13 años,       Indicador de francotirador de tendencia cuántica       está diseñado para impulsar su viaje comercial a nuevas alturas con su forma innovadora de identificar cambios de tendencia con una precisión extremadamente alta.
    Ahora $ 147 (aumentando a $ 499 después de algunas actualizaciones) - Cuentas ilimitadas (PC o Mac) Manual de usuario de RelicusRoad + Videos de capacitación + Acceso al grupo privado de Discord + Estado VIP UNA NUEVA MANERA DE VER EL MERCADO RelicusRoad es el indicador comercial más poderoso del mundo para divisas, futuros, criptomonedas, acciones e índices, y brinda a los comerciantes toda la información y las herramientas que necesitan para mantenerse rentables. Brindamos análisis téc
    PTS - Buscador de Compras por Divergencia de Precision Trading Systems El Buscador de Divergencias de Precisión fue diseñado para encontrar los mínimos del mercado con una precisión milimétrica y lo hace con frecuencia. En el análisis técnico, la habilidad de identificar mínimos generalmente es mucho más fácil que identificar máximos, y este elemento está diseñado precisamente para esa tarea. Después de identificar una divergencia alcista, es prudente esperar a que la tendencia se vuelva al
    GannRS Trend Scalper   GannRS is an advanced trading tool based on Gann Law and Supports and Resistances. designed to have an   active trading at any time not lagging Indications are given at the beginning of a new candle Please watch the full tutorial video. How to use GannRS Very easy to set up... Put it on your chart Adjust inputs Inputs Show Resistance and support : [bool]  true = Shows R/S on chart false = does not show Show Levels :[bool]  true = Shows levels on the chart false = doe
    Advanced Supply Demand MT5
    Bernhard Schweigert
    4.5 (14)
    ¡Actualmente con 33% de descuento! ¡La mejor solución para cualquier tráder principiante o experto! Este indicador es una herramienta comercial única, de alta calidad y asequible, porque incorpora una serie de características patentadas y una nueva fórmula. Con esta actualización, podrá mostrar zonas de doble marco temporal. No solo podrá mostrar un marco temporal más alto, sino también mostrar ambos, el marco temporal del gráfico MÁS el marco temporal más alto: MOSTRANDO ZONAS ANIDADAS. A todos
    ¿Está buscando un potente indicador de compraventa de divisas que pueda ayudarlo a identificar oportunidades comerciales rentables con facilidad? No busque más allá de Beast Super Signal. Este indicador basado en tendencias fácil de usar monitorea continuamente las condiciones del mercado, buscando nuevas tendencias en desarrollo o saltando sobre las existentes. Beast Super Signal da una señal de compra o venta cuando todas las estrategias internas se alinean y están en 100% de confluencia entre
    FxaccurateLS
    Shiv Raj Kumawat
    WHY IS OUR FXACCCURATE LS MT5 THE PROFITABLE ? PROTECT YOUR CAPITAL WITH RISK MANAGEMENT Gives entry, stop and target levels from time to time. It finds Trading opportunities by analyzing what the price is doing during established trends. POWERFUL INDICATOR FOR A RELIABLE STRATEGIES We have made these indicators with a lot of years of hard work. It is made at a very advanced level. Established trends provide dozens of trading opportunities, but most trend indicators completely ignore them!
    [ MT4 Version ] Only the next 10 units at current price! Final price: $299 Are you tired of spending months on demo or live accounts to test your trading strategies? The Backtesting Simulator is the ultimate tool designed to elevate your backtesting experience to new heights. Utilizing Metatrader historical symbol information, it offers an unparalleled simulation of real market conditions. Take control of your testing speed, test ideas quickly or at a slower pace, and witness remarkable improve
    Introducing the POWER TRADE indicator created by a small group of traders with a few years trading trading the financial market profitably . This is a plug and play indicator that provides you with  POWERFUL Entry signals with Profit Taking and rebound zones. The indicator Works with all MT5 trading instruments. The indicator uses previous  chart data as receipt to speculate on future market moves.
    Trend Forecaster
    Alexey Minkov
    5 (6)
    The Trend Forecaster indicator utilizes a unique proprietary algorithm to determine entry points for a breakout trading strategy. The indicator identifies price clusters, analyzes price movement near levels, and provides a signal when the price breaks through a level. The Trend Forecaster indicator is suitable for all financial assets, including currencies (Forex), metals, stocks, indices, and cryptocurrencies. You can also adjust the indicator to work on any time frames, although it is recommen
    First of all Its worth emphasizing here that this Trading indicator is   Non-Repainting   , Non Redrawing and Non Lagging Indicator   Which makes it ideal from both manual and robot trading .  Viking Strategy Signal Indicator  - is a trend indicator that automatically analyzes the market and provides information about the trend and each of its changes, as well as giving signals for entering trades without redrawing! . Exact entry points into transactions for currencies, crypto, metals, stock
    PZ Swing Trading MT5
    PZ TRADING SLU
    5 (4)
    Swing Trading es el primer indicador diseñado para detectar oscilaciones en la dirección de la tendencia y posibles oscilaciones de reversión. Utiliza el enfoque de intercambio de línea de base, ampliamente descrito en la literatura comercial. El indicador estudia varios vectores de precios y tiempos para rastrear la dirección de la tendencia agregada y detecta situaciones en las que el mercado está sobrevendido o sobrecomprado y listo para corregir. [ Guía de instalación | Guía de actualización
    Gartley Hunter Multi
    Siarhei Vashchylka
    5 (8)
    Gartley Hunter Multi - An indicator for searching for harmonic patterns simultaneously on dozens of trading instruments and on all possible timeframes. Manual (Be sure to read before purchasing) | Version for MT4 Advantages 1. Patterns: Gartley, Butterfly, Shark, Crab. Bat, Alternate Bat, Deep Crab, Cypher 2. Simultaneous search for patterns on dozens of trading instruments and on all possible timeframes 3. Search for patterns of all possible sizes. From the smallest to the largest 4. A
    AT Forex Indicator MT5
    Marzena Maria Szmit
    5 (4)
    The AT Forex Indicator MT5 is a sophisticated trading tool designed to provide traders with a comprehensive analysis of multiple currency pairs. This powerful indicator simplifies the complex nature of the forex market, making it accessible for both novice and experienced traders. AT Forex Indicator uses advanced algorithms to detect trends, patterns and is an essential tool for traders aiming to enhance their forex trading performance. With its robust features, ease of use, and reliable signal
    Volume by Price MT5
    Brian Collard
    3.25 (4)
    The Volume by Price Indicator for MetaTrader 5 features Volume Profile and Market Profile TPO (Time Price Opportunity). Volume and TPO histogram bar and line charts. Volume Footprint charts. TPO letter and block marker collapsed and split structure charts. Static, dynamic and flexible range segmentation and compositing methods with relative and absolute visualizations. Session hours filtering and segment concatenation with Market Watch and custom user specifications. Graphical layering, positio
    FX Market Correlation indicator calculates the weakness/strength from all 28 currency pairs in the market. This is unique and powerful way of watching the market. It works on all timeframes. You can use it for scalping, or you can use it for long term trading. FX Market Correlation indicator is NOT repainting. Features: --------- -easy determine which currency is strengthening and which is weakening -choose best currency pairs to trade and times to trade them -find correlation between pairs -N
    Scalping Tool for Deriv Description: This trading indicator is designed for traders specializing in scalping. It provides signals for trading in the direction of short-term price movements. The indicator is optimized for use on the M1 timeframe and supports Boom and Crash indices (300, 500, 1000). The indicator will be sold in a limited quantity. Features: Trading direction: towards short-term price movements. Filters and indicators: Reaction volume indicator: displays activity zones. Trend i
    TrendMaestro5
    Stefano Frisetti
    note: this indicator is for METATRADER4, if you want the version for METATRADER5 this is the link:  https://www.mql5.com/it/market/product/108106 TRENDMAESTRO ver 2.4 TRENDMAESTRO recognizes a new TREND in the bud, he never makes mistakes. The certainty of identifying a new TREND is priceless. DESCRIPTION TRENDMAESTRO identifies a new TREND in the bud, this indicator examines the volatility, volumes and momentum to identify the moment in which there is an explosion of one or more of these data a
    ¡La mejor solución para cualquier operador novato o experto! Este indicador es una herramienta única, de alta calidad y asequible porque hemos incorporado una serie de características propias y una nueva fórmula. ¡Con sólo UN gráfico puede leer la Fuerza de la Divisa para 28 pares de Divisas! Imagínese cómo mejorará su operativa porque podrá señalar el punto exacto de activación de una nueva tendencia o de una oportunidad de scalping. Manual del usuario: haga   clic aquí Ese es el primero
    XQ Indicator MetaTrader 5
    Marzena Maria Szmit
    3 (2)
    Step into the realm of Forex trading with confidence and precision using XQ, a cutting-edge Forex indicator designed to elevate your trading game to unprecedented heights. Whether you're a seasoned trader or just stepping into the world of currency exchange, XQ Forex Indicator empowers you with the insights and signals needed to make informed trading decisions. The signal conditions are a combination of three indicators, and XQ Forex Indicator only display  medium and long-term trends . The ind
    Fxaccurate TCT
    Shiv Raj Kumawat
    WHY IS OUR FXACCCURATE TCT MT5 THE PROFITABLE ? Gives entry, stop and target levels from time to time. It finds Trading opportunities by analyzing what the price is doing during established trends. We have made these indicators with a lot of years of hard work. It is made at a very advanced level. Established trends provide dozens of trading opportunities, but most trend indicators completely ignore them! The trend reveals trading indicator represents an average of 10 different trades per trend
    Este es posiblemente el indicador de reconocimiento automático de formación de precios más completo que puede encontrar para la plataforma MetaTrader. Detecta 19 patrones diferentes, toma las proyecciones de Fibonacci tan en serio como usted, muestra la zona de reversión potencial (PRZ) y encuentra niveles adecuados de stop-loss y take-profit. [ Guía de instalación | Guía de actualización | Solución de problemas | FAQ | Todos los productos ] Detecta 19 formaciones de precios armónicos difer
    ¿Cansado de trazar líneas de soporte y resistencia? La resistencia de soporte es un indicador de marco de tiempo múltiple que detecta y traza automáticamente los soportes y las líneas de resistencia en el gráfico con un giro muy interesante: a medida que los niveles de precios se prueban con el tiempo y aumenta su importancia, las líneas se vuelven más gruesas y oscuras. [ Guía de instalación | Guía de actualización | Solución de problemas | FAQ | Todos los productos ] Mejora tu análisis técnic
    Otros productos de este autor
    MNG Mt5
    TDINVEST LLP
    4.3 (10)
    IMPORTANT : When testing the EA or running it live, make sure to set "Activate MNG Martingale" to "True" Hello & Welcome To MNG MNG is a martingale EA that allows you to configure a lot of features that I'll detail below. But first, I'd like to insist on the fact that a martingale EA is never safe, no matter if it has a good track record for 5+ years, if it shows incredible backtest results, if it's marketed as the best EA or whatever its price is ($30,000 or $50). A martingale EA might bl
    FREE
    Master Pullback
    TDINVEST LLP
    5 (3)
    - 50% OFF - Telegram group : https://t.me/+5RIceImV_OJmNDA0 MT5 version : https://www.mql5.com/en/market/product/85917?source=Site+Market+Product+Page Master Pullback is a complete system that gives unique trading opportunities and a clear indication of the market: trend, signals as well as stop loss and take profit levels. This system has been designed to be as simple as possible and detects extreme overbought and oversold zones, support and resistance levels, as well as the major trend. You
    Filtro:
    No hay comentarios
    Respuesta al comentario