Draw On 1 TimeFrame
- Indicadores
- Peter Andrew Thomas
- Versión: 1.0
- Activaciones: 10
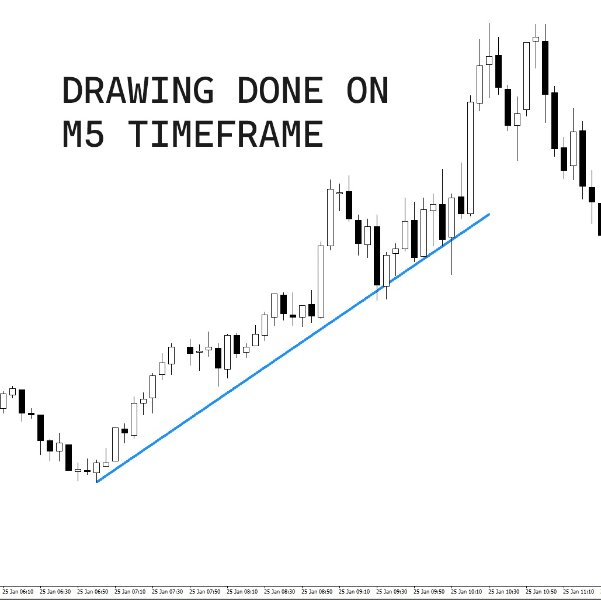
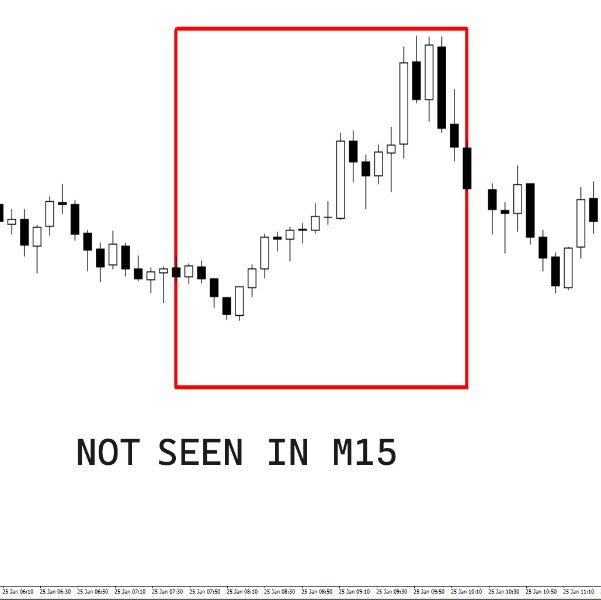
Draw On 1 Timeframe: Does exactly what the name says! When you draw a rectangle or trendline - the timeframe you draw it in, is the one it is visible. When you look at a higher or lower timeframe - the drawn object is not seen, but when you change back to the timeframe you originally draw in - the object can be seen.
How to use it:
This is an indicator that interacts with all trendline or rectangle objects drawn. Once running - it will automatically make any drawn trendline or rectangle object only visible on the timeframe you draw it on.
What if I want to see the drawing on all timeframes:
By right clicking on the object (Trendline or Rectangle) - you can click on properties, then visualization then click on "Show on all timeframes" this will make it visible again.
What drawing tools can I use:
This will work with any tool that allows you to draw trendlines or rectangles. If you don't have one - you can try using Color Level's which is excellent for Supply / Demand - Support / Resistance drawings: https://www.mql5.com/en/market/product/12215?source=External
