RSI RG Color Bars
- Indicadores
- Chang Hou
- Versión: 1.0
- Activaciones: 5
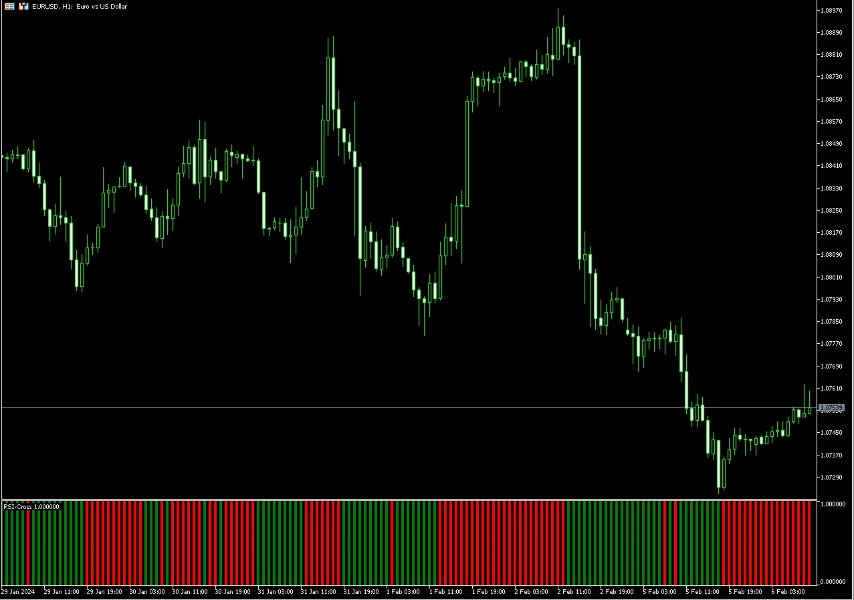
By simply inputting the parameters for the RSI, you can obtain the RSI indicator represented by red and green bars.
The application of the RSI indicator has been expanded into a powerful new indicator, visually presented through red and green bars, undoubtedly an innovative move in the field of financial technical analysis. The design of the red and green bars is ingenious, allowing investors to grasp market dynamics at a glance. When the bars are green, it indicates a relatively stable phase in the market, while a transition to red suggests potential volatility. This intuitive visual effect not only simplifies the analysis process but also significantly improves decision-making efficiency.
The practicality of this indicator has been thoroughly validated. Through backtesting and real-time data analysis, we have found that it accurately predicts market turning points, providing valuable trading signals for investors. Furthermore, the parameters of this indicator can be adjusted to accommodate different markets and asset types, adapting to various investment environments.
It not only inherits the advantages of the traditional RSI indicator but also achieves more precise and efficient market analysis through innovative design and functional optimization.


