• Información general
  • Comentarios (1)
  • Discusión

Pivot on Day Range

¿Cuántas veces ha buscado un PIVOT que funcione en un intervalo de tiempo específico cada día?

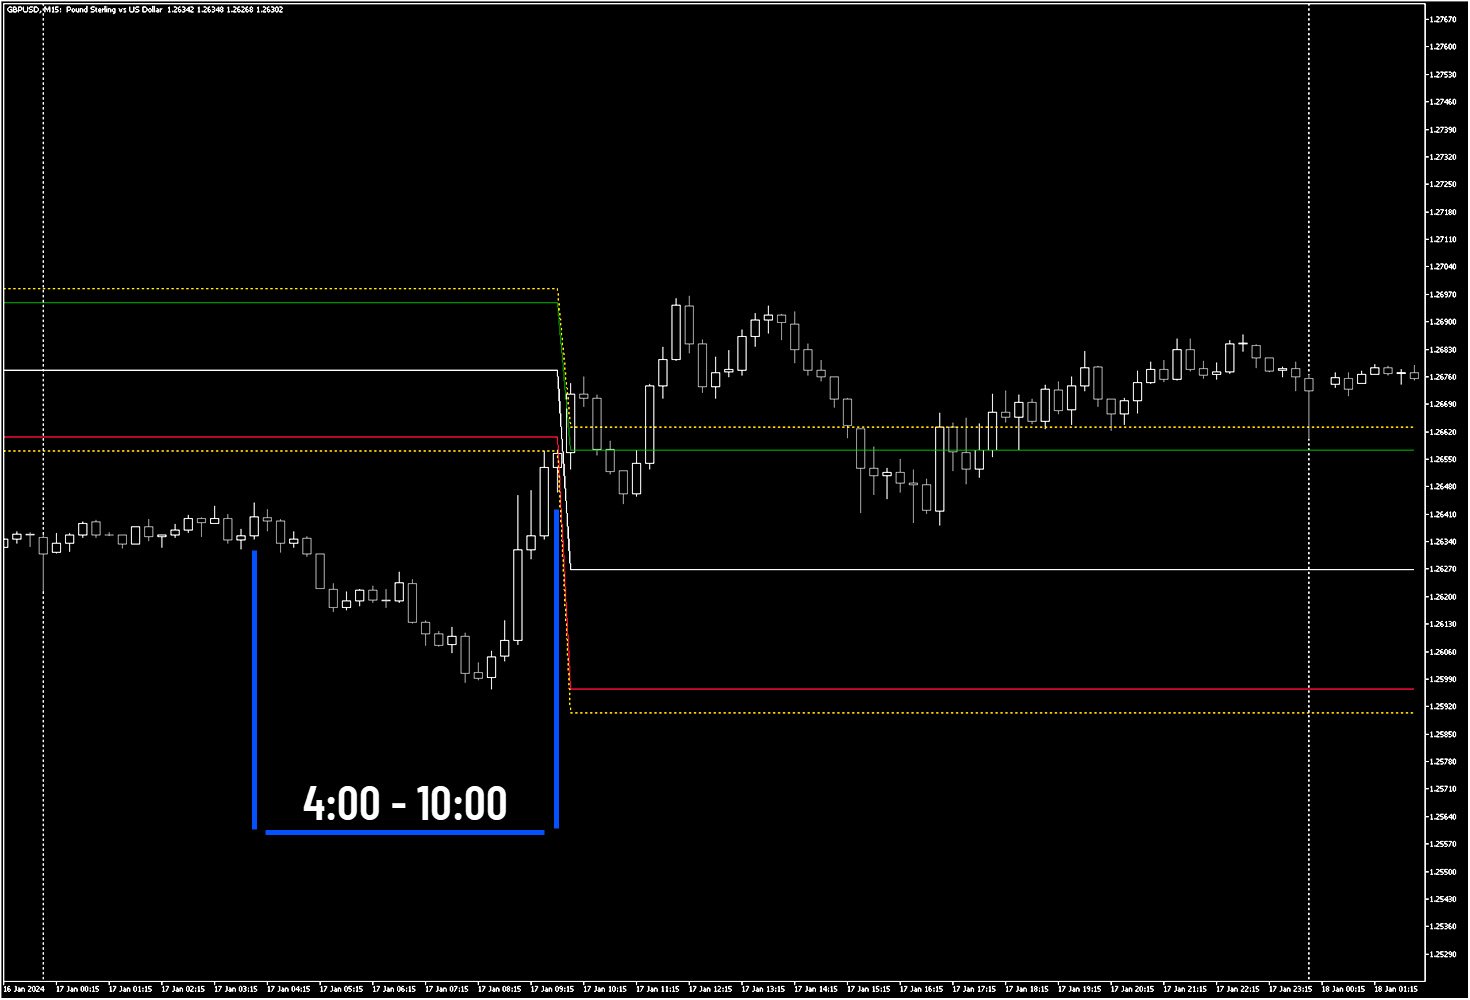
A muchos operadores les gusta estimar la dirección de la tendencia del día basándose en un intervalo de tiempo específico cada día, como desde 2 horas antes de la apertura de la Bolsa de Nueva York hasta 1 hora después, o desde la apertura de la Bolsa de Nueva York hasta 30 minutos después.

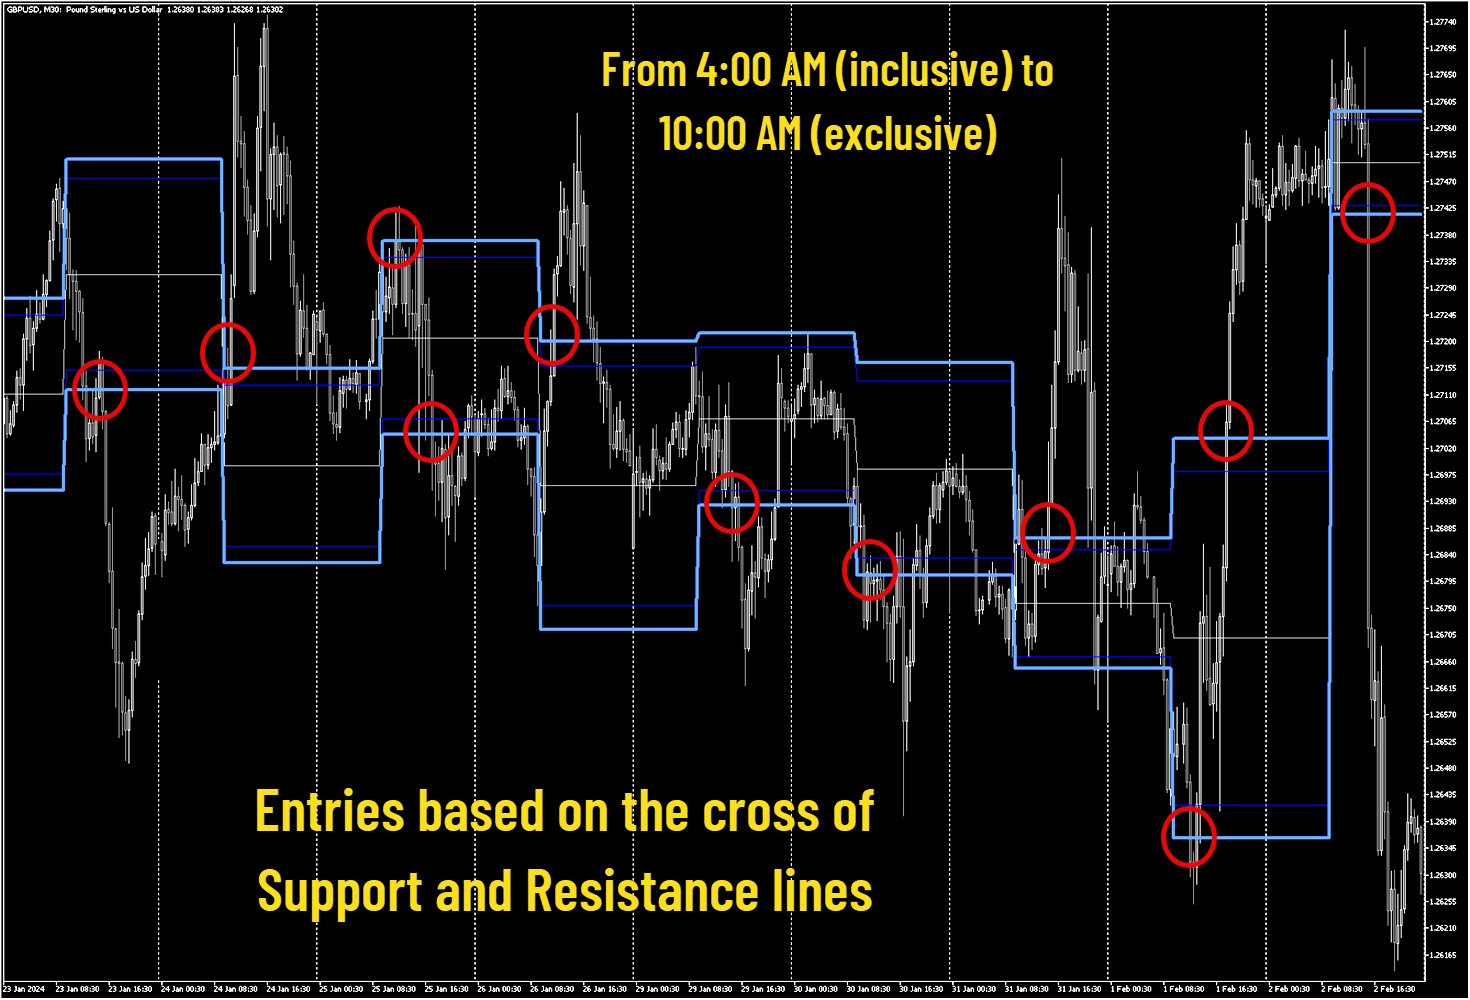
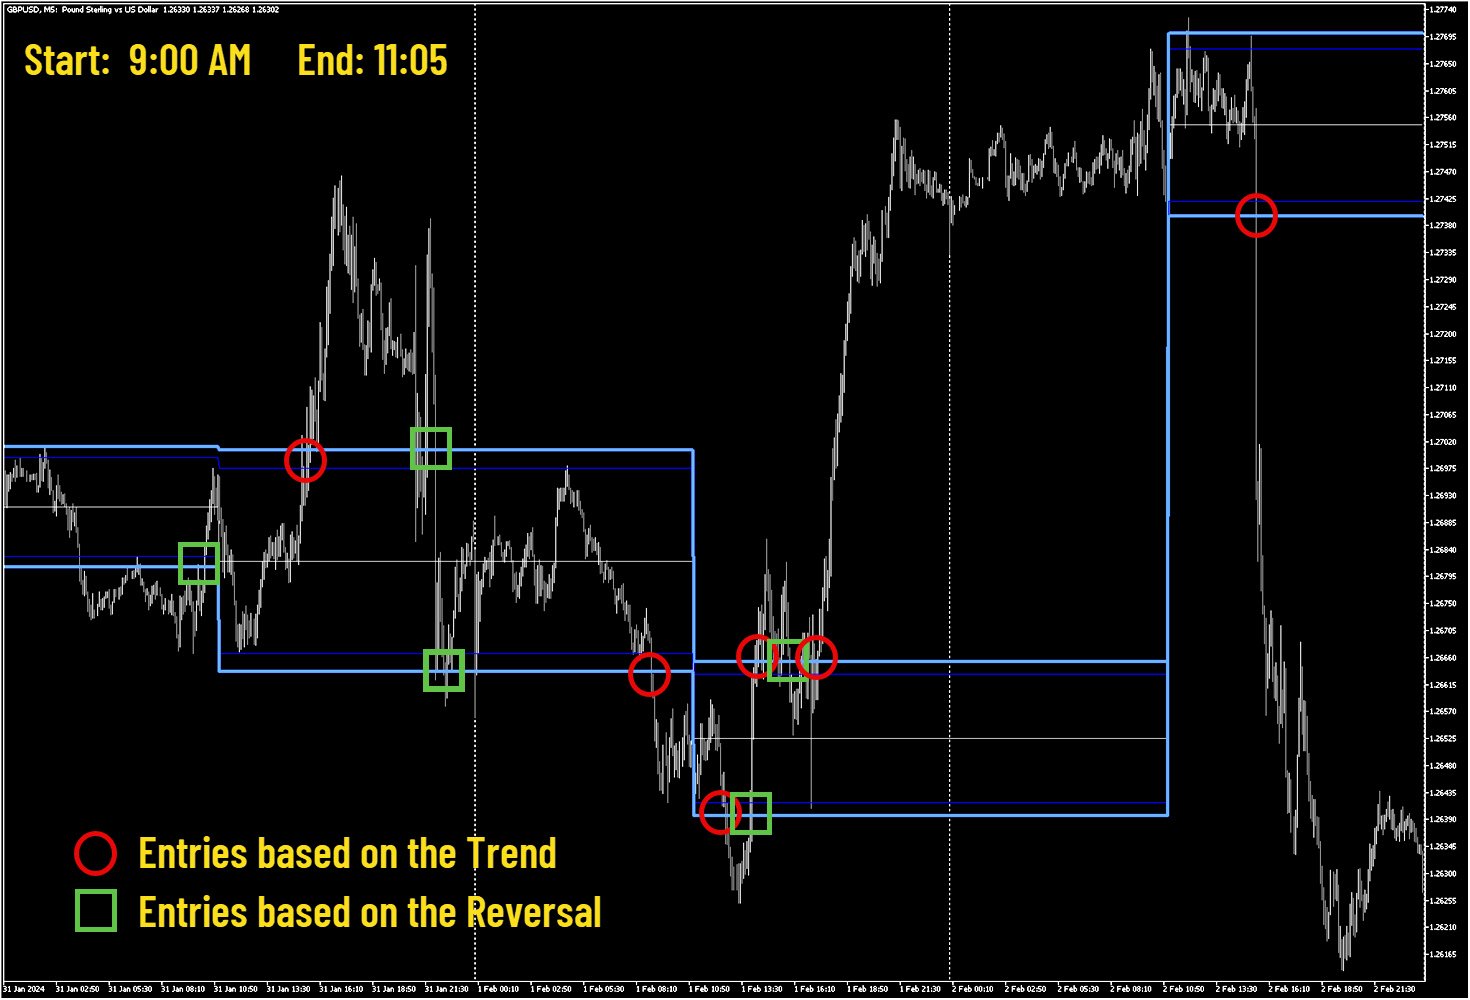
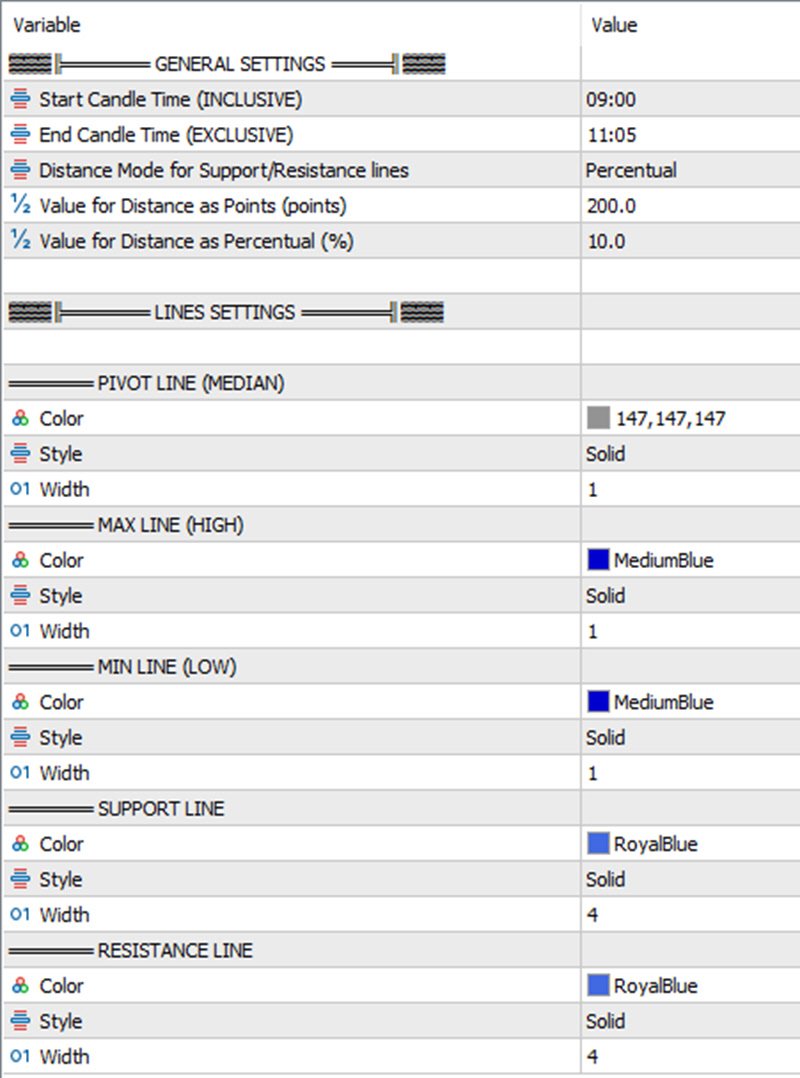
Este indicador le permite especificar un intervalo de tiempo determinado (hora y minuto) y traza un pivote desde ese intervalo hasta el día siguiente en el mismo intervalo de tiempo. En función de ello, muestra cinco líneas: mediana, máximo, mínimo, soporte y resistencia.

Si la hora elegida está fuera de los límites del PERÍODO (por ejemplo, 10:12 en un marco temporal M5), redondea este valor a la hora de vela más cercana. Además, permite configurar todas las líneas en cuanto a estilo, color y anchura.

Espero que consigas buenas operaciones con él.
Productos recomendados
MultiSymbolsWpr Indice x IBOV
Israel Goncalves Moraes De Souza
O Indicador identifica relação do Índice com a soma dos principais ativos, funciona para qualquer mercado do mund o, possui um oscilador WPR com a soma dos principais ativos escolhidos, indicando a antecipação do movimento em relação ao Índice. Características WPR com a soma dos papéis escolhidos - branco WPR do papel atual - vermelho Canal de Tendência O indicador pode indicar movimento de entradas, sendo: cruzamento das linhas cruzamento da linha Multi Symbols no -50 cruzamento entre os canai
FREE
Pivot Point Fibo RSJ es un indicador que rastrea las líneas de soporte y resistencia del día utilizando las tasas de Fibonacci. Este espectacular indicador crea hasta 7 niveles de soporte y resistencia a través del Pivot Point utilizando las tasas de Fibonacci. Es fantástico cómo los precios respetan cada nivel de este soporte y resistencia, donde es posible percibir posibles puntos de entrada / salida de una operación. Características Hasta 7 niveles de soporte y 7 niveles de resistencia Es
FREE
NeuroExt
Dmytryi Voitukhov
4 (11)
https://t.me/mql5_neuroExt   actual version Signal https://www.mql5.com/ru/signals/1511461 You can use any tool. The bases will be automatically created at the start of the Learn. If you need to start learning from 0 - just delete the base files. Initial deposit - from 200 ye. Options: DO NOT ATTEMPT TO TEST WITHOUT NEURAL NETWORK TRAINING! it is enough for the balance graph after training to be horizontal. generating a training base is extremely simple.  there is a ready-made training for U
FREE
SR Breakup
Francisco De Biaso Neto
SR Breakup Indicator   it is an indicator based on support and resistance . It makes price breakout levels visible by opening the trader's mind to spot market opportunities.  Attention!!!   This Indicator can be used in any time frame. Suggestion of use Wait until the support and resistance lines are horizontal and closer. Do Trade (BUY):  if price breakout resistance level (outside line). Do Trade (SELL):  if price breakout support level (outside line). Use internal lines as StopLo
Posh Candle Info MT5
Theresia Yovitha Herwanda
Show candle info with: Time in selected timezone  Bar number Candle range points Upper wick points and percentage Body   points and percentage Lower wick   points and percentage Mark large/small candle body with customizable line. Settings group: Broker and local timezone. Lookback bars for candle marking. Large candle body Small candle body Date and time info with auto position or custom the x and y coordinate.
FREE
My Pivot
Ashok Kumar Singha
My Pivot is an Indicator based on Pivot Lines and Support-Resistance zones. This Indicator will Plot 11 SR zones including Pivot Line which will definitely help you to understand the exact SR zones of the Market. Steps to Setup the Indicator: Install the Custom Indicator; Set all the Lines Color, Width and Styles; Set visualization to All Timeframe; and DONE It can be used for: All Pairs: Forex, Cryptocurrencies, Metals, Stocks, Indices.  All Timeframe All Brokers All type of Trading S
Girassol Sunflower MT5 Indicator
Saullo De Oliveira Pacheco
4.33 (6)
This is the famous Sunflower indicator for Metatrader5. This indicator marks possible tops and bottoms on price charts. The indicator identifies tops and bottoms in the asset's price history, keep in mind that the current sunflower of the last candle repaints, as it is not possible to identify a top until the market reverses and it is also not possible to identify a bottom without the market stop falling and start rising. If you are looking for a professional programmer for Metatrader5, please
FREE
Santa Donchian
Marco Aurelio Cestari
4.5 (2)
Santa Donchian Indicator  is an efficient way to detect support, resistence and break outs in any market. The Donchian channel measures the high and the low of a previously defined range.  Typically, a trader would look for a well-defined range and then wait for the price to break out to either one side for a trade entry trigger. Advantages Never repaints, never backpaints, never recalculates. Works in all symbols and all timeframes. Perfect trend filter for any strategy or expert advisor. Full
FREE
High Low Open Close
Alexandre Borela
4.98 (42)
Si te gusta este proyecto, deja una revisión de 5 estrellas. Este indicador dibuja los precios abiertos, altos, bajos y finales para los especificados período y se puede ajustar para una zona horaria específica. Estos son niveles importantes considerados por muchos institucionales y profesionales comerciantes y puede ser útil para que usted sepa los lugares donde podrían ser más activo. Los períodos disponibles son: Día previo. Semana anterior. Mes anterior. Barrio anterior. Año anterior. O:
FREE
LT Donchian Channel
Thiago Duarte
4.83 (6)
Donchian Channel is an indicator created by Richard Donchian. It is formed by taking the highest high and the lowest low of the last specified period in candles. The area between high and low is the channel for the chosen period. Its configuration is simple. It is possible to have the average between the upper and lower lines, plus you have alerts when price hits one side. If you have any questions or find any bugs, please contact me. Enjoy!
FREE
Simple Weis Wave
Jean Jacques Huve Ribeiro
3.67 (3)
One of the best tools for analyzing volume, Weis Wave was idelized by David Weis, to facilitate the reading of directional flow. For the VSA method disciples it is an evolution of the practices created by Richard Wycoff, facilitating a predictive reading of the market, always seeking an accumulation and distribution of the negotiated contracts. Cumulative wave volume  Range of wave ( removed) Average Wave volume Ref "Tim Ord lectures" ( removed)
FREE
Cybertrade Keltner Channels
Emanuel Andriato
4.75 (4)
Cybertrade Keltner Channels - MT5 Created by Chester Keltner, this is a volatility indicator used by technical analysis. It is possible to follow the trend of financial asset prices and generate support and resistance patterns. In addition, envelopes are a way of tracking volatility in order to identify opportunities to buy and sell these assets. It works on periods longer than the period visible on the chart. All values ​​are available in the form of buffers to simplify possible automations.
FREE
Here I present you this awesome indicator I made. This is a nique combination witch puts you in the same level as MM's. So you can surf a lot of waves and identify the rally time, breakouts, and the perfect time to get in the market. ---- The SSL Channel is a great all-rounder based on 2 Simple Moving Averages, one of recent Highs, one of recent Lows. The calculation prints a   channel   on the chart consisting of 2 lines. This strategy gives a Long signal when price closes above the top of thes
Weis Wave Double Side Alert
Eduardo Da Costa Custodio Santos
El indicador lateral Weis Wave Bouble para MT5 es parte del conjunto de herramientas (Wyckoff Academy Wave Market) El indicador lateral Weis Wave Bouble para MT5 se creó en base al ya establecido Weis Wave creado por David Weis. El indicador Weis Wave Double Side lee el mercado en ondas como lo hizo R. Wyckoff en 1900. Ayuda a identificar esfuerzo x resultado, causa y efecto, oferta y demanda. Su diferencial es que se puede usar debajo del eje cero y tiene una alerta de ruptura que muestra Quien
VR Pivot MT5
Vladimir Pastushak
VR Pivot es un indicador de puntos de pivote clave (pivot). Los puntos de pivote son un tipo especial de niveles de soporte (support) y resistencia (resistance) que se utilizan para identificar las zonas de precios más fuertes. Los comerciantes profesionales utilizan los niveles de pivote para determinar los precios a los que hay una alta probabilidad de una reversión de precios. Los niveles se calculan de acuerdo con fórmulas matemáticas especiales, se tienen en cuenta los precios de cierre, ap
MIDAS Super VWAP
Flavio Javier Jarabeck
4.44 (9)
Imagine VWAP, MVWAP and MIDAS in one place... Well, you found it! Now you can track the movement of Big Players in various ways, as they in general pursue the benchmarks related to this measuring, gauging if they had good execution or poor execution on their orders. Traders and analysts use the VWAP to eliminate the noise that occurs throughout the day, so they can measure what prices buyers and sellers are really trading. VWAP gives traders insight into how a stock trades for that day and deter
FREE
Free automatic Fibonacci is an indicator that automatically plots a Fibonacci retracement based on the number of bars you select on the BarsToScan setting in the indicator. The Fibonacci is automatically updated in real time as new highest and lowest values appears amongst the selected bars. You can select which level values to be displayed in the indicator settings. You can also select the color of the levels thus enabling the trader to be able to attach the indicator several times with differe
FREE
Functional in the Forex market. Functional in the B3 market - Bolsa Brasil Balcão. Motivation The technical Fibonacci retraction indicator for many is essential and the basis for all market movement forecasts. The name of the tool comes from the Italian mathematician Leonardo de Pisa (13th century). This DEMO version will work in Meta Trader with Demo and Strategy Tester. To purchase the Full version that works on a Real account, click on: https://www.mql5.com/en/market/product/38089 Opera
FREE
Weis Wave Double Side
Eduardo Da Costa Custodio Santos
El indicador lateral Weis Wave Bouble para MT5 es parte del conjunto de herramientas (Wyckoff Academy Wave Market) El indicador lateral Weis Wave Bouble para MT5 se creó en base al ya establecido Weis Wave creado por David Weis. El indicador Weis Wave Double Side lee el mercado en ondas como se hizo por R. Wyckoff en 1900. Ayuda a identificar esfuerzo x resultado, causa y efecto, oferta y demanda. Su diferencial es que se puede utilizar por debajo del eje cero, mejorando aún más más lectura del
Time Spaced Moving Averages
Flavio Javier Jarabeck
5 (3)
The concept is simple: Plotting Price behavior within several periods of time. Some Symbols behave very well during the trading day - with this I mean Intraday trading - and this behavior ends up plotting effectively well with the proposed Exponential Moving Averages in this indicator... Obviously that this behavior could not be seen in all Symbols, but you can give it a try... Just drop this indicator in a chart and you will see for yourself... This indicator is intended for "Feeling the Trend"
FREE
One Click Trader Utility MT5
AL MOOSAWI ABDULLAH JAFFER BAQER
One-Click Trader Utility for MT5 Professional Trading at Your Fingertips One-Click Trader Utility is a premium MT5 tool designed for active traders who need lightning-fast execution and real-time performance metrics. For just $30, transform your trading experience with institutional-grade technology previously available only to professional traders. Key Features Ultra-Fast Execution - Open and close positions with a single click, critical for scalpers and news traders Real-Time Market Metrics -
Super Trend eu
Emin Ulucanli
4.75 (4)
SUPERTREND; Es un indicador de seguimiento de tendencias basado en el SuperTrend ATR creado por Olivier Seban. Se puede utilizar para detectar cambios en la dirección de la tendencia y localizar paradas. Cuando el precio cae por debajo de la curva del indicador, se vuelve rojo e indica una tendencia bajista. Por el contrario, cuando el precio se mueve por encima de la curva, el indicador se vuelve verde, lo que indica una tendencia alcista. Al igual que otros indicadores, funciona bien en SuperT
FREE
Easy GOLD MT5
Franck Martin
3.97 (32)
Easy Gold is the latest addition to the BotGPT family. It is surprising and very powerful. It is ideal for beginners due to its simplicity.  There is absolutely nothing to do, it's 100% automated, simply indicate the percentage of risk you want to take per trade and the EA is ready. Whatever your capital, the EA takes care of everything. Optimized on (XAUUSD).  Unleash all the power with the professional version (AGI Gold) and its connection to the neural network, available in my store. My othe
FREE
To get access to MT4 version please click   here . This is the exact conversion from TradingView: "Schaff Trend Cycle" by "everget". This is a light-load processing indicator. This is a non-repaint indicator. Buffers are available for processing in EAs. All input fields are available except fillings(due to graphical aesthetics). You can message in private chat for further changes you need. Thanks for downloading
La esencia del sistema consiste en la identificación del momento de formación de la vela compuesta "de vuelta" con características determinadas (tamaño de la vela en puntos, estructura de sombras).En el análisis de las velas japonesas el análogo de estas velas de vuelta son "Martillo" (Hammer) y "Hombre colgado" (Hanging Man), pero en este sistema el cuerpo de la vela no tiene que ser obligatoriamente pequeño, y la vela resultante se construye de varias velas. Parámetros de entrada del sistema:
FREE
Trend Slayer Indicator
Felipe Carvalho De Queiroz
Trend Indicator Pro Use any currency and any time period you want For greater profitability use a risk return of at least 1:3 or 1:4 Entry Signal : Appears after the moving average crossover closes ️️ Histogram Flip : Signals important trend changes ️ Easy to use : Perfect for those who want fast, confident decisions! Boost your accuracy : Find the best market entry moments with more confidence! Get straight to the point and seize the best trend opportunities!
This z-score indicator shows the correct z-score of an asset, as it uses the normalized price data for calculation, which is the only correct way. Z-score is only applicable for normal distributed data, therefore not the actual price is considered, but the normalised returns, which were assumed to follow a normal distribution. Returns are mean reverting and assumed to follow a normal distribution, therefore z-score calculation of returns is more reliable than z-score on price, as price is NOT m
Best SAR MT5
Ashkan Hazegh Nikrou
4.33 (3)
Descripción :  nos complace presentar nuestro nuevo indicador gratuito basado en uno de los indicadores profesionales y populares en el mercado de divisas (PSAR). Este indicador es una nueva modificación del indicador Parabolic SAR original. En el indicador pro SAR puede ver el cruce entre puntos y el gráfico de precios. el cruce no es una señal, pero habla sobre el final del potencial de movimiento, puede comenzar a comprar con un nuevo punto azul y colocar un límite de pérdidas un atr antes
FREE
RastroBot usa o indicador Donchian Channel para identificar sinais de entrada, inspirados nas famosas estratégias Turtle. Simples e eficaz, é amplamente utilizado por traders profissionais e está integrado ao MT5. Ideal para quem quer usar esses sinais em operações de scalping. Não usa IA, Martingale ou Grid. Não é um "santo graal" do trading, mas uma estratégia honesta para lucrar com rápidas acelerações de tendência. O EA pode ser usado além do scalping, ajustando ou desativando o trailing
Los compradores de este producto también adquieren
TPSpro RFI Levels MT5
Roman Podpora
4.53 (19)
INSTRUCCIONES       RUSO   -   ING        Se   recomienda utilizar con un indicador.       -       TPSpro   TENDENCIA PRO -   Versión MT5 Un elemento clave en el trading son las zonas o niveles desde los que se toman las decisiones de compra o venta de un instrumento de trading. A pesar de los intentos de los principales actores de ocultar su presencia en el mercado, inevitablemente dejan rastros. Nuestra tarea era aprender a identificar estos rastros e interpretarlos correctamente. Funciones p
This indicator is based on the mathematics of the great trader W.D. Ganna. With its help, you can easily find strong levels by analyzing swings to find the optimal entry point. The indicator works on all instruments and all timeframes. The indicator is fully manual and has control buttons. All you need to do is press the NEW button, a segment will appear, which you can place on any movement, swing or even 1 candle that you want to analyze. By placing the segment, press the OK button. A grid (th
This indicator identifies and displays zones, as it were areas of strength, where the price will unfold. The indicator can work on any chart, any instrument, at any timeframe. The indicator has two modes. The indicator is equipped with a control panel with buttons for convenience and split into two modes. Manual mode: To work with manual mode, you need to press the NEW button, a segment will appear. This segment is stretched over the movement and the LVL button is pressed. The level is displayed
PZ Trend Trading MT5
PZ TRADING SLU
3.8 (5)
Trend Trading es un indicador diseñado para sacar el máximo provecho posible de las tendencias que tienen lugar en el mercado, mediante el cronometraje de retrocesos y rupturas. Encuentra oportunidades comerciales al analizar qué está haciendo el precio durante las tendencias establecidas. [ Guía de instalación | Guía de actualización | Solución de problemas | FAQ | Todos los productos ] Opere en los mercados financieros con confianza y eficiencia Aproveche las tendencias establecidas sin ser
RelicusRoad Pro MT5
Relicus LLC
4.78 (18)
Ahora $ 147 (aumentando a $ 499 después de algunas actualizaciones) - Cuentas ilimitadas (PC o Mac) Manual de usuario de RelicusRoad + Videos de capacitación + Acceso al grupo privado de Discord + Estado VIP UNA NUEVA MANERA DE VER EL MERCADO RelicusRoad es el indicador comercial más poderoso del mundo para divisas, futuros, criptomonedas, acciones e índices, y brinda a los comerciantes toda la información y las herramientas que necesitan para mantenerse rentables. Brindamos análisis técnico
EXCLUSIVE! JUST  10 COPIES  AVAILABLE!   BONUS AUX VIP Club 2024 : Include EA CAP, CEP, LDH, PSC307 & AO4C to enhance the performance of this tool to its maximum potential  Click Here to Download Files   ( for users only ) FREE Trading Education Available Daily via Zoom --- For More Info or Instant Message Click link ---  https://t.me/abcdwave Transform your trading with the "Five Magic Bullets" Indicator, tailored for traders who embrace the power of Elliott Wave Chaos Theory.
CBT Quantum Maverick Sistema de Comercio de Opciones Binarias de Alta Eficiencia CBT Quantum Maverick es un sistema de opciones binarias de alto rendimiento diseñado para traders que buscan precisión, simplicidad y un enfoque disciplinado. No requiere personalización: el sistema está optimizado para resultados efectivos desde el primer momento. Simplemente sigue las señales, que se pueden dominar con un poco de práctica. Características clave: Precisión de señales: Señales basadas en la próxim
Hello I Want to introduce The Forex Buy Sell Arrow Premium MT5 i recently release this premium indicator! its 1000% Non Repaint Indicator, It Work Perfectly Well,, i tested it day by day, Just mind blowing Result,  Including Powerful trend Algorithm! How It Work? well, it work market trend formula, when trend Bullish Or when trend Bearish,  Recommend Timeframe M30, H1 it work all timeframe, and all currency pair, 100% non repaint, How to take signal From Forex Buy Sell Arrow Premium Ind
FxaccurateLS
Shiv Raj Kumawat
WHY IS OUR FXACCCURATE LS MT5 THE PROFITABLE ? PROTECT YOUR CAPITAL WITH RISK MANAGEMENT Gives entry, stop and target levels from time to time. It finds Trading opportunities by analyzing what the price is doing during established trends. POWERFUL INDICATOR FOR A RELIABLE STRATEGIES We have made these indicators with a lot of years of hard work. It is made at a very advanced level. Established trends provide dozens of trading opportunities, but most trend indicators completely ignore them! The
Este es posiblemente el indicador de reconocimiento automático de formación de precios más completo que puede encontrar para la plataforma MetaTrader. Detecta 19 patrones diferentes, toma las proyecciones de Fibonacci tan en serio como usted, muestra la zona de reversión potencial (PRZ) y encuentra niveles adecuados de stop-loss y take-profit. [ Guía de instalación | Guía de actualización | Solución de problemas | FAQ | Todos los productos ] Detecta 19 formaciones de precios armónicos diferen
BookMap HeatMap
Roberto Spadim
1 (2)
This Indicator creates a heatmap based on depth of market of the current symbol or another symbol. Other symbol is useful when you trade futures market and a contract has 'mini' and 'full' split. For example, in Brazil (B3 - BMF&Bovespa), WDO and DOL are future Forex contract of BRL/USD (where 1 DOL = 5 WDO) and big banks work mostly with DOL (where liquidity is important). Please use with M1 timeframe , objects are too small to be displayed at higher timeframes (MT5 limit). The number of level
Indicador único que implementa un enfoque profesional y cuantitativo para el comercio de reversión a la media. Aprovecha el hecho de que el precio se desvía y vuelve a la media de manera predecible y medible, lo que permite reglas claras de entrada y salida que superan ampliamente las estrategias comerciales no cuantitativas. [ Installation Guide | Update Guide | Troubleshooting | FAQ | All Products ] Señales comerciales claras Sorprendentemente fácil de operar Colores y tamaños personalizables
Elliot Waves Analyzer Pro
Viktor Weidenthal
2.67 (3)
Elliot Waves Analyzer Pro calculates Elliot Waves to Help Identify Trend direction and Entry Levels. Mainly for Swing Trading Strategies. Usually one would open a Position in trend direction for Wave 3 or a Correction for Wave C . This Indicator draws Target Levels for the current and next wave. Most important Rules for Elliot Wave Analysis are verified by the Indicator.  The Pro version analyzes Multiple Timeframes and shows the Subwaves and Target-Levels.   For an Overview  " Elliot Waves Anal
TrendMaestro5
Stefano Frisetti
note: this indicator is for METATRADER4, if you want the version for METATRADER5 this is the link:  https://www.mql5.com/it/market/product/108106 TRENDMAESTRO ver 2.4 TRENDMAESTRO recognizes a new TREND in the bud, he never makes mistakes. The certainty of identifying a new TREND is priceless. DESCRIPTION TRENDMAESTRO identifies a new TREND in the bud, this indicator examines the volatility, volumes and momentum to identify the moment in which there is an explosion of one or more of these data a
VIP Buy Sell Signals
Hapu Arachchilage Tharindu Lakmal
Contact me through this email aaddress to download the FREE strategy PDF for this indicator tharindu999lakmal@gmail.com Introduction   The   "Buy Sell Signals"   is designed to provide BUY and SELL trade signals based on the current market conditions.   A   Trading Strategy   (Chee sheet)  has been  provided for this trading indicator.   (Read the description). This indicator has time tuned e ntry signals . so,   you will enter the market at the very best price level   with this indicator .  
Weis Wave with Alert MT5
Trade The Volume Waves Single Member P.C.
4.94 (16)
Rental/Lifetime Package Options and Privileges  Rent Monthly Six Months   Yearly/Lifetime Weis Wave with Speed with Alert+Speed Index x x x Manual  x x x Quick Set up Video x x x Blog x x x Lifetime Updates x x x Setup and Training Material x x Discord Access Channel "The SI traders"          x Rectangle Break Alert Tool      x How to trade with it:    http://www.tradethevolumewaves.com   ** If you purchase please contact me to setup your  : Two hour  webinar and  training Room and  complet
Seconds Charts
Aleksandr Goryachev
Micro  ******************* Секундные графики MT5 ********************** Более точного инструмента для входа в сделку вы не найдёте. Входные параметры: Timeframe, sek - период построения графика, секунды Displayed bars - отображаемые бары Step of price levels, pp, 0-off - шаг отрисовки ценовых уровней, пункты Scale points per bar, 0-off - масштаб в пунктах на бар Show lines - отображение текущих уровней Show comment - отображение комментария Standard color scheme - стандартная цветовая сх
VTrende Pro
Andrii Diachenko
5 (1)
VTrende Pro - MTF indicator for trend trading with a display panel for MT5 *** Videos can be translated into any language using subtitles (video language - Russian) Although the signals of the VTrende Pro indicator can be used as signals of a full-fledged trading system, it is recommended to use them in conjunction with the Bill Williams TS. VTrende Pro is an extended version of the VTrende indicator. Difference between Pro version and VTrende: - Time zones - Signal V - signal 1-2 waves -    S
PZ Day Trading MT5
PZ TRADING SLU
2.83 (6)
Este indicador detecta reversiones de precios en forma de zig-zag, utilizando solo análisis de acción de precios y un canal donchian. Ha sido diseñado específicamente para el comercio a corto plazo, sin repintar ni pintar en absoluto. Es una herramienta fantástica para comerciantes astutos con el objetivo de aumentar el tiempo de sus operaciones. [ Guía de instalación | Guía de actualización | Solución de problemas | FAQ | Todos los productos ] Increíblemente fácil de comerciar Proporciona va
WanaScalper
Isaac Wanasolo
1 (1)
A scalping indicator based on mathematical patterns, which on average gives signals with relatively small SL, and also occasionally helps to catch big moves in the markets (more information in the video) This indicator has three main types of notifications: The first type warns of a possible/upcoming signal on the next bar The second type indicates the presence of a ready signal to enter the market/open a position The third type is for SL and TP levels - you will be notified every time price re
AriBot
Arman Belassarov
AriMax   – AI-Powered Trading Robot AriMax is a cutting-edge AI-powered trading robot designed to help traders maximize profits while minimizing risk. Utilizing advanced machine learning algorithms and real-time market analysis, AriMax identifies high-probability trade opportunities with precision and speed. Key Features:     AI-Driven Market Analysis   – Analyzes market trends and patterns to make data-driven trading decisions.     Automated Execution   – Places trades seamlessly with optimiz
Big Player Range
Thalles Nascimento De Carvalho
5 (3)
Descubra el Poder de "BigPlayerRange": Su Aliado en el Análisis Técnico de Mercado Le presentamos BigPlayerRange , una herramienta avanzada de análisis técnico diseñada para revelar las zonas de interés institucional en el mercado. Con esta poderosa herramienta, podrá identificar con precisión las áreas donde los grandes jugadores están activos y mejorar sus estrategias de negociación. Características Principales: Mapeo de Zonas de Interés Institucional : BigPlayerRange destaca las zonas
IVISTscalp5
Vadym Zhukovskyi
5 (6)
Te presentamos el indicador iVISTscalp5, que no solo es único sino también efectivo en operaciones de trading. Este indicador se basa en datos temporales y es el resultado de muchos años de experiencia y análisis profundo de los mercados financieros. El indicador iVISTscalp5 es una excelente herramienta para el trading manual. La conveniencia, simplicidad y visualización, toda la complejidad está oculta en su interior. Hemos simplificado al máximo la configuración y uso del indicador iVISTscalp5
All in One package includes the  Oscillator Predictor ,  MACD Predictor ,  Thrust Scanner  and  Advanced Fibonacci  indicators which are mandatory for applying  Dinapoli  trade plans.  Please visit below links for detailed explanations of indicators. Advanced Fibonacci Indicator =>  https://www.mql5.com/en/market/product/107933 Thrust Scanner Indicator =>  https://www.mql5.com/en/market/product/52829 Overbought /Oversold Predictor indicator => https://www.mql5.com/en/market/product/52628 Macd
Introduction to X3 Chart Pattern Scanner X3 Cherart Pattern Scanner is the non-repainting and non-lagging indicator detecting X3 chart patterns including Harmonic pattern, Elliott Wave pattern, X3 patterns, and Japanese Candlestick patterns. Historical patterns match with signal patterns. Hence, you can readily develop the solid trading strategy in your chart. More importantly, this superb pattern scanner can detect the optimal pattern of its kind. In addition, you can switch on and off individu
Viking Strategy Signal Indicator
E Bahamlong Bagoudjare
5 (1)
Viking_Strategy_Signal Indicator is a solution I offer to beginner, amateur, and professional traders. My scalping robot :  https://www.mql5.com/fr/market/product/133191 By purchasing this indicator, you will first save time because it automatically analyzes the market based on Dow Theory and the Smart Money Concept (High (H), Low (L), Higher High (HH), Lower Low (LL), Break of Structure (BOS) to determine market structure and trend). It is built on my strategy, which relies on the NRTR theory t
SYSTEM INTRODUCTION:   The Binary Options Conqueror System Is Specifically Designed For Binary Options Trading. Unlike Other Systems And Indicators That Were Adopted From Other Trading Environments For Binary Options. Little Wonder Why Many Of Such Systems Fail To Make Money . Many End Up Loosing Money For Their Users.     Forward Testing Of The System Has Shown Remarkable Results . The Results Of Forward Testing On Live Trading Account Is Consistent With The Results Obtained By Back Testing .
El Oscilador de Índice de Precisión (Pi-Osc) de Roger Medcalf de Precision Trading Systems La versión 2 ha sido cuidadosamente recodificada para cargar rápidamente en su gráfico y se han incorporado algunas otras mejoras técnicas para mejorar la experiencia. El Pi-Osc fue creado para proporcionar señales precisas de temporización de operaciones diseñadas para encontrar puntos de agotamiento extremos, los puntos a los que los mercados se ven obligados a llegar solo para eliminar las órdenes de
SMCpro
Arief
5 (2)
Indicator USER MANUAL, trade setups, solving issues, etc :  Direct Download Here     ( for users only ) Hello World! Introducing.. SMCpro tool and Indicator for  MetaTrader 5 , a cutting-edge feature designed to revolutionize your trading experience. With innovative ICT Smart Money Concept, you gain unparalleled insight into market dynamics, empowering you to make informed trading decisions like never before. SMC Indicator built on the foundation of advanced algorithms and real-time dat
The   Gann Scalping Gold Indicator   is a robust technical analysis tool designed for precision trading in gold markets. It leverages Gann-based methodologies to identify key price levels, enabling traders to anticipate potential market reversals, breakouts, and areas of consolidation. Daily Reset Logic: Automatically resets touch statuses at the start of a new trading day, ensuring that the indicator aligns with fresh daily trends. How It Works: The indicator draws horizontal lines at predefine
Otros productos de este autor
¿Cuántas veces ha buscado un PIVOT que funcione en una vela específica cada día? A muchos operadores les gusta estimar la dirección de la tendencia del día basándose en un momento específico cada día, como 30 minutos después de la apertura del mercado, o a las 12 del mediodía, etc. Este indicador le permite especificar una hora determinada (hora y minuto) y traza un pivote desde esa hora hasta el día siguiente a la misma hora. Muestra cinco líneas basadas en esa hora/vela concreta: mediana, m
FREE
Keltner-Enhanced mejora la precisión y legibilidad de los Canales Keltner con muchas opciones para ajustarlos y más cinco cálculos de precios más allá del predeterminado META. El indicador Keltner-E es un indicador de bandas similar a las Bandas de Bollinger y a las Envolventes de Medias Móviles. Consisten en una envolvente superior por encima de una línea media y una envolvente inferior por debajo de la línea media.  Los principales acontecimientos a tener en cuenta al utilizar los canales d
FREE
El Jurik Advanced MA (JurMA) es un "non-repaint" indicador técnico desarrollado sobre el JMA original concebido por Mark Jurik.  Está diseñado para reducir el desfase presente en las medias móviles tradicionales, mejorar la suavidad y reducir el ruido. JurMA se adapta a la volatilidad del mercado y el usuario puede ajustar su sensibilidad, lo que lo hace útil para identificar tendencias y retrocesos en los mercados financieros. Esta adaptabilidad y eficacia lo hacen popular entre operadores y
Trend On Close
David Ben Svaiter
TrendOnClose es un sofisticado indicador diseñado para inversores en mercados binarios, centrado en el análisis estadístico de tendencias y contra-tendencias dentro de ciclos de velas específicos. Cada ciclo se define por el precio de CIERRE de la vela, estableciendo la dirección de la tendencia (ARRIBA/ABAJO - BULL/BEAR) para el posterior análisis estadístico hasta el inicio del siguiente ciclo. El análisis estadístico opera con dos configuraciones: ⦁ Objetivo Estadístico como VELA SUBSECUEN
HAshi-E es una forma mejorada de analizar las señales Heiken-Ashi. Información: Heiken-Ashi es especialmente valorado por su capacidad para filtrar la volatilidad a corto plazo, lo que lo convierte en una herramienta preferida para identificar y seguir tendencias, ayuda en la toma de decisiones sobre puntos de entrada y salida, y ayuda a distinguir entre señales falsas y auténticos cambios de tendencia. A diferencia de los gráficos de velas tradicionales, las velas Heiken-Ashi se calculan uti
Diseñado por Welles Wilder para gráficos diarios de materias primas, el ADXW es utilizado actualmente en diversos mercados por operadores técnicos para evaluar la fuerza de una tendencia o incluso una tendencia para operaciones a corto o largo plazo. El ADXW utiliza un indicador direccional positivo (DI+) y negativo (DI-) además de su línea de tendencia (ADX). Según Wilder, una tendencia tiene fuerza cuando la señal del ADX es superior a 25; la tendencia es débil (o el precio no tiene tendenc
El volumen en balance (OBV) es un indicador técnico que relaciona el volumen y el precio para identificar los movimientos de los precios. La idea básica detrás del OBV es que los cambios en el volumen generalmente preceden a los cambios en el precio. El indicador acumula volúmenes para los periodos en los que el precio cierra al alza y resta volúmenes para los periodos en los que el precio cierra a la baja. El resultado es un valor utilizado para identificar la dirección de la tendencia del act
En el ámbito del análisis técnico, ParbMA emerge como una herramienta altamente intuitiva para examinar la tendencia del Parabolic SAR. Este enfoque innovador aprovecha una línea personalizable, distinguida por su versatilidad en opciones de color, forma y anchura. Tal flexibilidad mejora el análisis visual y ayuda significativamente en la planificación estratégica y la toma de decisiones. El ParbMA (Media Móvil Parabólica) es un indicador técnico personalizado que combina los conceptos del Pa
Slow AMA
David Ben Svaiter
Compared to simple or exponential moving averages, slow adaptive trend lines might offer a more nuanced view of the trend by adjusting their sensitivity based on market conditions. However, their slow nature might also mean they are late in signaling reversals when market conditions change rapidly - and that is the difference between them and our SlowAMA . SlowAMA was designed to be a better long-term trend indicator than EMA and other Moving Averages. It uses our JurMA calculations, reducing
HAshi-E es una forma mejorada de analizar las señales Heiken-Ashi. Información: Heiken-Ashi es especialmente valorado por su capacidad para filtrar la volatilidad a corto plazo, lo que lo convierte en una herramienta preferida para identificar y seguir tendencias, ayuda en la toma de decisiones sobre puntos de entrada y salida, y ayuda a distinguir entre señales falsas y auténticos cambios de tendencia. A diferencia de los gráficos de velas tradicionales, las velas Heiken-Ashi se calculan uti
VIDYA Enhanced
David Ben Svaiter
El indicador VIDYA-ENHANCED (Promedio Dinámico de Índice Variable) es una herramienta de análisis técnico utilizada para identificar tendencias y movimientos laterales. Ajusta dinámicamente su sensibilidad en función de la volatilidad del mercado, utilizando el Chande Momentum Oscillator como índice de volatilidad. Esta característica permite a VIDYA-ENHANCED ser más ágil durante los periodos de movimientos significativos de los precios, permaneciendo más estable durante las fases menos voláti
Filtro:
Cinquini
38
Cinquini 2024.02.07 17:19 
 

El usuario no ha dejado ningún comentario para su valoración

Respuesta al comentario