AlphaWave
- Indicadores
- Simon Draxler
- Versión: 1.46
- Actualizado: 20 agosto 2024
- Activaciones: 10
Libera el Potencial de tus Operaciones con el Indicador AlphaWave!
Tranquilidad en tus Operaciones:
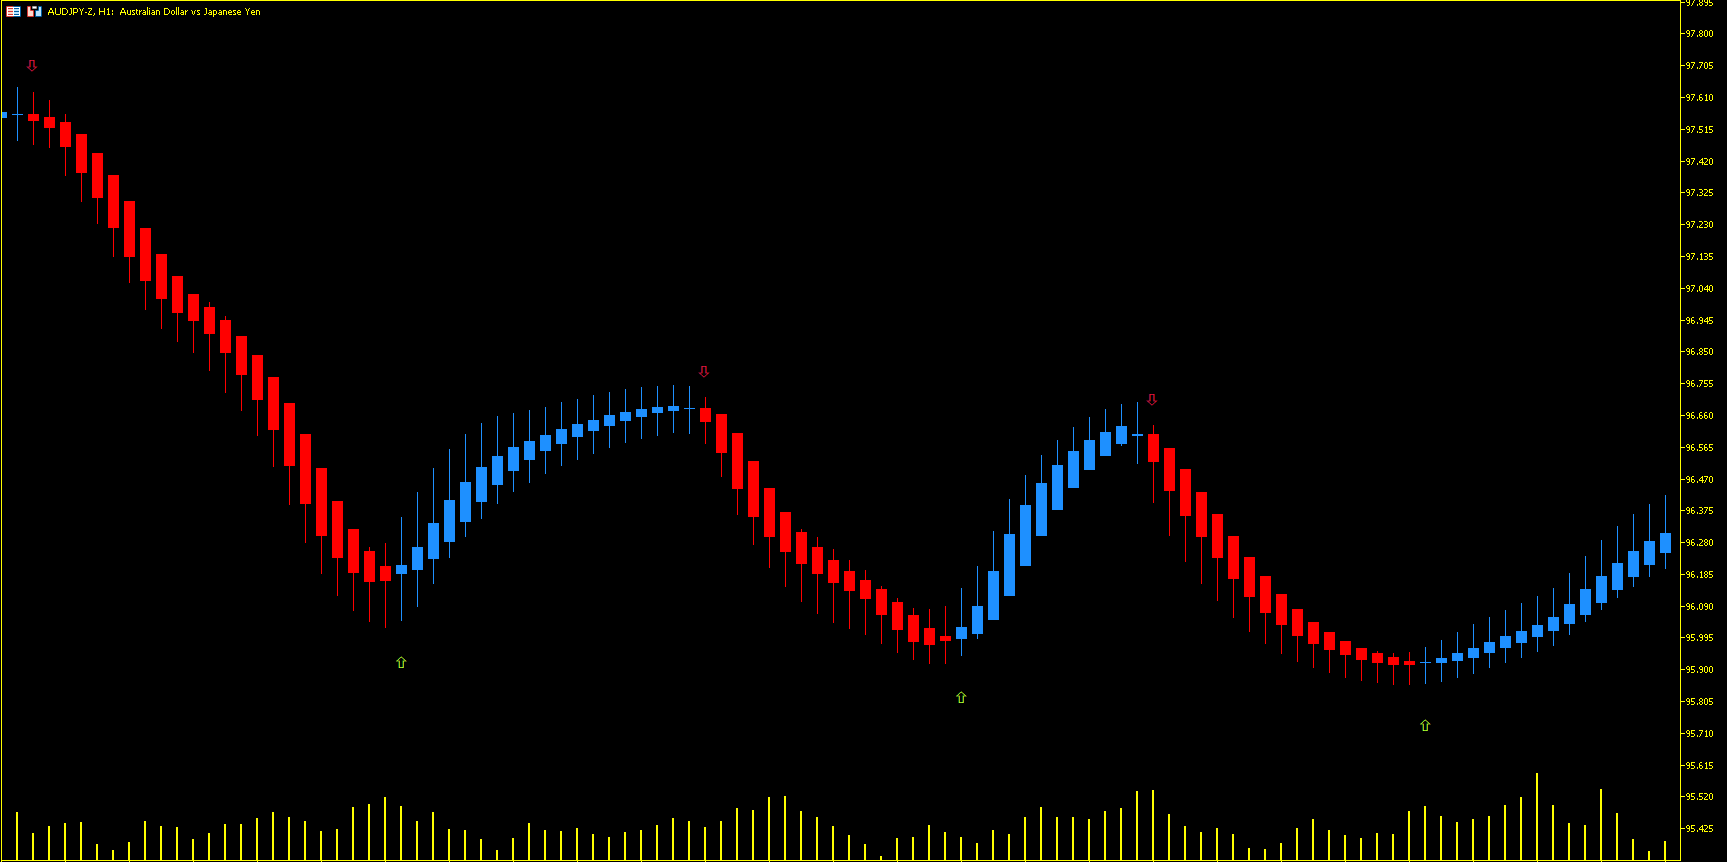
El Indicador AlphaWave ha sido diseñado para traer calma a tus operaciones, suavizando el gráfico y proporcionando una lectura precisa de la dirección de la tendencia. Nunca ha sido tan fácil tomar decisiones de operación claras.
Tecnología Revolucionaria de Suavizado con 10 Modos:
Experimenta una presentación de gráfico suave y clara con el Indicador AlphaWave. La tecnología revolucionaria de suavizado ofrece no solo uno, sino ¡10 modos para llevar tu experiencia de operación a un nuevo nivel! Elige el modo que mejor se adapte a tu estilo de operación.
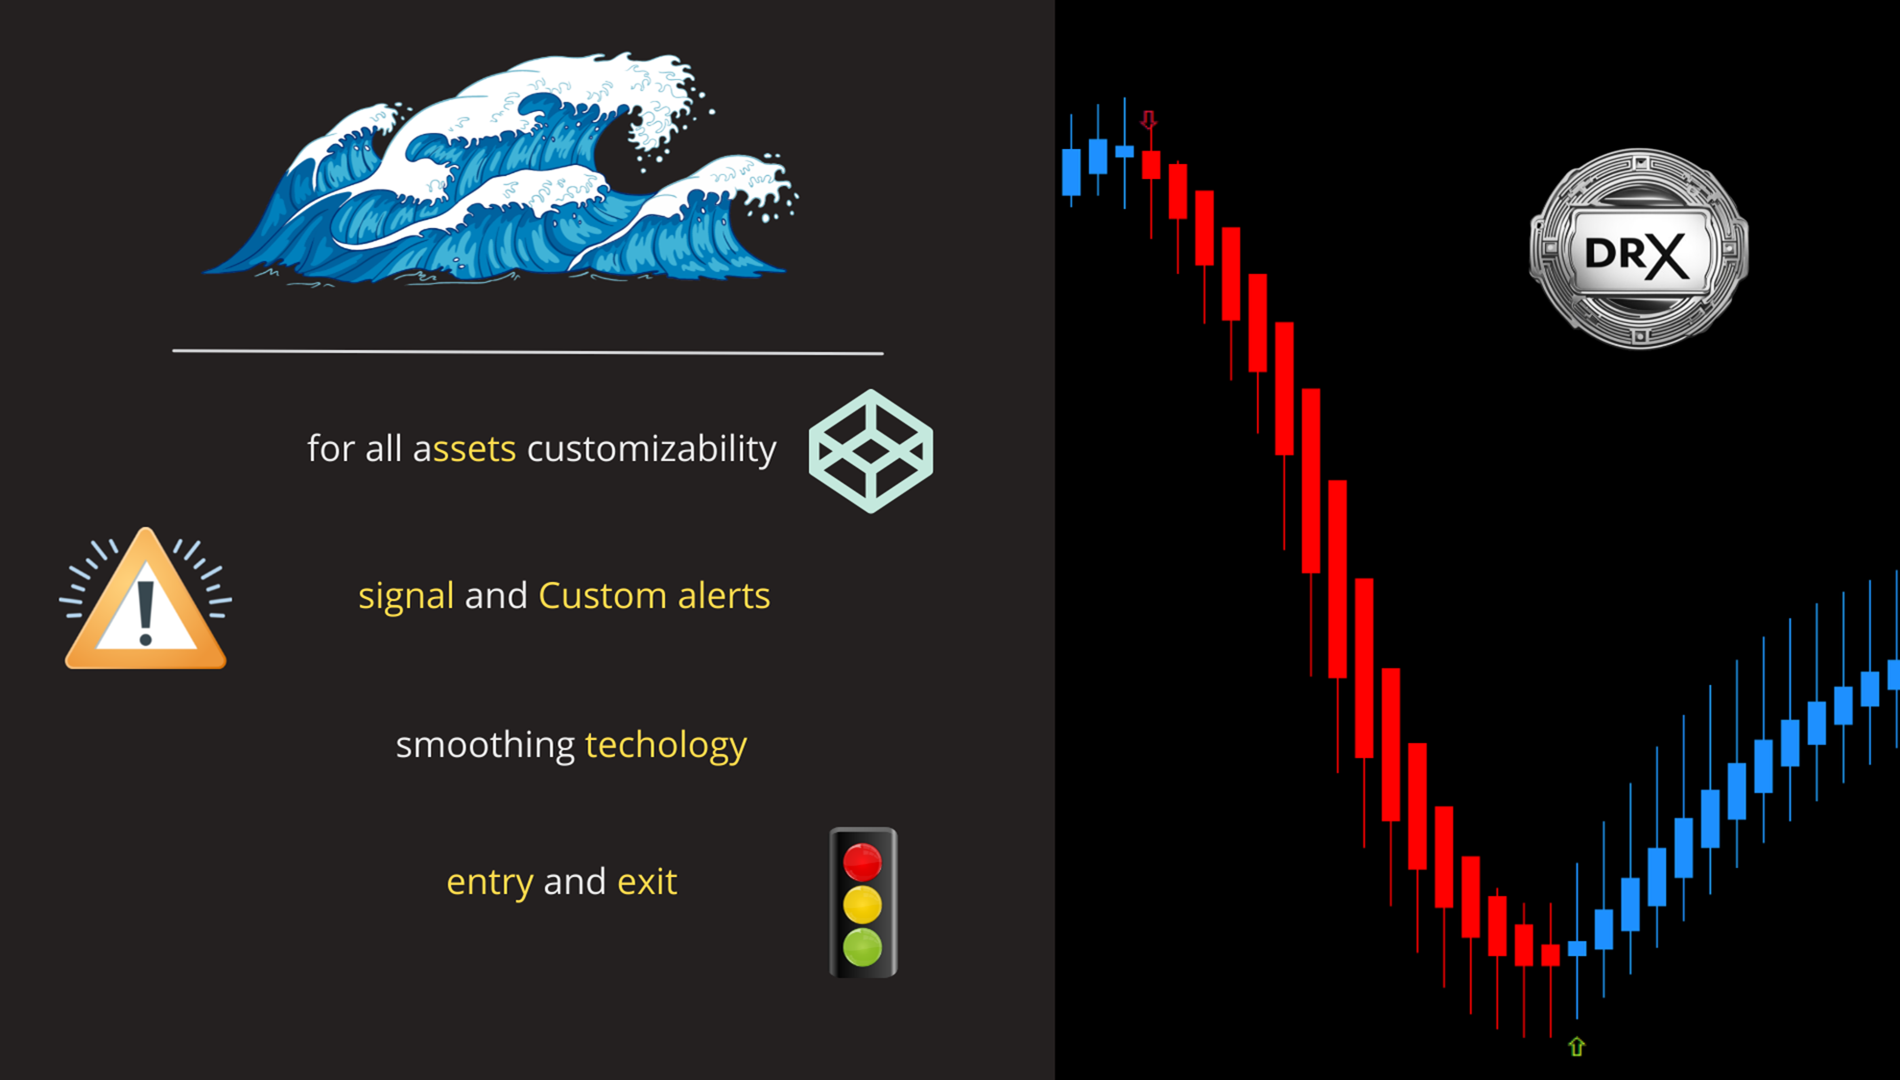
Adaptabilidad para Cualquier Activo:
El Indicador AlphaWave se adapta perfectamente a cualquier activo, facilitando aplicaciones versátiles y brindándote soporte en diversos mercados. Libera el potencial en cualquier instrumento de operación.
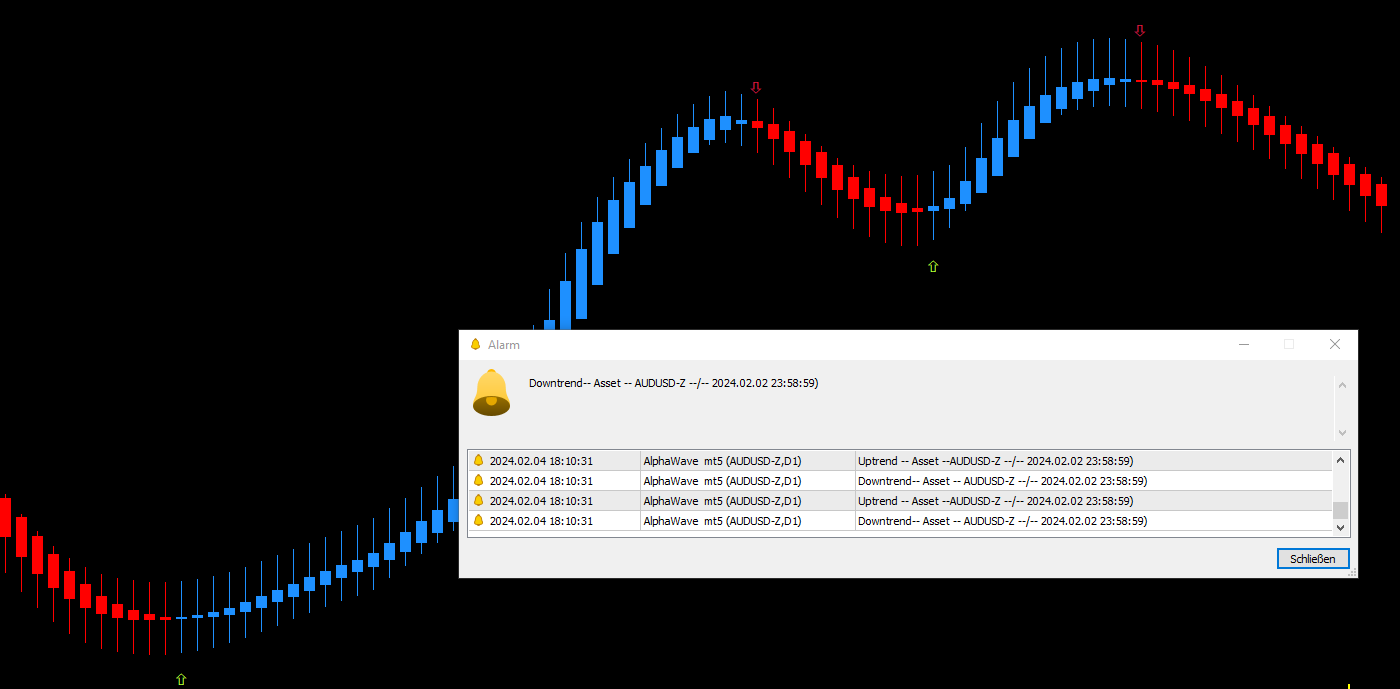
Alarma Personalizada para Tendencias Alcistas y Bajistas:
¡Disfruta del gran extra! El Indicador AlphaWave ofrece alarmas personalizadas para tendencias alcistas y bajistas. Nunca vuelvas a perder momentos cruciales de operación y opera con confianza.
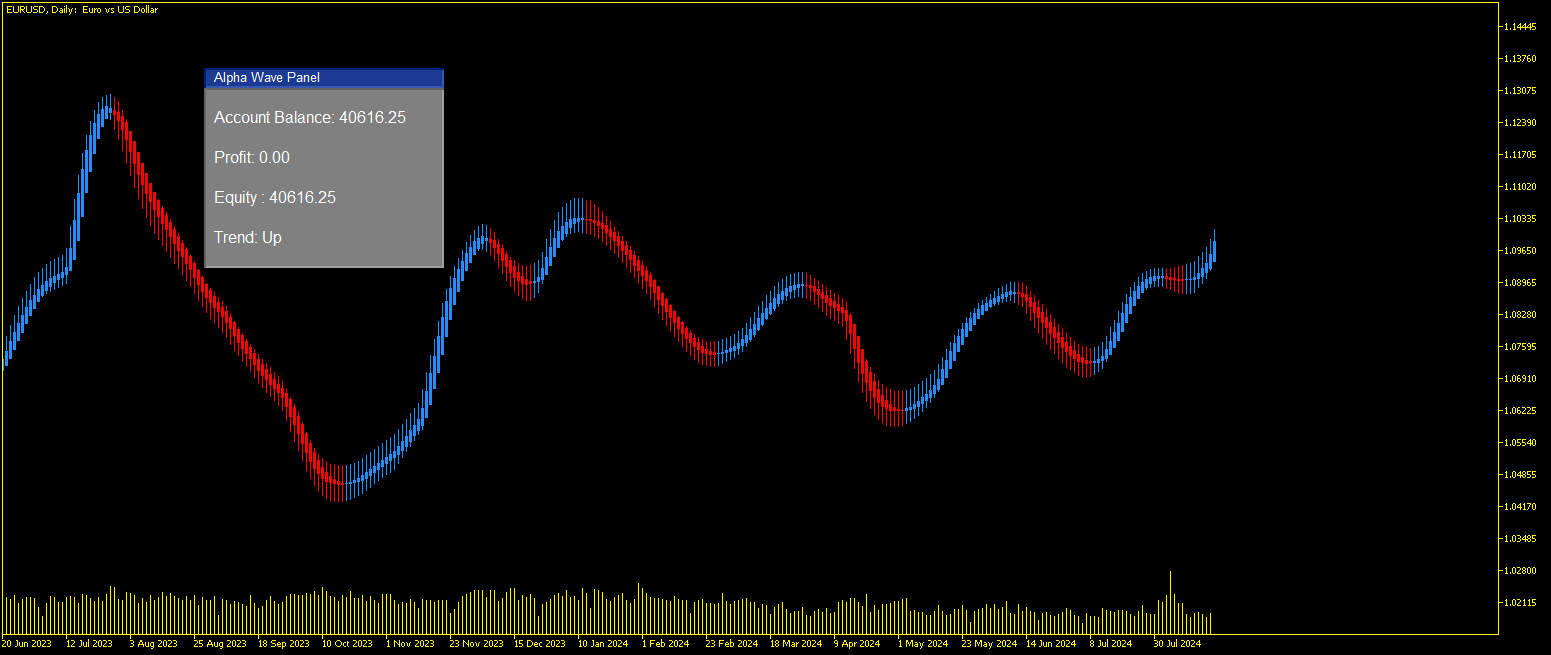
Inspiración Innovadora de Heiken-Ashi:
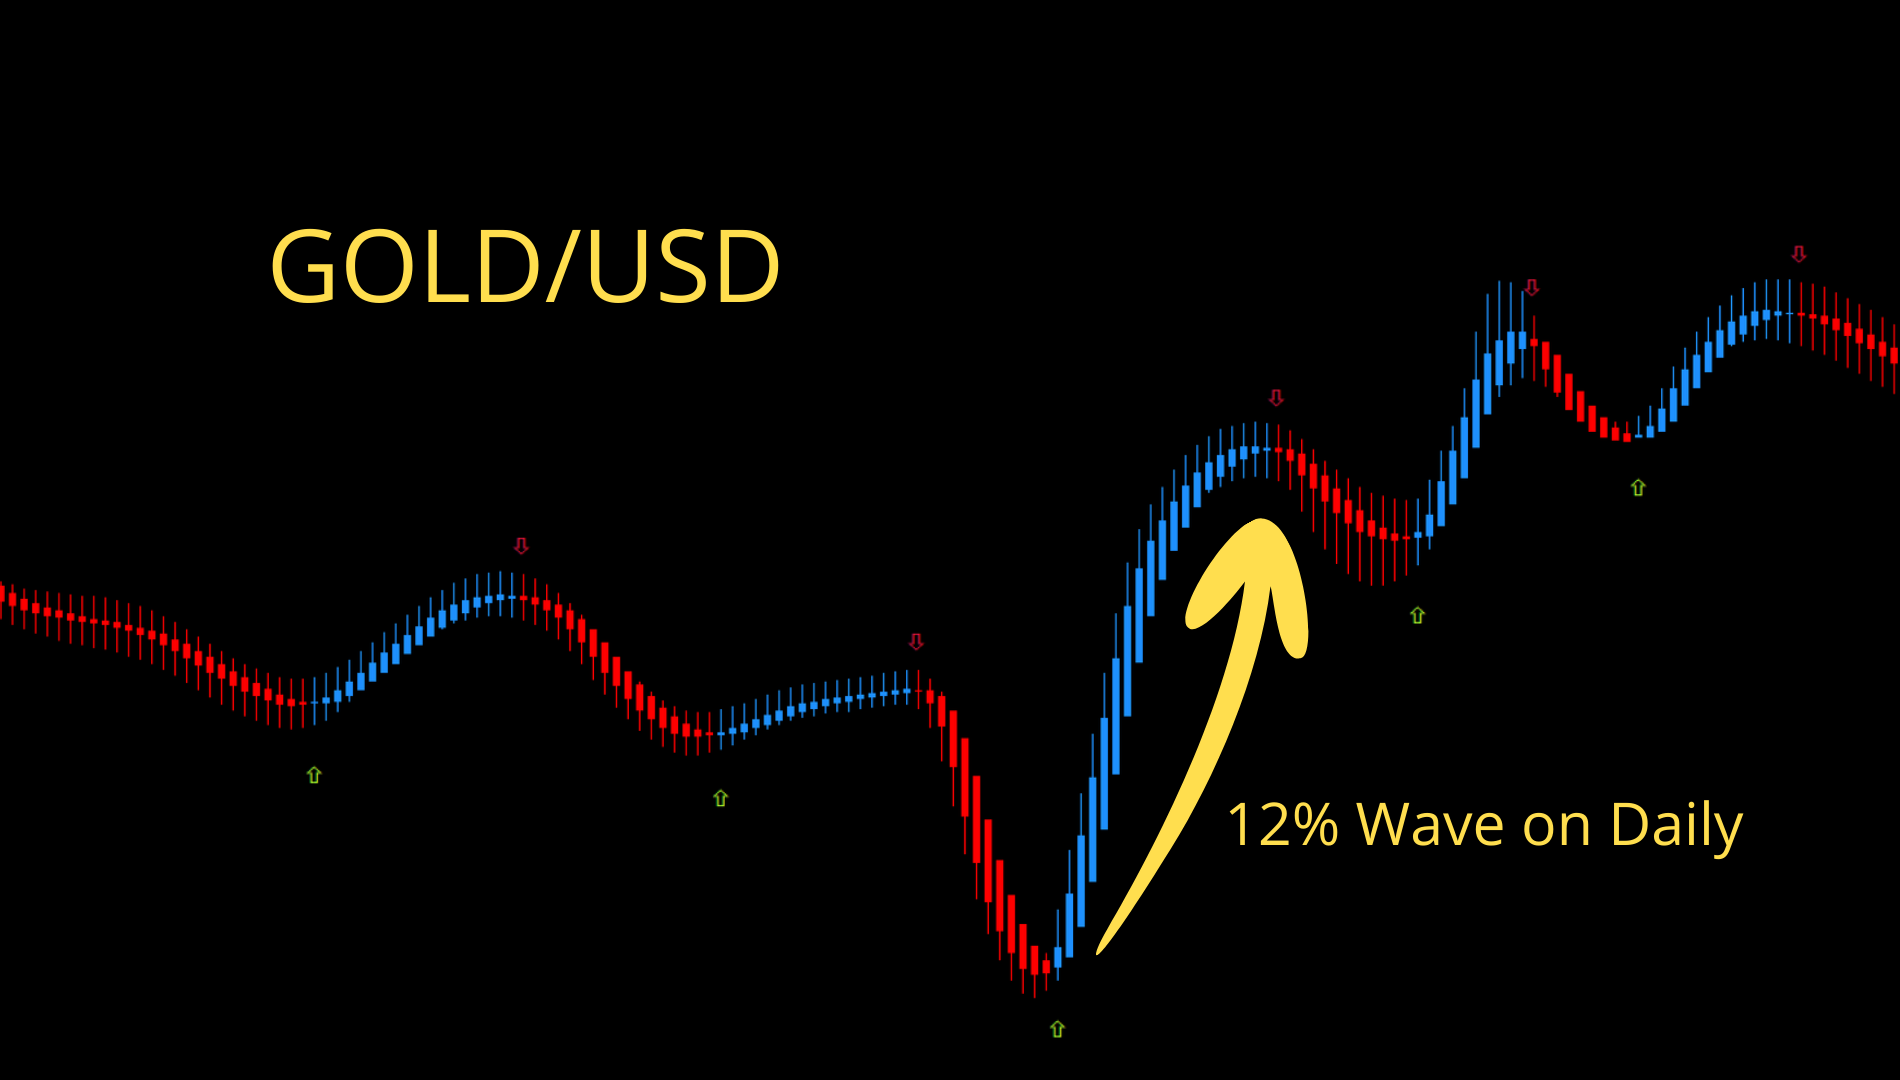
Inspirado en las velas Heiken-Ashi, el Indicador AlphaWave se basa en una fórmula innovadora. Los datos tradicionales de las velas se transforman en barras de colores, mostrando direcciones claras de tendencia. ¡Un avance tecnológico en tus operaciones!
Puntos Precisos de Entrada y Salida:
Gracias a señales confiables e indicadores precisos de tendencia, el Indicador AlphaWave te permite identificar puntos de entrada y salida óptimos.
Soporte Continuo y Actualizaciones:
No solo ofrecemos un excelente software, sino también soporte continuo. Estamos aquí para responder a cualquier pregunta o necesidad que puedas tener.
Elige ahora el Indicador AlphaWave y experimenta una nueva dimensión en tus operaciones.
Uso Recomendado en Marcos de Tiempo Superiores.
Para un uso óptimo, puedes descargar el archivo de plantilla o recibirlo por correo electrónico.
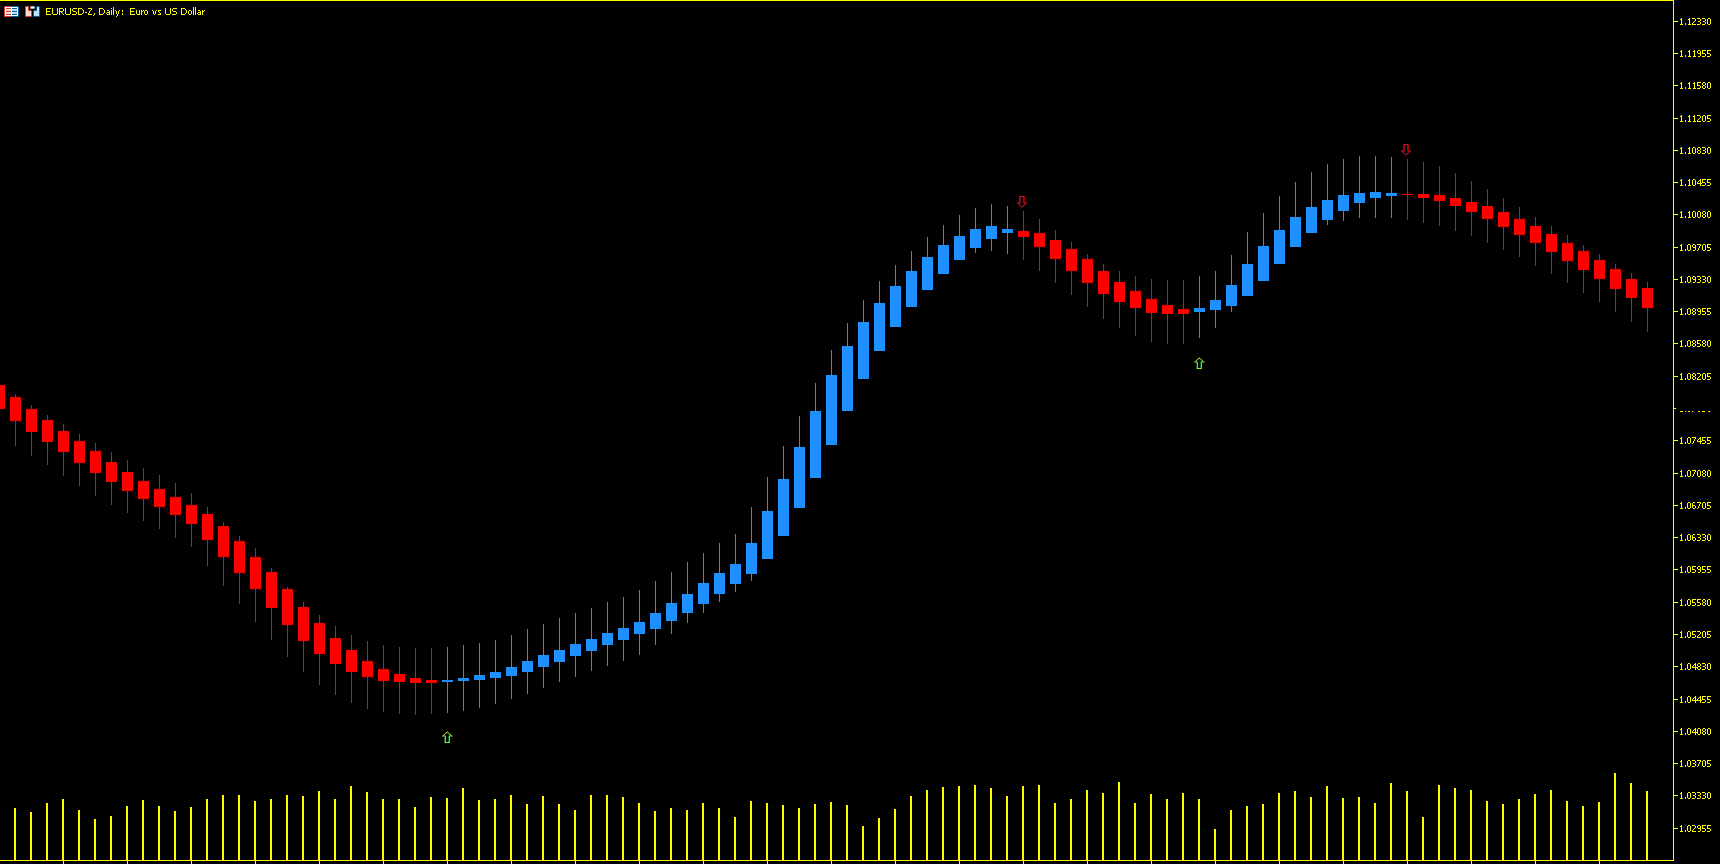

Dieser Indikator hat mich sehr beeindruckt. Sehr gute Arbeit, Signale im D1 kommen punktgenau.