Market Cycle and Trading Sessions
- Indicadores
- Maximiliano Frisione Figueroa
- Versión: 1.0
Indicador de Ciclo de Mercado y Sesiones de Trading
Presentamos nuestro Indicador de Ciclo de Mercado y Sesiones de Trading, una herramienta diseñada para brindarte una visión completa del mercado financiero como nunca antes.
Observa el pulso del mercado con nuestro exclusivo indicador.
Obtén una comprensión profunda de las fases del mercado, desde la acumulación hasta la distribución, para tomar decisiones informadas, estratégicas y con alta probabilidad.
¿Qué hace nuestro indicador?
1. Rango de fechas para los cálculos:
Posibilidad de personalizar la fecha de inicio y la fecha de fin donde el indicador graficará el ciclo, esto le permitirá enfocarse en el período que desee analizar.
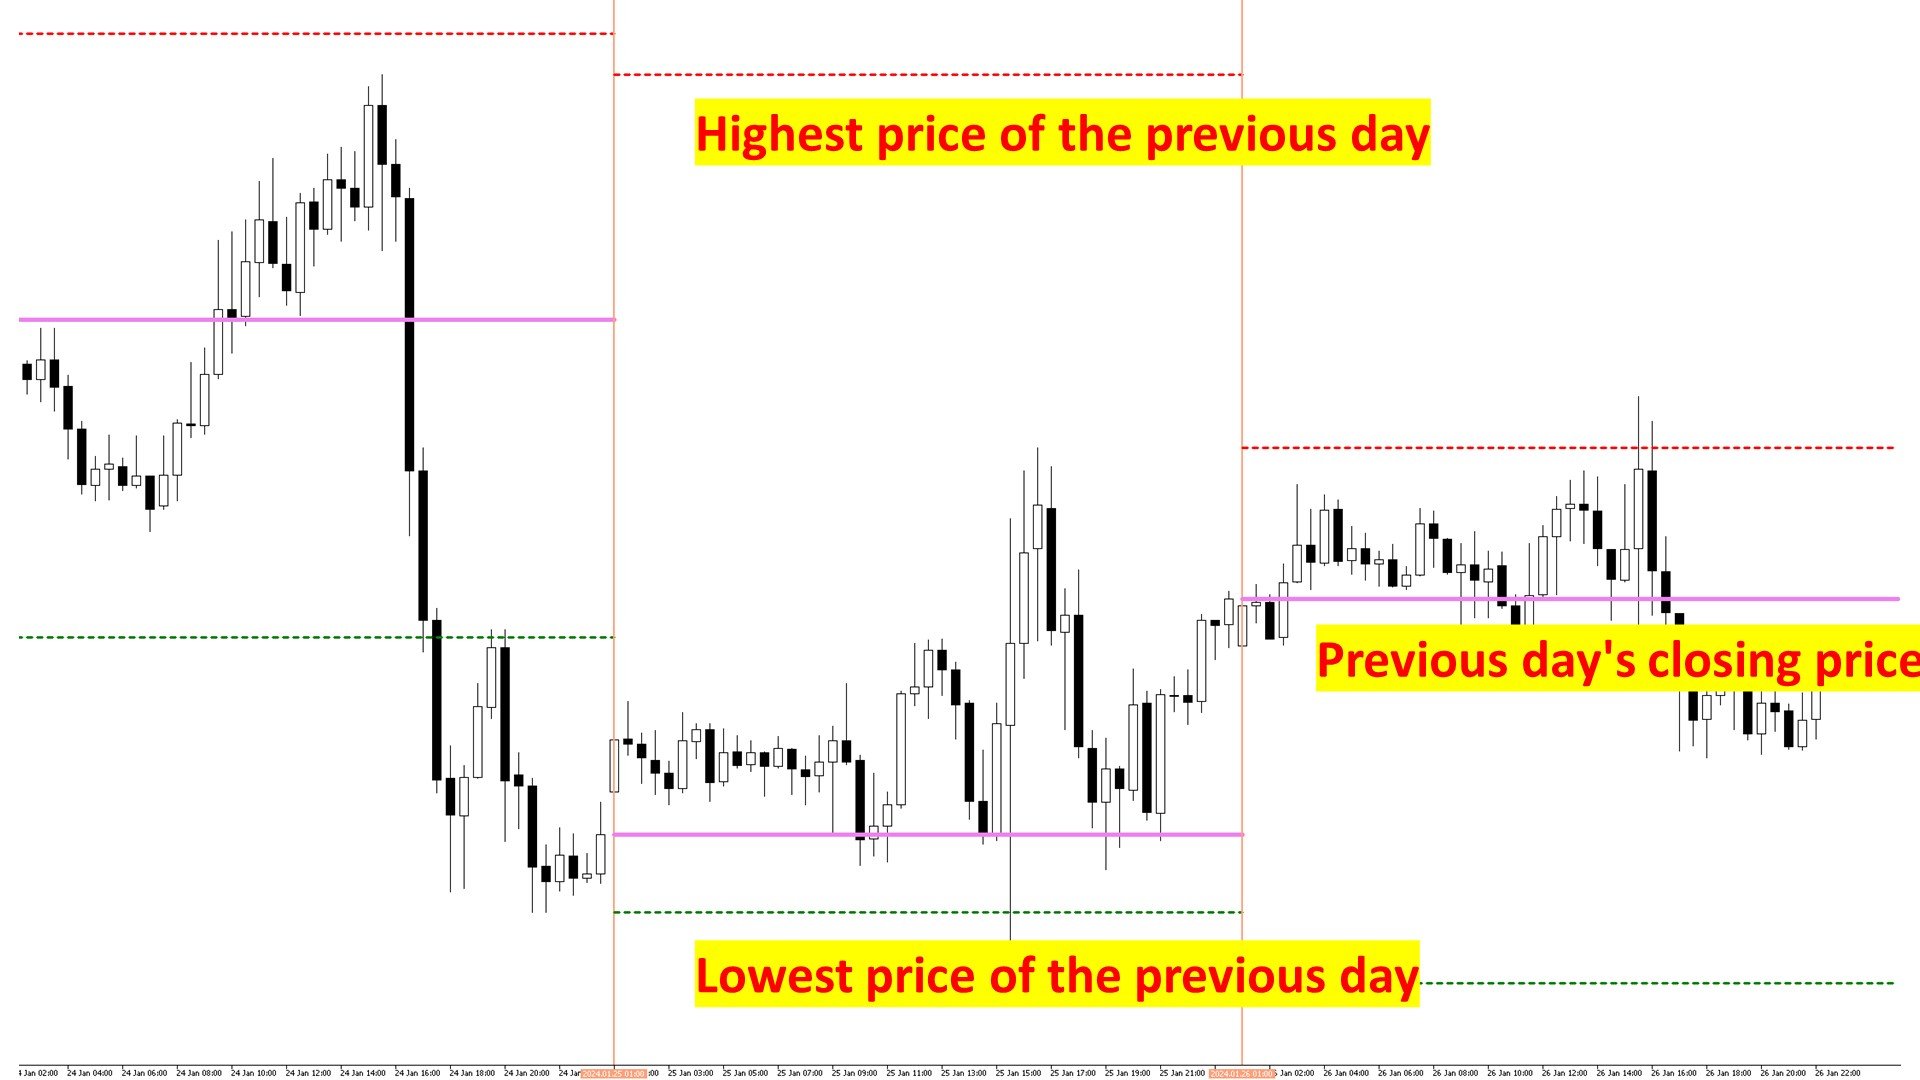
2. Separador de días de trading:
Visualiza de manera clara y precisa cada jornada del mercado, permitiéndote identificar patrones y tendencias con facilidad.
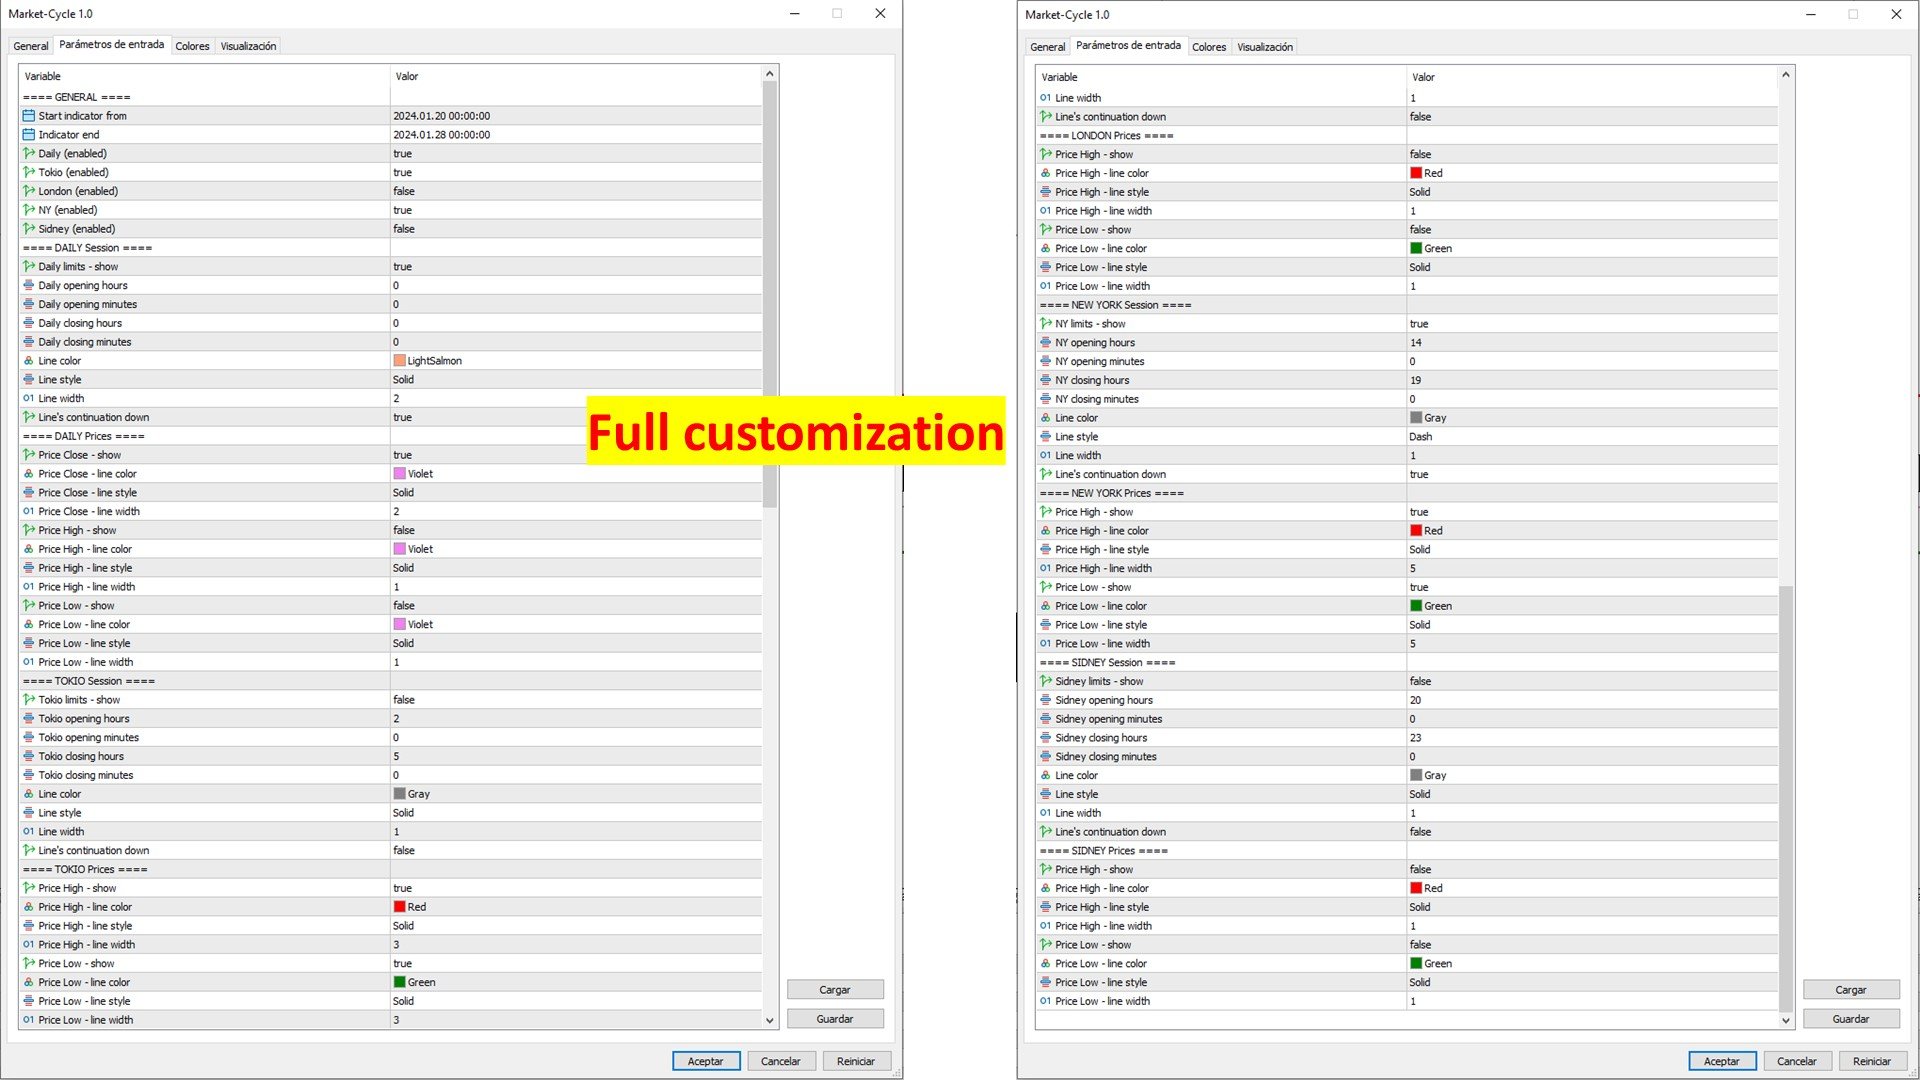
Personalización completa. (visualización y diseño)
Posibilidad de extender el precio de cierre, el más alto y el más bajo del día al día siguiente
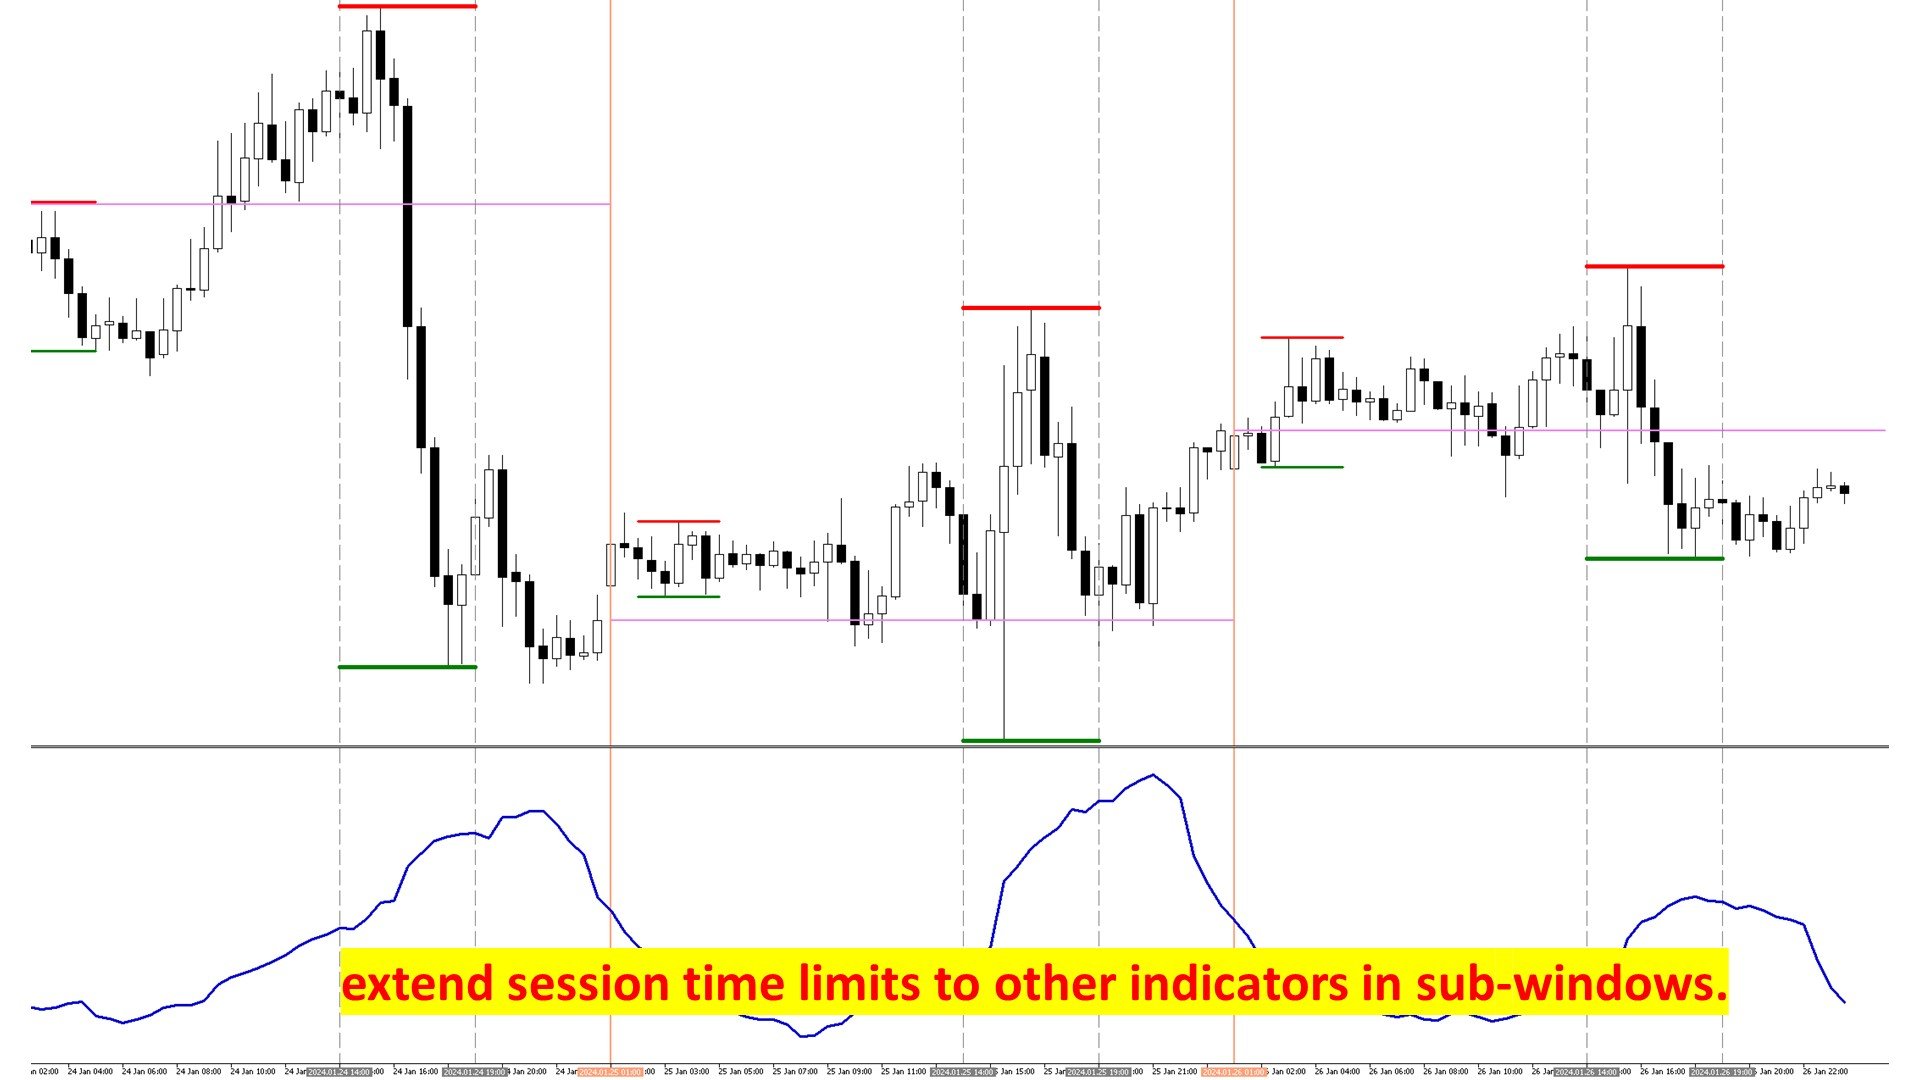
Posibilidad de extender la separación a otros indicadores que tengas en sub-ventanas.
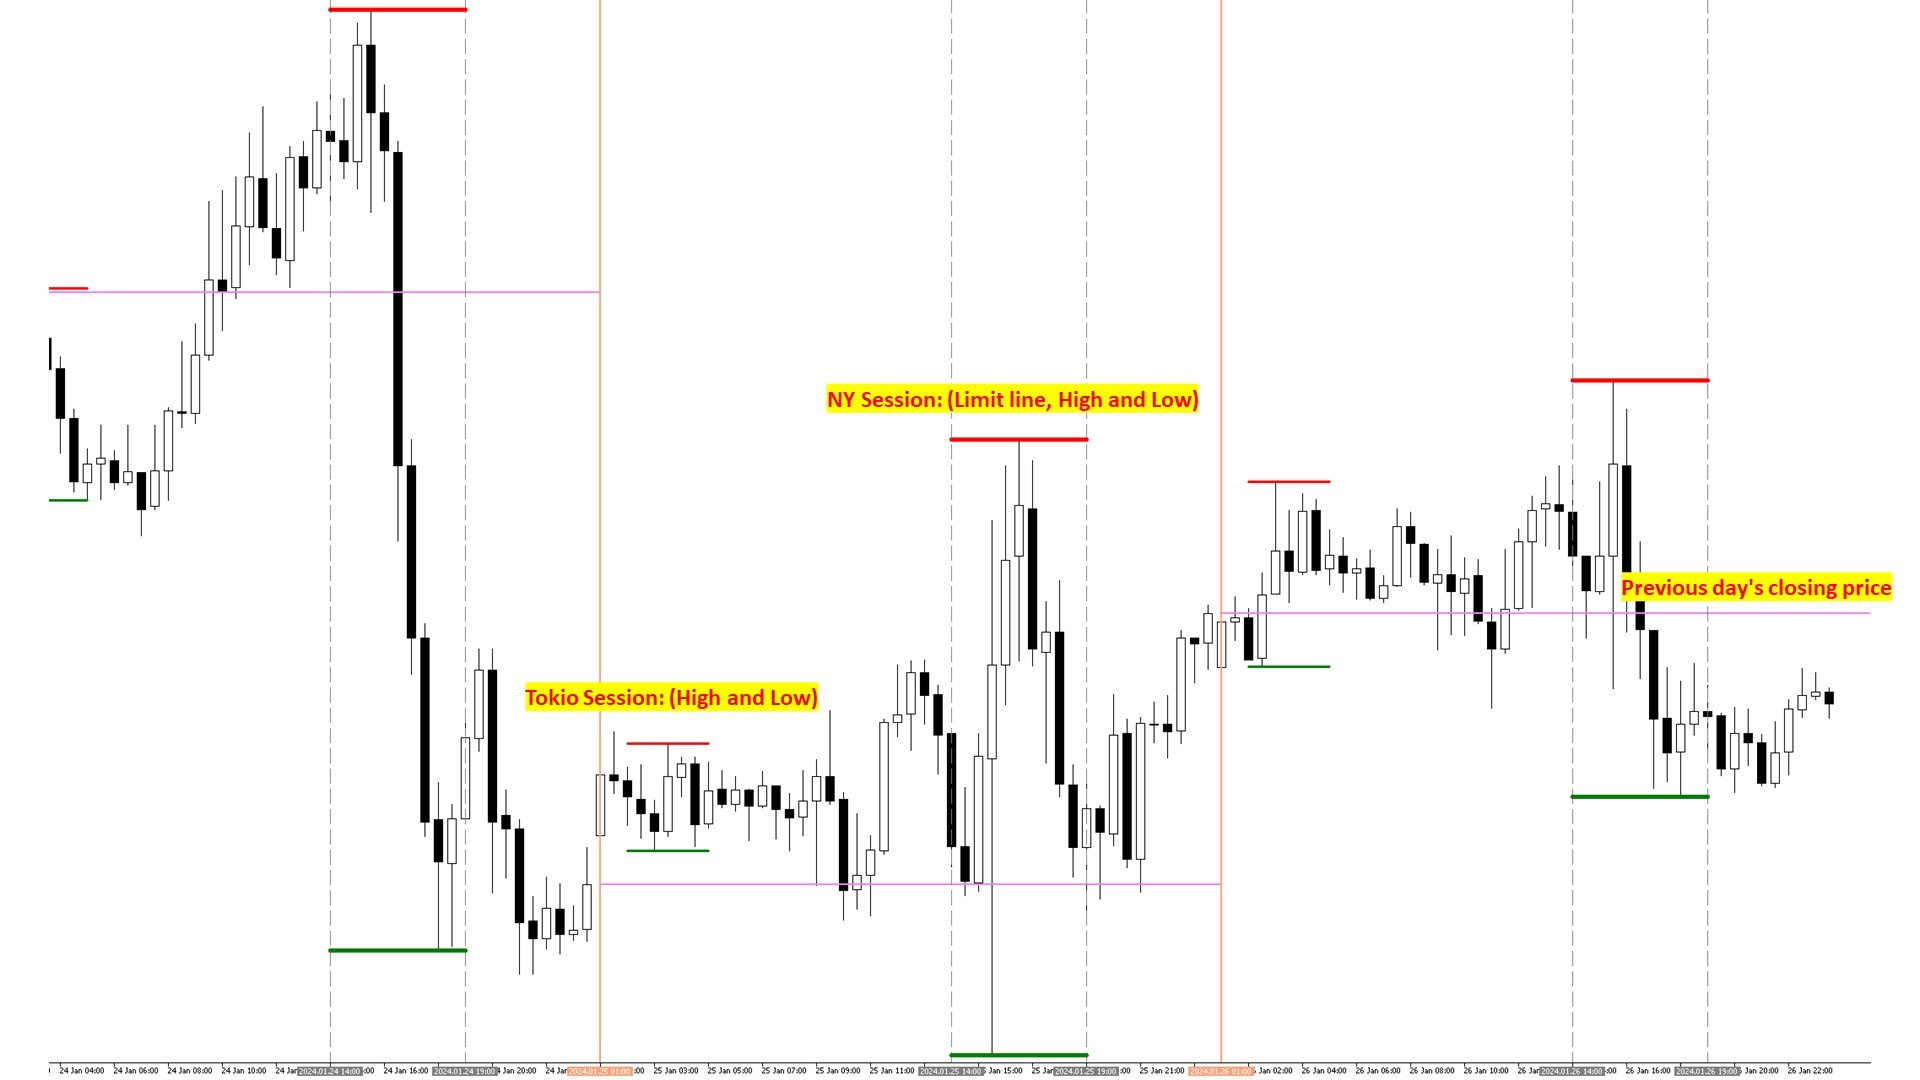
3. Personalización por Sesiones de Trading:
Adapta tu estrategia a las condiciones específicas del mercado en cada sesión. Personaliza las cuatro sesiones principales (Tokio, Londres, Nueva York y Sídney) según tus preferencias y estrategias de trading.
Para cada sesión ofrecemos:
Personalización completa. (visualización y diseño)
Posibilidad de mostrar el precio más alto y el más bajo de la sesión.
Posibilidad de extender los límites horario de la sesión a otros indicadores que tengas en sub-ventanas.
4. Intuitivo y Fácil de Usar:
Nuestro indicador ha sido diseñado pensando en la facilidad de uso. Con una interfaz intuitiva, incluso los traders principiantes pueden aprovechar al máximo sus funciones avanzadas.
¿Por qué elegir nuestro Indicador?
Precisión Probada:
Desarrollado con calidad y probado exhaustivamente.
Soporte Continuo:
Ofrecemos un servicio de soporte para resolver cualquier duda o inconveniente.
Actualizaciones Gratuitas:
Como parte de nuestra promesa de mejora continua, recibirás actualizaciones gratuitas que incorporarán nuevas características y mejoras basadas en la retroalimentación de nuestra comunidad de usuarios. ¿Tienes alguna mejora, alguna necesidad extra? NO dudes en contactarnos!