• Información general
  • Comentarios
  • Discusión

ParbMA The Most Intuitive Parabolic SAR

En el ámbito del análisis técnico, ParbMA emerge como una herramienta altamente intuitiva para examinar la tendencia del Parabolic SAR. Este enfoque innovador aprovecha una línea personalizable, distinguida por su versatilidad en opciones de color, forma y anchura. Tal flexibilidad mejora el análisis visual y ayuda significativamente en la planificación estratégica y la toma de decisiones.

El ParbMA (Media Móvil Parabólica) es un indicador técnico personalizado que combina los conceptos del Parabolic SAR (Stop and Reverse) de J. Welles Wilder y una Media Móvil. Este indicador híbrido está diseñado para proporcionar a los traders una herramienta que capture los beneficios de ambas metodologías, ofreciendo una forma única de rastrear tendencias de precios y posibles puntos de reversión en los mercados financieros.

Características clave de ParbMA

Representación visual personalizable: En el núcleo de ParbMA está su capacidad para representar tendencias mediante una línea. Los usuarios pueden adaptar esta línea según sus preferencias, eligiendo entre una variedad de colores, formas y anchuras. Este nivel de personalización asegura que la representación de la tendencia se alinee perfectamente con el estilo y los requisitos analíticos del usuario.

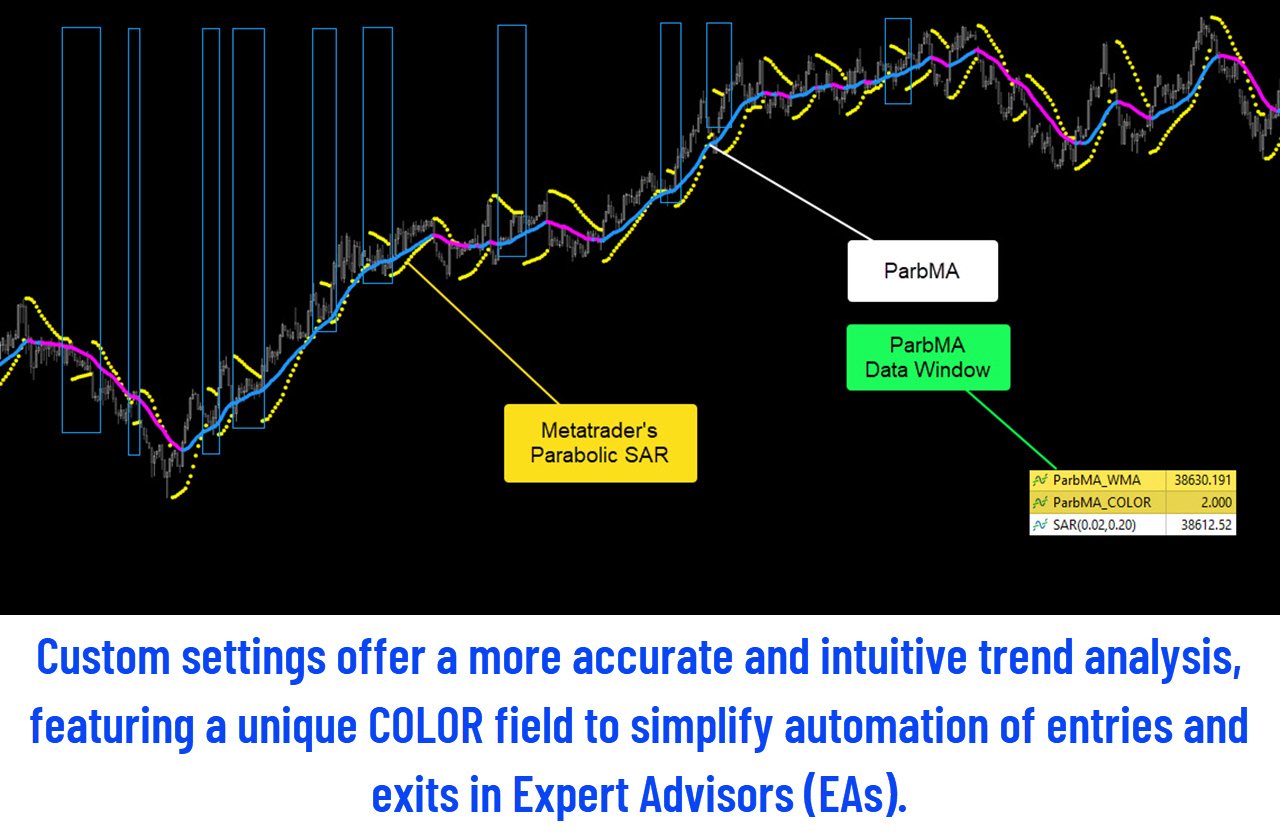
Fácil integración con Asesores Expertos (EAs): La utilidad de ParbMA se extiende al ámbito de los Asesores Expertos, ofreciendo una ventaja distintiva para estrategias de trading automatizadas respaldadas por Parabolic SAR: la inclusión de un "campo de color" que simplifica la implementación de una estrategia basada en cambios de color de tendencia. Al proporcionar un sistema codificado por colores fácil de interpretar, ParbMA permite a los programadores identificar cambios en las tendencias y ajustar rápidamente su estrategia. Esta integración fluida y eficiente mejora las capacidades de los Asesores Expertos en el análisis de tendencias.

ParbMA se destaca como una herramienta completa y fácil de usar para analizar la tendencia del Parabolic SAR. Su combinación de elementos visuales personalizables y la innovadora función de campo de color lo convierte en un activo invaluable tanto para traders manuales como para aquellos que utilizan Asesores Expertos. Al simplificar y mejorar el proceso de análisis de tendencias, ParbMA allana el camino para estrategias de trading más eficientes y efectivas.

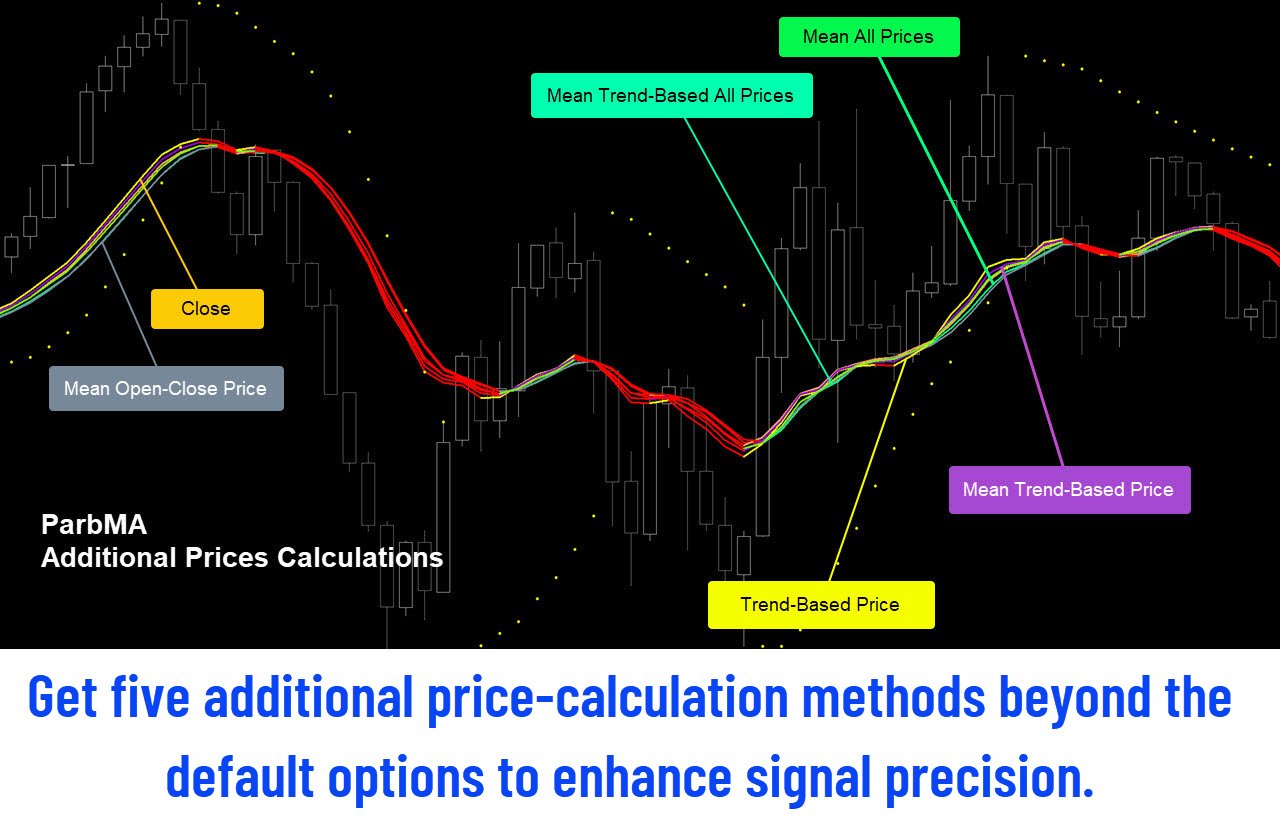
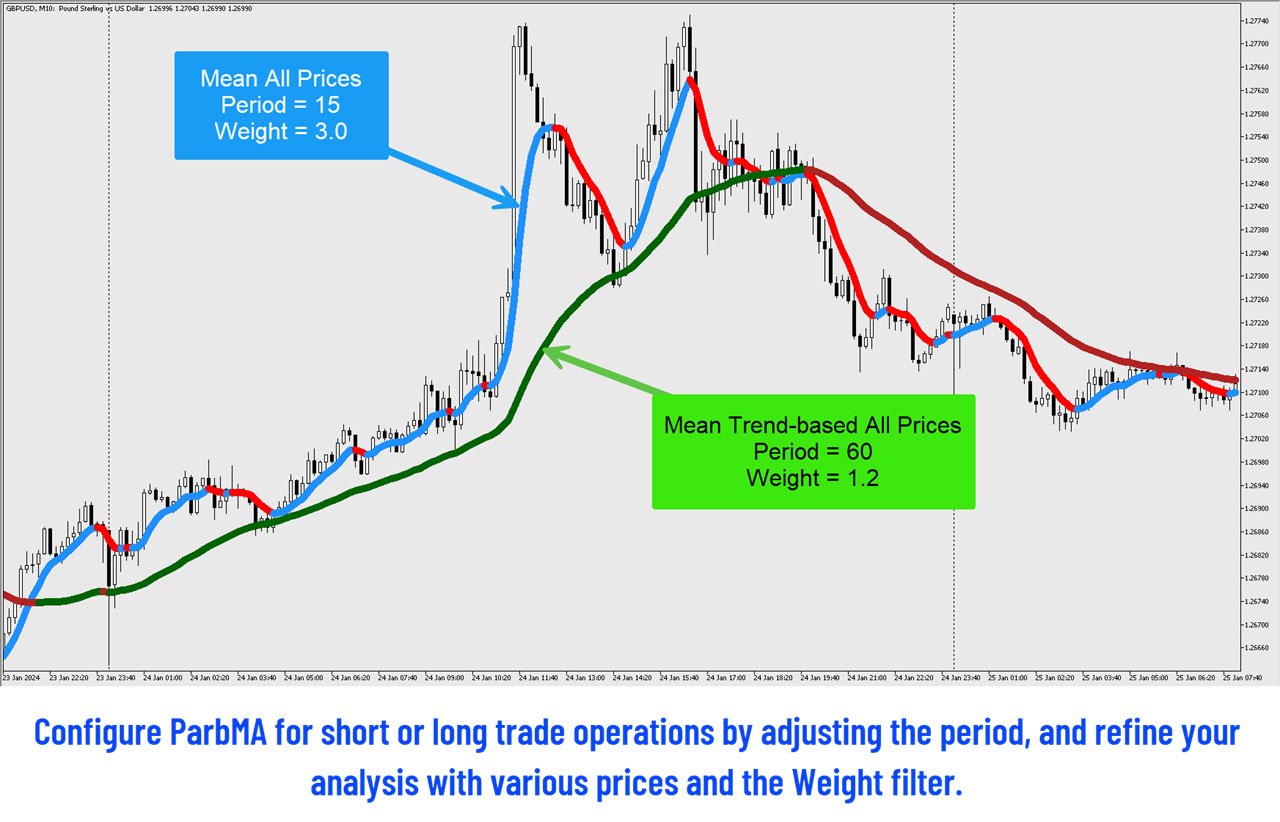
Además, ParbMA ofrece una variedad de opciones de precios para cálculos que complementan los cálculos de precios estándar inherentes a la plataforma MetaTrader:
  • Predeterminado de MetaTrader (Cierre, Apertura, Máximo, Mínimo, Mediana, Típico, Ponderado);
  • Promedio Apertura-Cierre;
  • Promedio de Todas las Precios;
  • Basado en la Tendencia (Alto para vela alcista, Bajo para vela bajista, Cierre en otro caso);
  • Promedio Basado en la Tendencia;
  • Promedio Ponderado de Todas las Precios Basado en la Tendencia.
Características
  • Indicador Parabolic-SAR basado en línea y no repintado, optimizando la identificación de paradas y reversos en las tendencias.
  • Enfoque exclusivo de MA para mejorar Parabolic-SAR en operaciones a corto y largo plazo.
  • Línea exclusiva de 2 colores para una visualización más fácil y rápida de Parabolic-SAR.
  • Campo de datos COLOR exclusivo para usar en EA, facilitando la adaptación de estrategias heredadas a una operación más rápida.
  • Parámetros PERIOD y WEIGHT para una personalización total para cualquier activo y marco de tiempo.
  • Cálculo de promedio más rápido que iMA() y otros indicadores técnicos de MetaTrader.
  • 12 cálculos de precios diferentes (7 predeterminados de MetaTrader + 5 cálculos personalizados).
  • Permite cambiar libremente el estilo, color y ancho de su línea.
  • Puede utilizarse con cualquier ACTIVO y MARCO DE TIEMPO.
  • Acepta su incorporación en "Asesor Experto" a través de la llamada iCUSTOM.


Productos recomendados
The SuperTrend MTF indicator is an excellent trend tracking indicator . It can not only display SuperTrend trends within the timeframe of the chart, but also set up to display SuperTrend trends for larger time frames simultaneously . This will be beneficial for grasping trends at a larger time scale and predicting future trends . At the same time, the price of the trend line can also be displayed at a glance, making it easy to observe. Input parameters :  ATR period used at chart timeframe   
Ichimoku MTF
Hoang Ngoc Thach
MTF Ichimoku is a MetaTrader 5 indicator based on well known Ichimoku. In MetaTrader 5 we have Ichimoku already included as a standard technical indicator. However it can be used only for the current timeframe. When we are looking for a trend, it is very desirable to have Ichimokuis showing higher timeframes. MTF Ichimoku presented here has additional parameter - TimeFrame. You can use it to set up higher timeframe from which Ichimokuis will calculate its values. Other basic parameters are not c
Bober Real MT5
Arnold Bobrinskii
4.76 (17)
Bober Real MT5 is a fully automatic Forex trading Expert Advisor. This robot was made in 2014 year and did a lot of profitbale trades during this period. So far over 7000% growth on my personal account. There was many updates but 2019 update is the best one. The robot can run on any instrument, but the results are better with EURGBP, GBPUSD, on the M5 timeframe. Robot doesn't show good results in tester or live account if you run incorrect sets. Set files for Live accounts availible only for cu
Trend Direction ADX indicator Trend Direction ADX is part of a serie of indicators used to characterize market conditions. Almost any strategy only work under certain market conditions. Therefore it is important to be able to characterize market conditions at any time: trend direction, trend strength, volatility, etc.. Trend Direction ADX is an indicator to be used to characterize trend direction: trending up trending down ranging Trend Direction ADX is based on ADX standard indicator. Tre
Golden Spike Premium
Kwaku Bondzie Ghartey
Golden Spikes Detector Acknowledgement and Dedications:  The name of this indicator was Inspired by an Original; Mr Grant Koopman; a Knowledgeable and experienced Synthetics trader. I dedicate this indicator to Mr Grant.  Overview:   The Golden Spikes Premium is a groundbreaking trading indicator meticulously crafted for the Boom and Crash indices on the Deriv market. Tailored to meet the needs of discerning traders, this powerful tool operates exclusively on the one-minute timeframe, providing
Boom and Crash Sniper Spike Detector - Boom 1000 The Boom and Crash Sniper Spike Detector is the ultimate tool for spike trading on Boom 1000, offering clear and reliable signals to help you capture high-probability trades. This advanced indicator is designed to enhance your trading strategy by simplifying spike detection and maximizing your profits. Key Features: Multi-Timeframe Compatibility : The indicator can be used on M1, M5, M15, M30, and H1 timeframes, but it works best on the M1 timefra
Meet the Tweezer Hunter, an essential tool for every Forex trader looking to make accurate, trend-following trades. This powerful, intuitive indicator helps traders spot potential trend reversals before they happen, providing a significant advantage in the fast-paced world of Forex trading. The Tweezer Hunter is more than your average tweezer candle indicator; it's designed with a built-in trend identification feature that accurately detects whether the market is bearish or bullish. By integrat
This is Multiple Timeframe of Malaysia SNR Levels and Storyline. The single timeframe version here Features: + Display level on multiple timeframe (higher or lower) + Turn on/off level on timeframe + Alert when price touch level 1. if high > resistance level but close of candle < resistance level , this level become unfresh - Name of level will have "(m)" meaning mitigated if close of candle > resistance level , this level become invalid and can be removed in chart (there is setting for keep/rem
Contact me for instruction, any questions! Introduction V Bottoms and Tops are popular   chart patterns   among traders due to their potential for identifying trend reversals. These patterns are characterized by sharp and sudden price movements, creating a V-shaped or inverted V-shaped formation on the   chart . By recognizing these patterns, traders can anticipate potential shifts in market direction and position themselves accordingly.  V pattern is a powerful bullish/bearish reversal pattern
Divergence MACD indicator shows price and MACD indicator divergence. The indicator is not redrawn! The algorithm for detection of price and MACD extremums has been balanced for the earliest entry allowing you to use the smallest SL order possible. The indicator displays all types of divergences including the hidden one, while having the minimum number of settings. Find out more about the divergence types in Comments tab. Launch settings: Max Bars - number of bars calculated on the chart. Indent
GENERAL OVERVIEW Introducing our new KDE Optimized RSI Indicator! This indicator adds a new aspect to the well-known RSI indicator, with the help of the KDE (Kernel Density Estimation) algorithm, estimates the probability of a candlestick will be a pivot or not. For more information about the process, please check the "HOW DOES IT WORK ?" section. Features of the new KDE Optimized RSI Indicator : A New Approach To Pivot Detection Customizable KDE Algorithm Realtime RSI & KDE Dashboard Alert
SignalArrow
Pavel Krysanov
El objetivo principal del indicador es determinar los momentos de entrada y salida de las transacciones, por lo que ExactArrow no dibuja nada más que flechas que muestran los lugares para entrar y salir del mercado. A pesar de la aparente simplicidad del indicador, en su interior hay algoritmos analíticos complejos, con la ayuda de los cuales el sistema determina los momentos de entrada y salida. El indicador da señales precisas y oportunas para entrar y salir de una operación que aparecen en
ATR Line
Evgeny Levchenko
El indicador - "Línea ATR" determina la tendencia actual y da señales para comprar (flecha verde hacia arriba) o vender (flecha roja hacia abajo). El cálculo del indicador se basa en la desviación del precio promedio del instrumento de su rango real promedio: ATR. La media móvil de precios se utiliza para reducir el "ruido del mercado". Si la línea principal del indicador - "Línea ATR" es más baja en el gráfico de precios del instrumento, entonces el mercado está en una tendencia "alcista". Si l
Marcon s Deviation
Luiz Antonio De Sousa Marcon
DESVIO DE MARCON  (Desvio Dinâmico de VWAP) O Desvio de Marcon é um indicador desenvolvido com o intuito de fornecer ao TRADER uma ferramenta capaz de antecipar pontos relevantes de suporte e resistência através de canais de desvios de VWAP traçados no gráfico.  Mas qual a diferença entre o Desvio de Marcon e os canais de desvio padrão da VWAP já existentes? O Desvio de Marcon utiliza um algoritmo estatístico desenvolvido por Luiz Antonio de Sousa Marcon, que lhe dá a capacidade de se auto calib
SlopeChannelB MT5
MIKHAIL VINOGRADOV
SlopeChannelB – una herramienta de análisis técnico que construye un canal de movimiento de precios inclinado, ofreciendo oportunidades únicas para evaluar la situación actual del mercado y encontrar señales de trading. Características principales del indicador: Canal de movimiento de precios inclinado : El indicador ayuda a visualizar los niveles de soporte y resistencia, que pueden indicar puntos potenciales de reversión o continuación de la tendencia. Varios colores de líneas y resaltado
The "RMA Signal Indicator MT5" refers to an indicator called "RMA" (Running Moving Average) Signal Indicator designed specifically for the MetaTrader 5 (MT5) trading platform. The RMA is a variation of the Moving Average indicator that emphasizes recent price data. The specific details and functionality of the "RMA Signal Indicator MT5" may depend on the developer or the version you are using. However, in general, here is a general approach to using a signal indicator like RMA on the MT5 platfor
El indicador Ichimoku Kinko Hyo sirve para el trading tendencial y se utiliza prácticamente en todos los mercados. Este indicador es único en muchos sentidos. Sin embargo, su ventaja principal consiste en ofrecer a los traders muchos puntos de referencia que permiten formar un concepto más comprensivo y completo sobre el movimiento del precio. Esta profundidad del análisis y una exclusiva claridad del indicador permite a los traders distinguir rápidamente las posibilidades comerciales y seleccio
VarMomentPulse is a unique manual trading algorithm developed with precision and flexibility in mind, based on an extensive historical data cluster.  Its operation is grounded in the principles of analyzing crossovers between normalized moving averages and dispersions across various time intervals, enabling it to uncover new opportunities in evaluating market trends. Key Features of the VarMomentPulse Indicator: Adaptability to Volatility:The use of price dispersion analysis allows VarMomentPul
The Matrix Series indicator analyzes price action, moving averages, and volatility to detect trending conditions. Bullish Trend: Green zones or upward signals indicate a strong uptrend, ideal for long positions. Bearish Trend: Red zones or downward signals suggest a downtrend, perfect for short positions. Sideways/Neutral Market: Non-highlighted or gray zones show periods of market consolidation or low momentum, helping you avoid false signals. Use Cases: Trend Confirmation: Use the indicator to
Antabod Multiplier
Rev Anthony Olusegun Aboderin
Antabod Multiplier , the ultimate trading indicator designed to simplify your decision-making process and maximize your trading potential. Built with a robust combination of moving averages and stochastic oscillators, this tool provides clear, actionable signals for both buy and sell opportunities. The Antabod Multiplier stands out with its dynamic trend detection and precision filtering, giving you real-time visual signals to catch trend reversals and optimal entry/exit points with ease. Whethe
Swing or Scalp Mt5
Jermaine Wedderburn
Continuous Coloured dot lines under and above price when conditions are met. Arrows Red and Green for entry Points.  User can change the colours of the arrows in the colour section of the indicator.  It is consider a great scalping tool on lower time-frames, while higher time frames will have fewer opportunities but trades will possibly last longer.  There is an input for Alert on or off.  This can be used effectively on M15/M30 Chart until up to H4 chart time.  It is best if the user has some
Day Channel   El indicador dibuja un canal construido en los niveles extremos de barras del período anterior establecido en la configuración, y también muestra el nivel de precios de cierre. Para que el indicador funcione correctamente, el período actual para el que se establecerá el indicador debe ser menor que el período especificado en la configuración del indicador. Descripción de la configuración del indicador: TimeFrame: selección de un período para graficar los niveles de los indicadores.
ZLMA Trend Candles indicator uses an enhanced Zero-Lag Moving Average to highlight key trend shifts, repainting candles in real time. It reacts faster than traditional moving averages, helping you spot potential market turns earlier. Gain clear entry and exit signals and filter out market noise with ease! This product is also available for MetaTrader 4 =>  https://www.mql5.com/en/market/product/129279 1. What Is ZLMA Trend Candles? ZLMA Trend Candles is a MetaTrader 4/5 indicator based on the Z
Flow MTF
Guillaume Jouans
This indicator takes as parameters the periods for three moving averages (Short, Long, Very_Long) and displays them for the current timeframe: - in the form of a cloud (green if Short is greater than Long, red if Short is less than Long) - as a line for the Very_Long moving average. It also allows you to display the status (BUY or SELL) of these same moving averages but for the M15, H1, H4, W1 and MN1 timeframes. This information is summarized in the window titled "TREND", where, for each timefr
ExactArrows for MT5
Pavel Krysanov
3 (3)
The main objective of this indicator is to determine entry and exit points, that is why ExactArrow draws nothing but arrows showing entry and exit points. In spite of apparent simplicity of the indicator, it has complicated analytic algorithms which determine entry and exit points. The indicator generates exact and timely entry and exit signals which appear on the current candle. The indicator generates an average of 1-2 candles before its analogues do. The indicator is very easy to use. Open Bu
Advanced 4xZeovo MT5 Indicator (MetaTrader 5)   Product Description  4xZeovo is a powerful trading indicator system monitoring 24/7 financial markets. Metatrader5 tool designed to find the best buying/selling opportunities and notifies the user.    Making life easy for traders in helping with the two most difficult decisions with the use of advanced innovate trading indicators aiming to encourage users to hold the winning positions and take profit at the best times.    Equipped with a unique tra
Fractal 358 Plus
Renato Fridschtein
Fractal 358 Plus is a predictive indicator that provides the clearest sight of price movements. Identifying graphic patterns such as Caixote (Crate), Pivot and Inside Candle , it shows entries and exits spots, as well as threats to your trades in the markets. It comes ready to use with B3 Mini Index (WIN$ series) and can be adjusted to use with any asset and timeframe. Fractal 358 unravels price movement Based on the Fibonacci sequence, Fractal 358 is a new and different way of reading and und
Ichimoku Tecnic
Ignacio Agustin Mene Franco
Ichimoku tecnic . es un indicador de velas , que capta las tendencias alcistas y bajistas segun su color de vela !  donde ay rompimientos tambien capta con colores de velas ,  los 2 colores mas importantes para cazar tendencia son rojo y aqua ,  donde claramente por color te dice cuando sube o baja ,  sirveb para todas las temporalidades !  sirve para los mercados de forex y indices sinteticos , tambien crypto !  World Inversor . Buen profit ! 
Linear Regression is a statistical method used to model the relationship between two or more variables. The primary goal of Linear Regression is to predict the value of one variable (called the dependent variable or outcome variable) based on the value of one or more other variables (called independent variables or explanatory variables) Linear Regression can be applied to technical analysis, and it is indeed one of the tools used by traders and analysts to make predictions and identify trends i
The technical indicator,   TrendGenius , is based on the values of statistical trading indicators. It allows you to predict the future value of an asset. Calculations are carried out according to a certain algorithm based on data on quotes for a certain period. The tool was created to simplify technical analysis and is used on various markets and exchanges, including cryptocurrency ones. A change in direction, from the point of view of market fundamentals, means a shift in trading interest tow
Los compradores de este producto también adquieren
NOTE: CYCLEMAESTRO is distributed only on this website, there are no other distributors. Demo version is for reference only and is not supported. Full versione is perfectly functional and it is supported. CYCLEMAESTRO , the first and only indicator of Cyclic Analysis, useful for giving signals of TRADING, BUY, SELL, STOP LOSS, ADDING. Created on the logic of   Serghei Istrati   and programmed by   Stefano Frisetti ;   CYCLEMAESTRO   is not an indicator like the others, the challenge was to inter
RelicusRoad Pro MT5
Relicus LLC
4.78 (18)
Ahora $ 147 (aumentando a $ 499 después de algunas actualizaciones) - Cuentas ilimitadas (PC o Mac) Manual de usuario de RelicusRoad + Videos de capacitación + Acceso al grupo privado de Discord + Estado VIP UNA NUEVA MANERA DE VER EL MERCADO RelicusRoad es el indicador comercial más poderoso del mundo para divisas, futuros, criptomonedas, acciones e índices, y brinda a los comerciantes toda la información y las herramientas que necesitan para mantenerse rentables. Brindamos análisis técnico
CBT Quantum Maverick Sistema de Comercio de Opciones Binarias de Alta Eficiencia CBT Quantum Maverick es un sistema de opciones binarias de alto rendimiento diseñado para traders que buscan precisión, simplicidad y un enfoque disciplinado. No requiere personalización: el sistema está optimizado para resultados efectivos desde el primer momento. Simplemente sigue las señales, que se pueden dominar con un poco de práctica. Características clave: Precisión de señales: Señales basadas en la próxim
The Naveen Dynamic Square  MT5  is one of the best known  technical analysis tools  inspired  by WD Gann along with the Gann Fan and Gann Box. It is considered a cornerstone of his trading technique that is based on time and price symmetry. The Naveen Dynamic Square MT5   is a powerful tool in finance for determining support and resistance levels based on a stock's extreme price points. It works by extrapolating probable price levels from a central value, typically an all-time or cyclical high o
FxaccurateLS
Shiv Raj Kumawat
WHY IS OUR FXACCCURATE LS MT5 THE PROFITABLE ? PROTECT YOUR CAPITAL WITH RISK MANAGEMENT Gives entry, stop and target levels from time to time. It finds Trading opportunities by analyzing what the price is doing during established trends. POWERFUL INDICATOR FOR A RELIABLE STRATEGIES We have made these indicators with a lot of years of hard work. It is made at a very advanced level. Established trends provide dozens of trading opportunities, but most trend indicators completely ignore them! The
Este es posiblemente el indicador de reconocimiento automático de formación de precios más completo que puede encontrar para la plataforma MetaTrader. Detecta 19 patrones diferentes, toma las proyecciones de Fibonacci tan en serio como usted, muestra la zona de reversión potencial (PRZ) y encuentra niveles adecuados de stop-loss y take-profit. [ Guía de instalación | Guía de actualización | Solución de problemas | FAQ | Todos los productos ] Detecta 19 formaciones de precios armónicos diferen
El Oscilador de Índice de Precisión (Pi-Osc) de Roger Medcalf de Precision Trading Systems La versión 2 ha sido cuidadosamente recodificada para cargar rápidamente en su gráfico y se han incorporado algunas otras mejoras técnicas para mejorar la experiencia. El Pi-Osc fue creado para proporcionar señales precisas de temporización de operaciones diseñadas para encontrar puntos de agotamiento extremos, los puntos a los que los mercados se ven obligados a llegar solo para eliminar las órdenes de
Indicador único que implementa un enfoque profesional y cuantitativo para el comercio de reversión a la media. Aprovecha el hecho de que el precio se desvía y vuelve a la media de manera predecible y medible, lo que permite reglas claras de entrada y salida que superan ampliamente las estrategias comerciales no cuantitativas. [ Installation Guide | Update Guide | Troubleshooting | FAQ | All Products ] Señales comerciales claras Sorprendentemente fácil de operar Colores y tamaños personalizables
The   Time_Price_SQ9_Degree   indicator is based on the 9 Gann square. Using this indicator, you can identify strong time and price zones. The indicator displays the levels as a degree value. The degrees can be set in the settings. After launching, the MENU button appears. If it is highlighted, it can be moved to any point on the graph, and after double-clicking on it, it stops being highlighted and menu buttons appear. To hide the menu, just double-click on the button, it will become highlight
[ MT4 Version ]  [ Order Blocks ]  [ Kill Zones ]  [ SMT Divergences ] How to trade using Order Blocks :  Click here User Interface Performance:  During testing in the strategy tester, the UI may experience lag. Rest assured, this issue is specific to the testing environment and does not affect the indicator's performance in live trading. Elevate your trading strategy with the  Order Blocks ICT Multi TF  indicator, a cutting-edge tool designed to enhance your trading decisions through advanced o
[ MT4 Version ]  [ Kill Zones ]  [ SMT Divergences ] How to trade using Order Blocks:  Click here User Interface Performance:  During testing in the strategy tester, the UI may experience lag. Rest assured, this issue is specific to the testing environment and does not affect the indicator's performance in live trading. Elevate your trading strategy with the  Order Blocks ICT Multi TF  indicator, a cutting-edge tool designed to enhance your trading decisions through advanced order block analysis
Pro Thunder V10: ¡El Indicador Definitivo para Operaciones de Opciones Binarias! Lleva tu trading al siguiente nivel con Pro Thunder V10 , el pináculo de las operaciones con opciones binarias. Impulsado por tecnología avanzada de Redes Neuronales con IA , este indicador revolucionario está diseñado para ofrecer precisión y confiabilidad incomparables. Desde señales en tiempo real que no se repintan hasta un rendimiento impecable en condiciones de mercado volátiles, Pro Thunder V10 es t
How to use Pair Trading Station Pair Trading Station is recommended for H1 time frame and you can use it for any currency pairs. To generate buy and sell signal, follow few steps below to apply Pair Trading Station to your MetaTrader terminal. When you load Pair Trading Station on your chart, Pair Trading station will assess available historical data in your MetaTrader platforms for each currency pair. On your chart, the amount of historical data available will be displayed for each currency pai
Reversal ALGO
Muhammad Abdullah Bhatti
Reversal Algo es un indicador técnico diseñado para ayudar a los traders a identificar posibles puntos de reversión en la tendencia del mercado. A través de un análisis profundo de los datos históricos de precios, este indicador detecta máximos y mínimos clave que podrían indicar un cambio en la dirección del mercado. Su sistema de señales visuales claras permite a los traders identificar zonas críticas donde podría producirse una reversión de tendencia. Características principales Detección de
Offer 249 down from 350 for the next 1 copies. then back to 350 $ Are you tired of using outdated indicators that leave you guessing where to set your profit targets? Look no further than the AK CAP Opening Range Breakout Indicator. This powerful tool is backed by a US patent and has already helped countless traders pass funded challenges like FTMO. We use it daily on our prop traders and internal funds, and now it's available to you as well. The calculation behind the indicator is incredibly a
PZ Trend Trading MT5
PZ TRADING SLU
3.8 (5)
Trend Trading es un indicador diseñado para sacar el máximo provecho posible de las tendencias que tienen lugar en el mercado, mediante el cronometraje de retrocesos y rupturas. Encuentra oportunidades comerciales al analizar qué está haciendo el precio durante las tendencias establecidas. [ Guía de instalación | Guía de actualización | Solución de problemas | FAQ | Todos los productos ] Opere en los mercados financieros con confianza y eficiencia Aproveche las tendencias establecidas sin ser
Super Zone indicator
Dmitriy Sotnikov
5 (1)
Super Zone   For several years of observing the principles of the market, Super Zone worked, both then and now, because the indicator  allows you to see the trading range of the  week and even the month that major market participants use. It’s very easy to use, we work on H4 in the weekly range (  in the tester it doesn’t work in the demo mode  ) - we sell from the upper zones, we buy from the lower ones. It marks the zones from the beginning of the week (month) that are  not redrawn  , works on
TrendMaestro5
Stefano Frisetti
note: this indicator is for METATRADER4, if you want the version for METATRADER5 this is the link:  https://www.mql5.com/it/market/product/108106 TRENDMAESTRO ver 2.4 TRENDMAESTRO recognizes a new TREND in the bud, he never makes mistakes. The certainty of identifying a new TREND is priceless. DESCRIPTION TRENDMAESTRO identifies a new TREND in the bud, this indicator examines the volatility, volumes and momentum to identify the moment in which there is an explosion of one or more of these data a
This indicator is based on the mathematics of the great trader W.D. Ganna. With its help, you can easily find strong levels by analyzing swings to find the optimal entry point. The indicator works on all instruments and all timeframes. The indicator is fully manual and has control buttons. All you need to do is press the NEW button, a segment will appear, which you can place on any movement, swing or even 1 candle that you want to analyze. By placing the segment, press the OK button. A grid (th
This indicator identifies and displays zones, as it were areas of strength, where the price will unfold. The indicator can work on any chart, any instrument, at any timeframe. The indicator has two modes. The indicator is equipped with a control panel with buttons for convenience and split into two modes. Manual mode: To work with manual mode, you need to press the NEW button, a segment will appear. This segment is stretched over the movement and the LVL button is pressed. The level is displayed
Introduction to X3 Chart Pattern Scanner X3 Cherart Pattern Scanner is the non-repainting and non-lagging indicator detecting X3 chart patterns including Harmonic pattern, Elliott Wave pattern, X3 patterns, and Japanese Candlestick patterns. Historical patterns match with signal patterns. Hence, you can readily develop the solid trading strategy in your chart. More importantly, this superb pattern scanner can detect the optimal pattern of its kind. In addition, you can switch on and off individu
Elliot Waves Analyzer Pro
Viktor Weidenthal
2.67 (3)
Elliot Waves Analyzer Pro calculates Elliot Waves to Help Identify Trend direction and Entry Levels. Mainly for Swing Trading Strategies. Usually one would open a Position in trend direction for Wave 3 or a Correction for Wave C . This Indicator draws Target Levels for the current and next wave. Most important Rules for Elliot Wave Analysis are verified by the Indicator.  The Pro version analyzes Multiple Timeframes and shows the Subwaves and Target-Levels.   For an Overview  " Elliot Waves Anal
TMA Channel is a price channel obtained through a special calculation method based on traditional TMA . The channel has upper, middle, and lower tracks . When the price approaches or exceeds the upper track, it is already in an overbought state, and attention should be paid to the situation of reversal and decline; When the price approaches or falls below the lower track, it is already in an oversold state, and attention should be paid to the situation of reversal and rise . The indicator will
Seconds Charts
Aleksandr Goryachev
Micro  ******************* Секундные графики MT5 ********************** Более точного инструмента для входа в сделку вы не найдёте. Входные параметры: Timeframe, sek - период построения графика, секунды Displayed bars - отображаемые бары Step of price levels, pp, 0-off - шаг отрисовки ценовых уровней, пункты Scale points per bar, 0-off - масштаб в пунктах на бар Show lines - отображение текущих уровней Show comment - отображение комментария Standard color scheme - стандартная цветовая сх
El Indicador de Cuadrados de Gann es una herramienta poderosa de análisis de mercado basada en el artículo "Fórmula Matemática para Predicciones de Mercado" escrito por W.D. Gann, que se basa en conceptos matemáticos para el análisis. Incorpora elementos de las técnicas de Gann relacionadas con los cuadrados de 144, 90 y 52, así como el cuadrado de 9. Además, incluye el método del  sobre cómo combinar el cuadrado de 9 con canales y patrones de estrellas. Manual del Usuario y Modo de Uso: Antes d
Weis Wave with Alert MT5
Trade The Volume Waves Single Member P.C.
4.94 (16)
Rental/Lifetime Package Options and Privileges  Rent Monthly Six Months   Yearly/Lifetime Weis Wave with Speed with Alert+Speed Index x x x Manual  x x x Quick Set up Video x x x Blog x x x Lifetime Updates x x x Setup and Training Material x x Discord Access Channel "The SI traders"          x Rectangle Break Alert Tool      x How to trade with it:    http://www.tradethevolumewaves.com   ** If you purchase please contact me to setup your  : Two hour  webinar and  training Room and  complet
Happy entries
Godwill Fortune Otieno Juma
The  product gives optimized entries for 3min ,1 hr and day timeframes  Does well with indices  ASIAN- HK50 AND CHINA A50 USA-US30,US100,US500 GER40 ,UK100 For stocks trade with the day timeframes Happy Entry employs advanced algorithms and real-time data analysis to identify optimal entry points with unprecedented accuracy. Its adaptive nature allows it to seamlessly adjust to changing market conditions, ensuring you never miss out on profitable opportunities. Whether you're a beginner or seas
BookMap HeatMap
Roberto Spadim
1 (2)
This Indicator creates a heatmap based on depth of market of the current symbol or another symbol. Other symbol is useful when you trade futures market and a contract has 'mini' and 'full' split. For example, in Brazil (B3 - BMF&Bovespa), WDO and DOL are future Forex contract of BRL/USD (where 1 DOL = 5 WDO) and big banks work mostly with DOL (where liquidity is important). Please use with M1 timeframe , objects are too small to be displayed at higher timeframes (MT5 limit). The number of level
Por supuesto, aquí tienes la traducción al español: Presentamos el Indicador de Astronomía para   MT4 / MT5 : Tu Compañero Celestial Definitivo en el Trading ¿Estás listo para elevar tu experiencia de trading a alturas celestiales? No busques más allá de nuestro revolucionario Indicador de Astronomía para MT4. Esta innovadora herramienta trasciende los indicadores de trading tradicionales, aprovechando el poder de algoritmos complejos para proporcionarte una visión astronómica sin igual y cálcul
Hello I Want to introduce The Forex Buy Sell Arrow Premium MT5 i recently release this premium indicator! its 1000% Non Repaint Indicator, It Work Perfectly Well,, i tested it day by day, Just mind blowing Result,  Including Powerful trend Algorithm! How It Work? well, it work market trend formula, when trend Bullish Or when trend Bearish,  Recommend Timeframe M30, H1 it work all timeframe, and all currency pair, 100% non repaint, How to take signal From Forex Buy Sell Arrow Premium Ind
Otros productos de este autor
¿Cuántas veces ha buscado un PIVOT que funcione en una vela específica cada día? A muchos operadores les gusta estimar la dirección de la tendencia del día basándose en un momento específico cada día, como 30 minutos después de la apertura del mercado, o a las 12 del mediodía, etc. Este indicador le permite especificar una hora determinada (hora y minuto) y traza un pivote desde esa hora hasta el día siguiente a la misma hora. Muestra cinco líneas basadas en esa hora/vela concreta: mediana, m
FREE
Keltner-Enhanced mejora la precisión y legibilidad de los Canales Keltner con muchas opciones para ajustarlos y más cinco cálculos de precios más allá del predeterminado META. El indicador Keltner-E es un indicador de bandas similar a las Bandas de Bollinger y a las Envolventes de Medias Móviles. Consisten en una envolvente superior por encima de una línea media y una envolvente inferior por debajo de la línea media.  Los principales acontecimientos a tener en cuenta al utilizar los canales d
FREE
El Jurik Advanced MA (JurMA) es un "non-repaint" indicador técnico desarrollado sobre el JMA original concebido por Mark Jurik.  Está diseñado para reducir el desfase presente en las medias móviles tradicionales, mejorar la suavidad y reducir el ruido. JurMA se adapta a la volatilidad del mercado y el usuario puede ajustar su sensibilidad, lo que lo hace útil para identificar tendencias y retrocesos en los mercados financieros. Esta adaptabilidad y eficacia lo hacen popular entre operadores y
Trend On Close
David Ben Svaiter
TrendOnClose es un sofisticado indicador diseñado para inversores en mercados binarios, centrado en el análisis estadístico de tendencias y contra-tendencias dentro de ciclos de velas específicos. Cada ciclo se define por el precio de CIERRE de la vela, estableciendo la dirección de la tendencia (ARRIBA/ABAJO - BULL/BEAR) para el posterior análisis estadístico hasta el inicio del siguiente ciclo. El análisis estadístico opera con dos configuraciones: ⦁ Objetivo Estadístico como VELA SUBSECUEN
HAshi-E es una forma mejorada de analizar las señales Heiken-Ashi. Información: Heiken-Ashi es especialmente valorado por su capacidad para filtrar la volatilidad a corto plazo, lo que lo convierte en una herramienta preferida para identificar y seguir tendencias, ayuda en la toma de decisiones sobre puntos de entrada y salida, y ayuda a distinguir entre señales falsas y auténticos cambios de tendencia. A diferencia de los gráficos de velas tradicionales, las velas Heiken-Ashi se calculan uti
Diseñado por Welles Wilder para gráficos diarios de materias primas, el ADXW es utilizado actualmente en diversos mercados por operadores técnicos para evaluar la fuerza de una tendencia o incluso una tendencia para operaciones a corto o largo plazo. El ADXW utiliza un indicador direccional positivo (DI+) y negativo (DI-) además de su línea de tendencia (ADX). Según Wilder, una tendencia tiene fuerza cuando la señal del ADX es superior a 25; la tendencia es débil (o el precio no tiene tendenc
El volumen en balance (OBV) es un indicador técnico que relaciona el volumen y el precio para identificar los movimientos de los precios. La idea básica detrás del OBV es que los cambios en el volumen generalmente preceden a los cambios en el precio. El indicador acumula volúmenes para los periodos en los que el precio cierra al alza y resta volúmenes para los periodos en los que el precio cierra a la baja. El resultado es un valor utilizado para identificar la dirección de la tendencia del act
Slow AMA
David Ben Svaiter
Compared to simple or exponential moving averages, slow adaptive trend lines might offer a more nuanced view of the trend by adjusting their sensitivity based on market conditions. However, their slow nature might also mean they are late in signaling reversals when market conditions change rapidly - and that is the difference between them and our SlowAMA . SlowAMA was designed to be a better long-term trend indicator than EMA and other Moving Averages. It uses our JurMA calculations, reducing
HAshi-E es una forma mejorada de analizar las señales Heiken-Ashi. Información: Heiken-Ashi es especialmente valorado por su capacidad para filtrar la volatilidad a corto plazo, lo que lo convierte en una herramienta preferida para identificar y seguir tendencias, ayuda en la toma de decisiones sobre puntos de entrada y salida, y ayuda a distinguir entre señales falsas y auténticos cambios de tendencia. A diferencia de los gráficos de velas tradicionales, las velas Heiken-Ashi se calculan uti
¿Cuántas veces ha buscado un PIVOT que funcione en un intervalo de tiempo específico cada día? A muchos operadores les gusta estimar la dirección de la tendencia del día basándose en un intervalo de tiempo específico cada día, como desde 2 horas antes de la apertura de la Bolsa de Nueva York hasta 1 hora después, o desde la apertura de la Bolsa de Nueva York hasta 30 minutos después. Este indicador le permite especificar un intervalo de tiempo determinado (hora y minuto) y traza un pivote des
VIDYA Enhanced
David Ben Svaiter
El indicador VIDYA-ENHANCED (Promedio Dinámico de Índice Variable) es una herramienta de análisis técnico utilizada para identificar tendencias y movimientos laterales. Ajusta dinámicamente su sensibilidad en función de la volatilidad del mercado, utilizando el Chande Momentum Oscillator como índice de volatilidad. Esta característica permite a VIDYA-ENHANCED ser más ágil durante los periodos de movimientos significativos de los precios, permaneciendo más estable durante las fases menos voláti
Filtro:
No hay comentarios
Respuesta al comentario