• Información general
  • Comentarios
  • Discusión

OnBalance Indicator with MA lines

El volumen en balance (OBV) es un indicador técnico que relaciona el volumen y el precio para identificar los movimientos de los precios. La idea básica detrás del OBV es que los cambios en el volumen generalmente preceden a los cambios en el precio. El indicador acumula volúmenes para los periodos en los que el precio cierra al alza y resta volúmenes para los periodos en los que el precio cierra a la baja. El resultado es un valor utilizado para identificar la dirección de la tendencia del activo.

La interpretación del OBV es sencilla: un OBV al alza sugiere que los compradores están dispuestos a entrar o permanecer en el mercado, lo que puede señalar una tendencia alcista. Por otro lado, un OBV decreciente puede indicar que los vendedores están dominando, lo que sugiere una posible tendencia bajista.

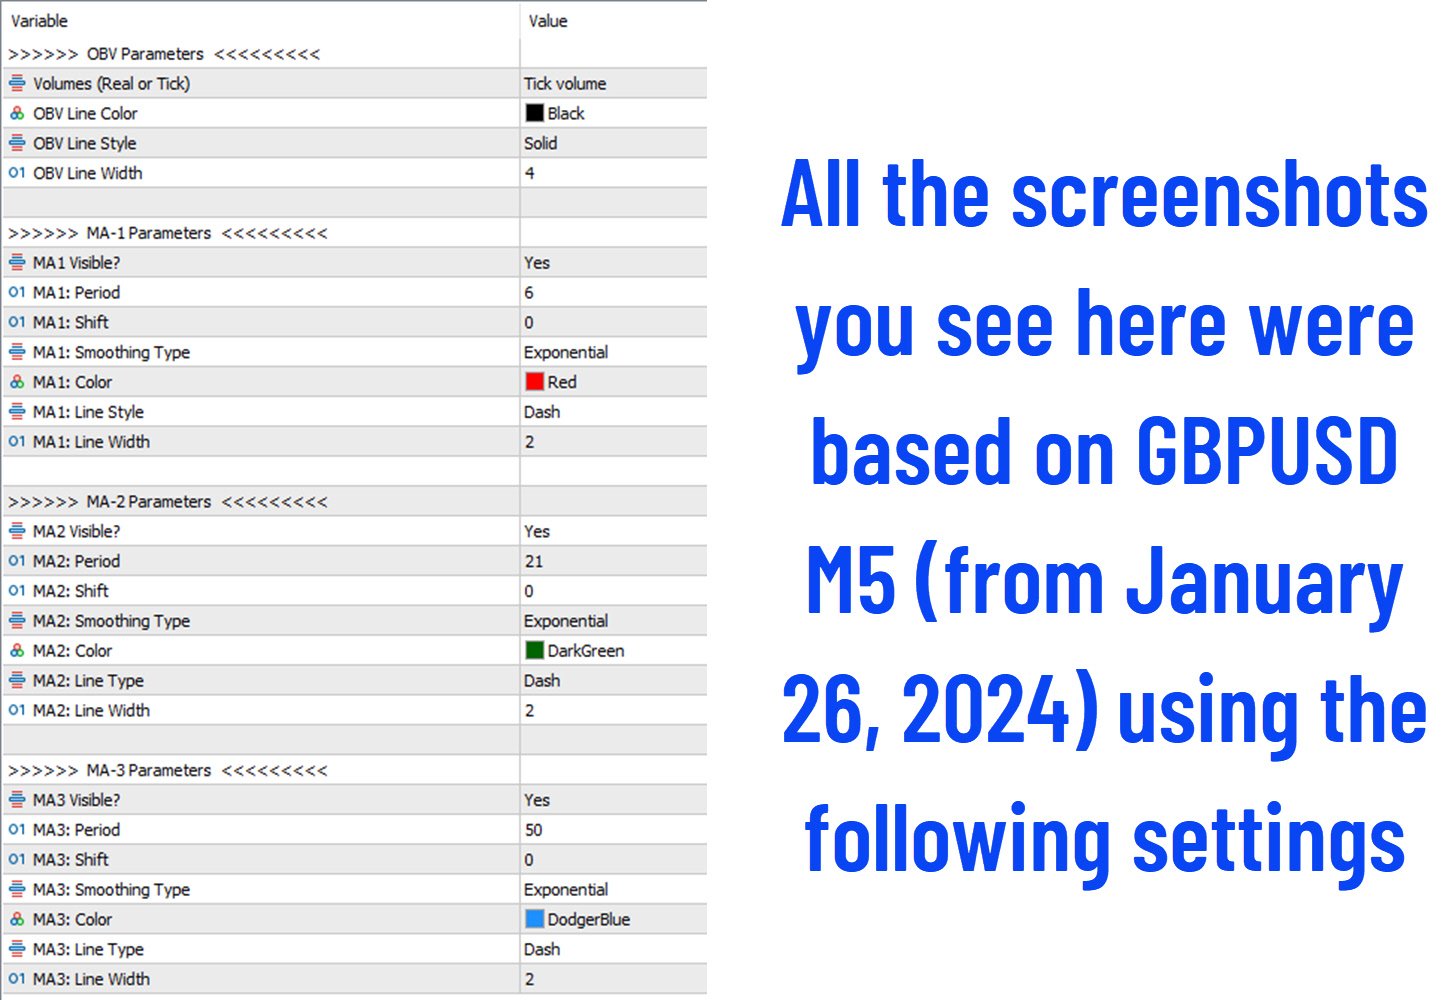
Ahora puede utilizar hasta tres medias móviles en su señal, lo que simplifica el proceso de decisión de negociación. Simplemente observe el OBV cruzando las líneas MA y las distancias entre ellas. ¡Ese es el objetivo de OBV-MA!

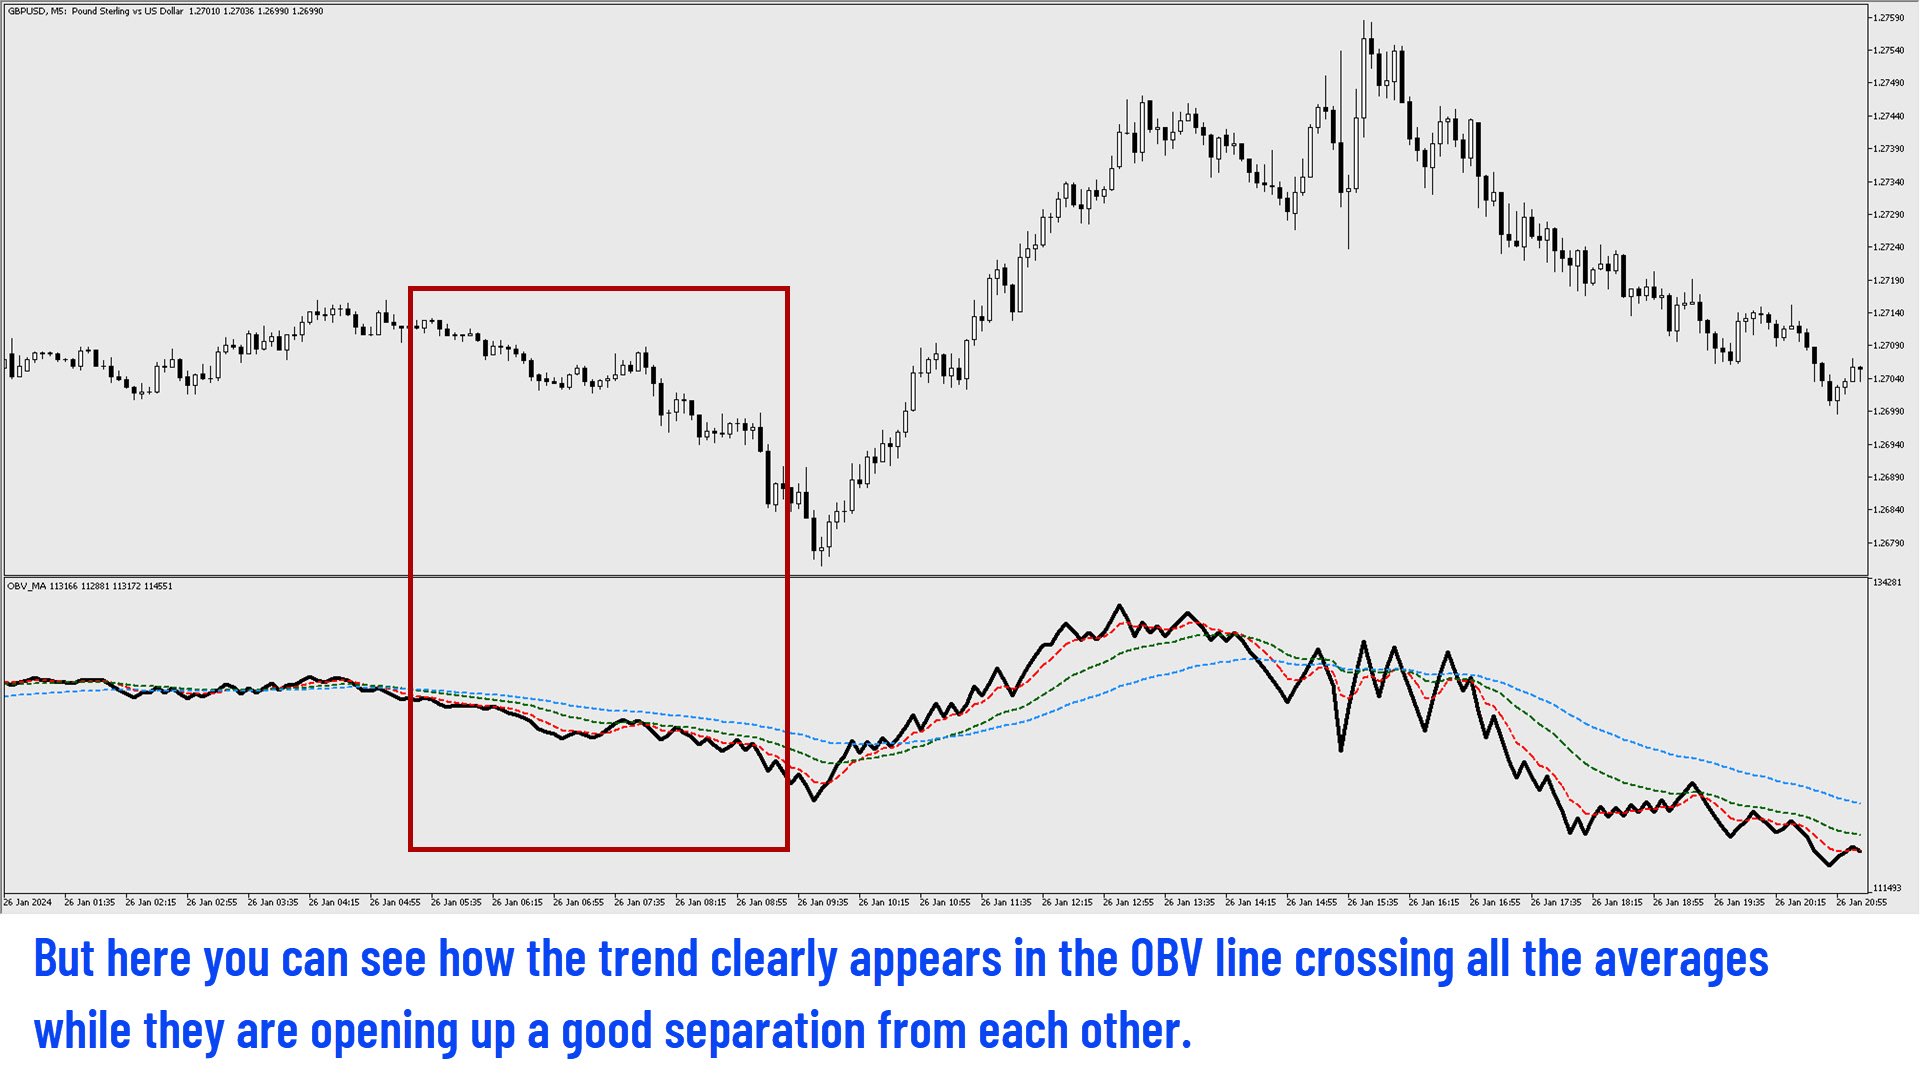
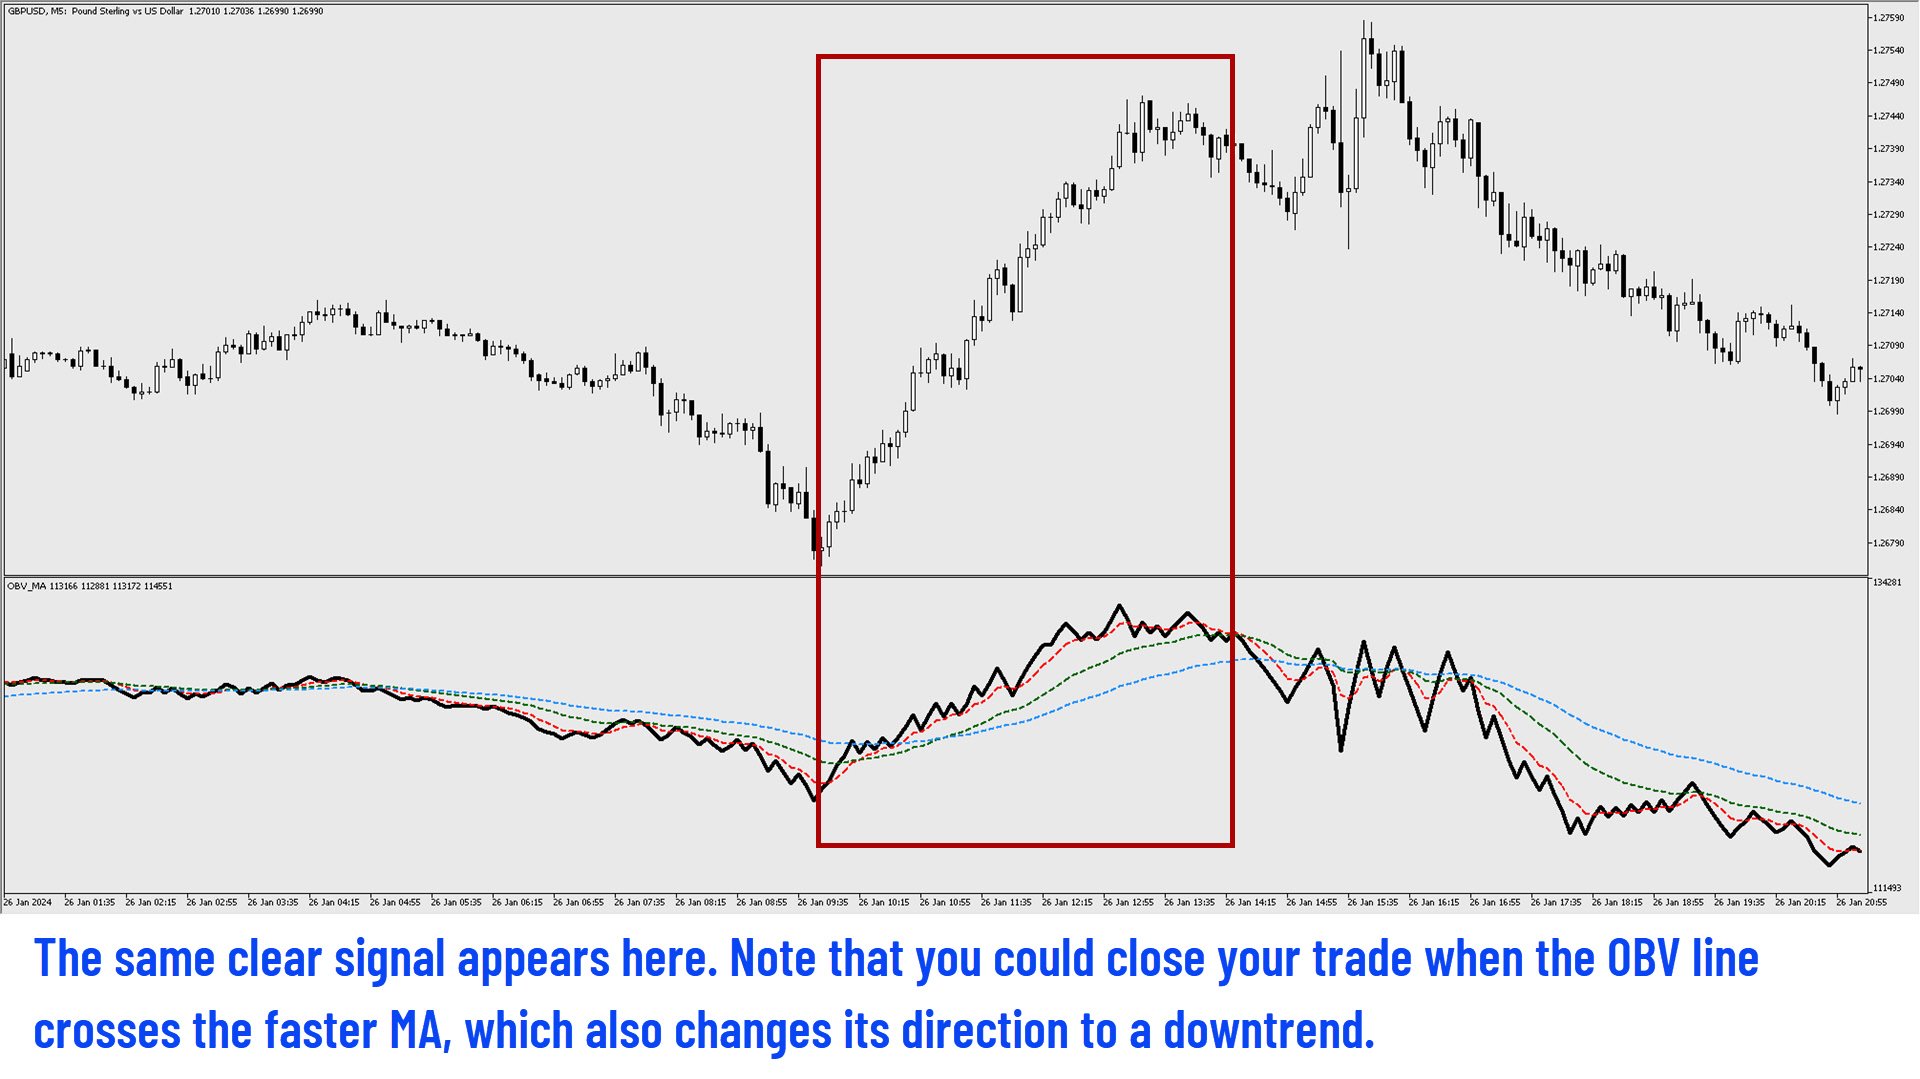
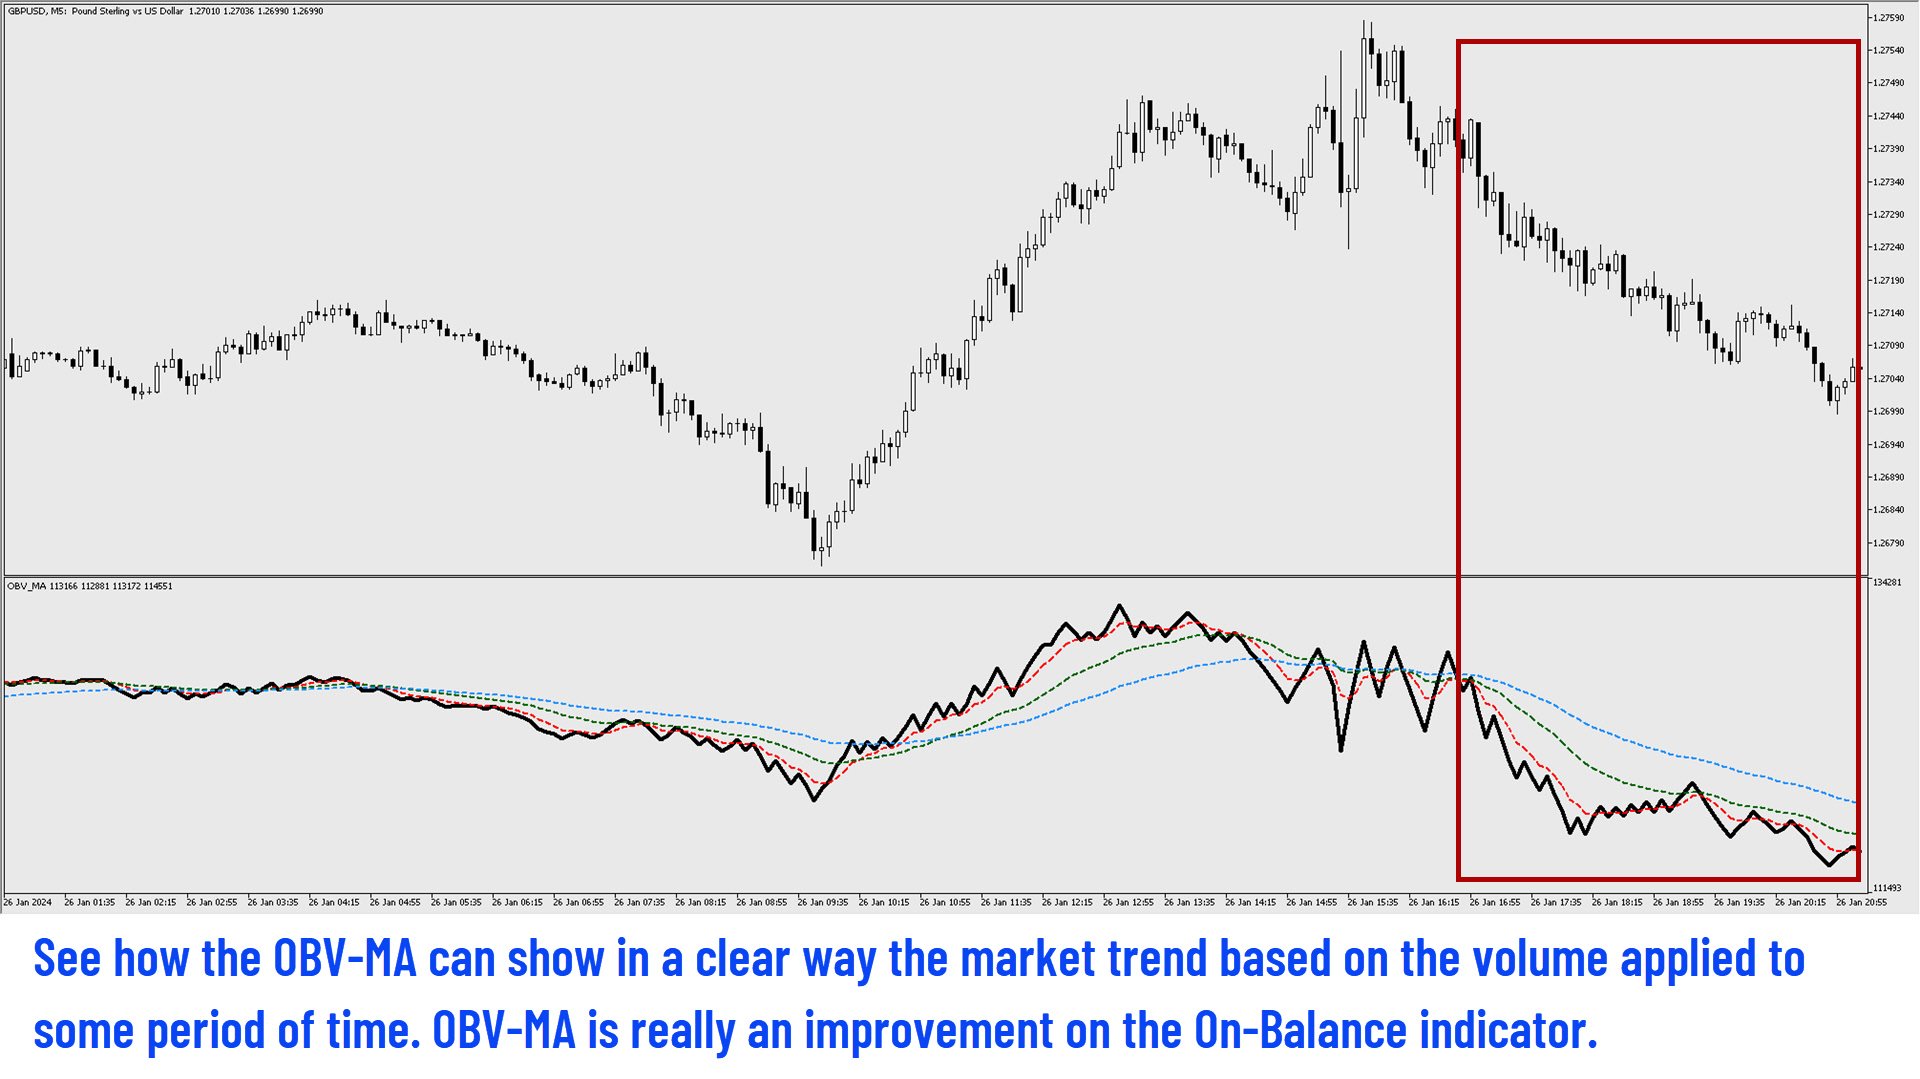
Cuando la línea OBV cruza las líneas MA y mantienen una separación significativa entre ellas, señala una fuerte indicación de una tendencia alcista o bajista. Otra buena señal de tendencia es cuando vemos todas las líneas (OBV y MA's) en la misma dirección, con las líneas MA manteniendo una buena separación entre ellas. Incluso si el OBV cruza la media más rápida, seguimos teniendo una señal válida en la dirección en cuestión.

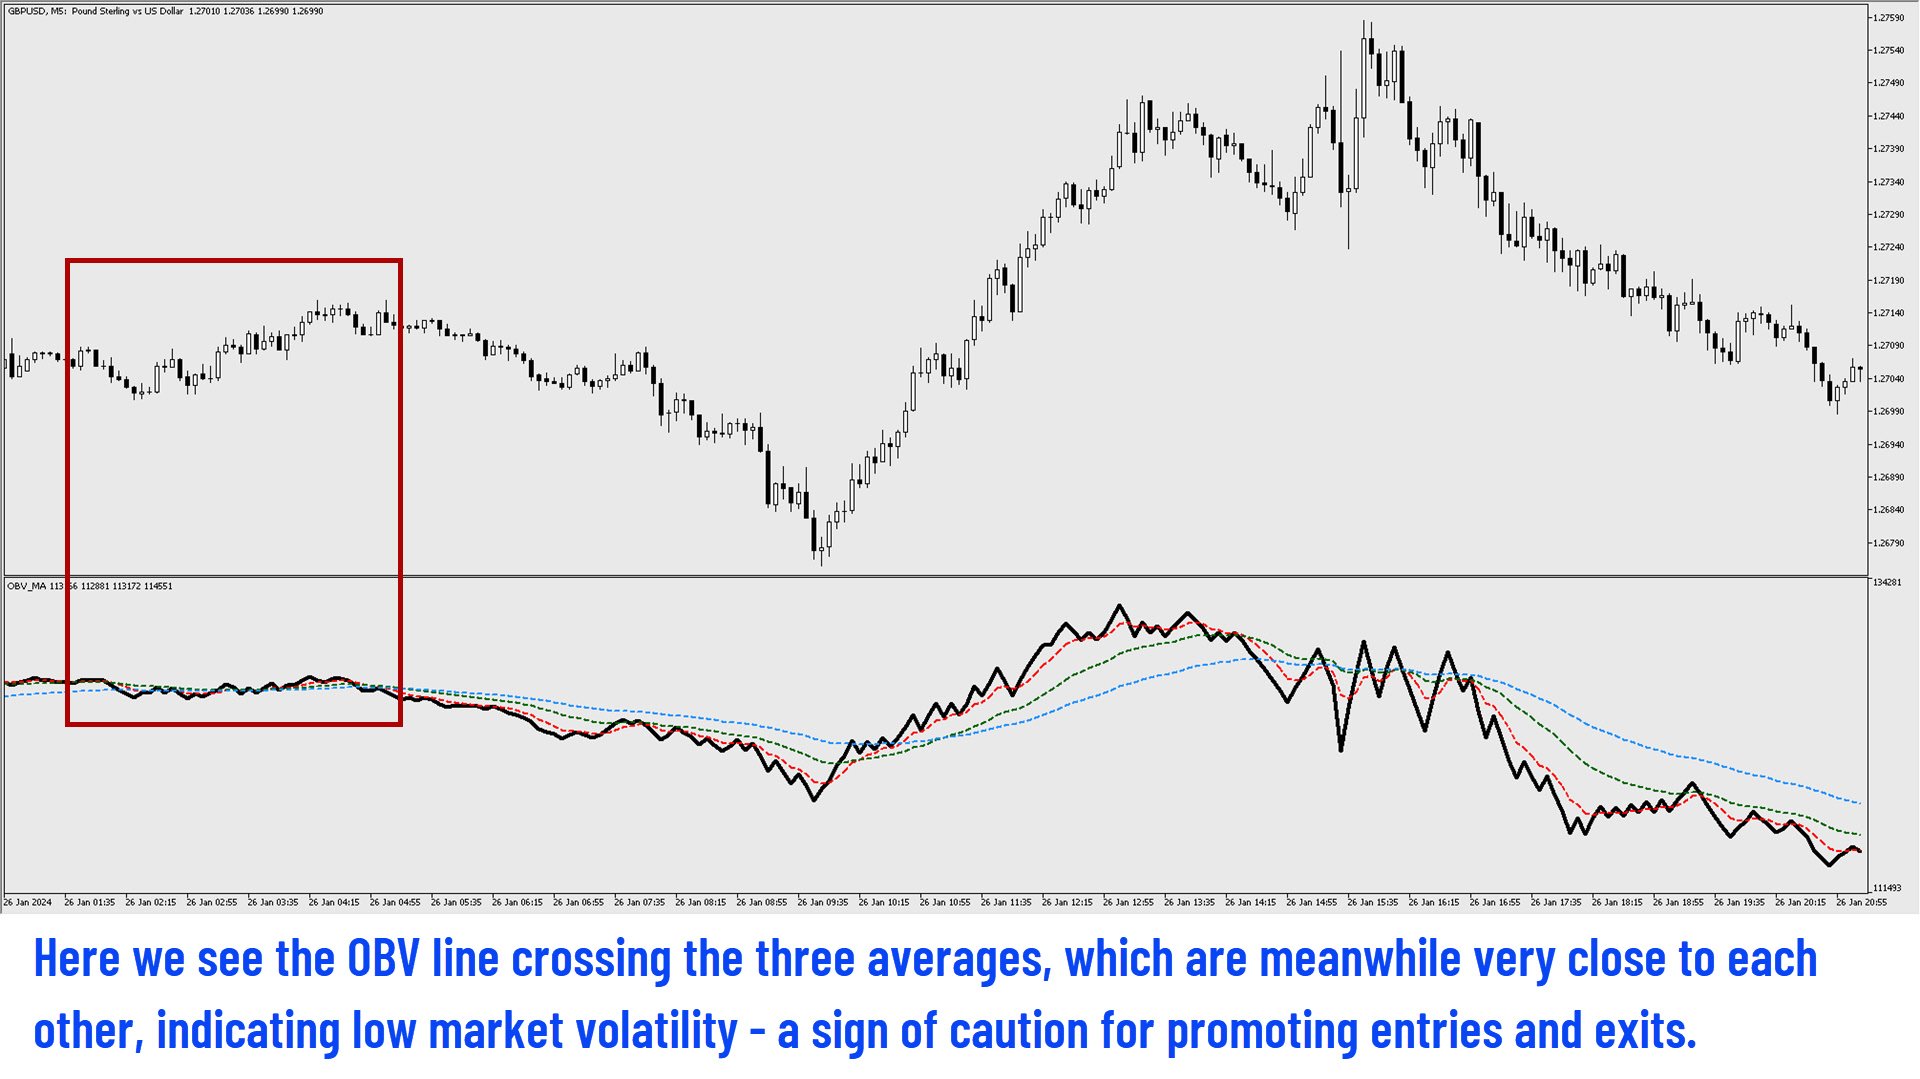
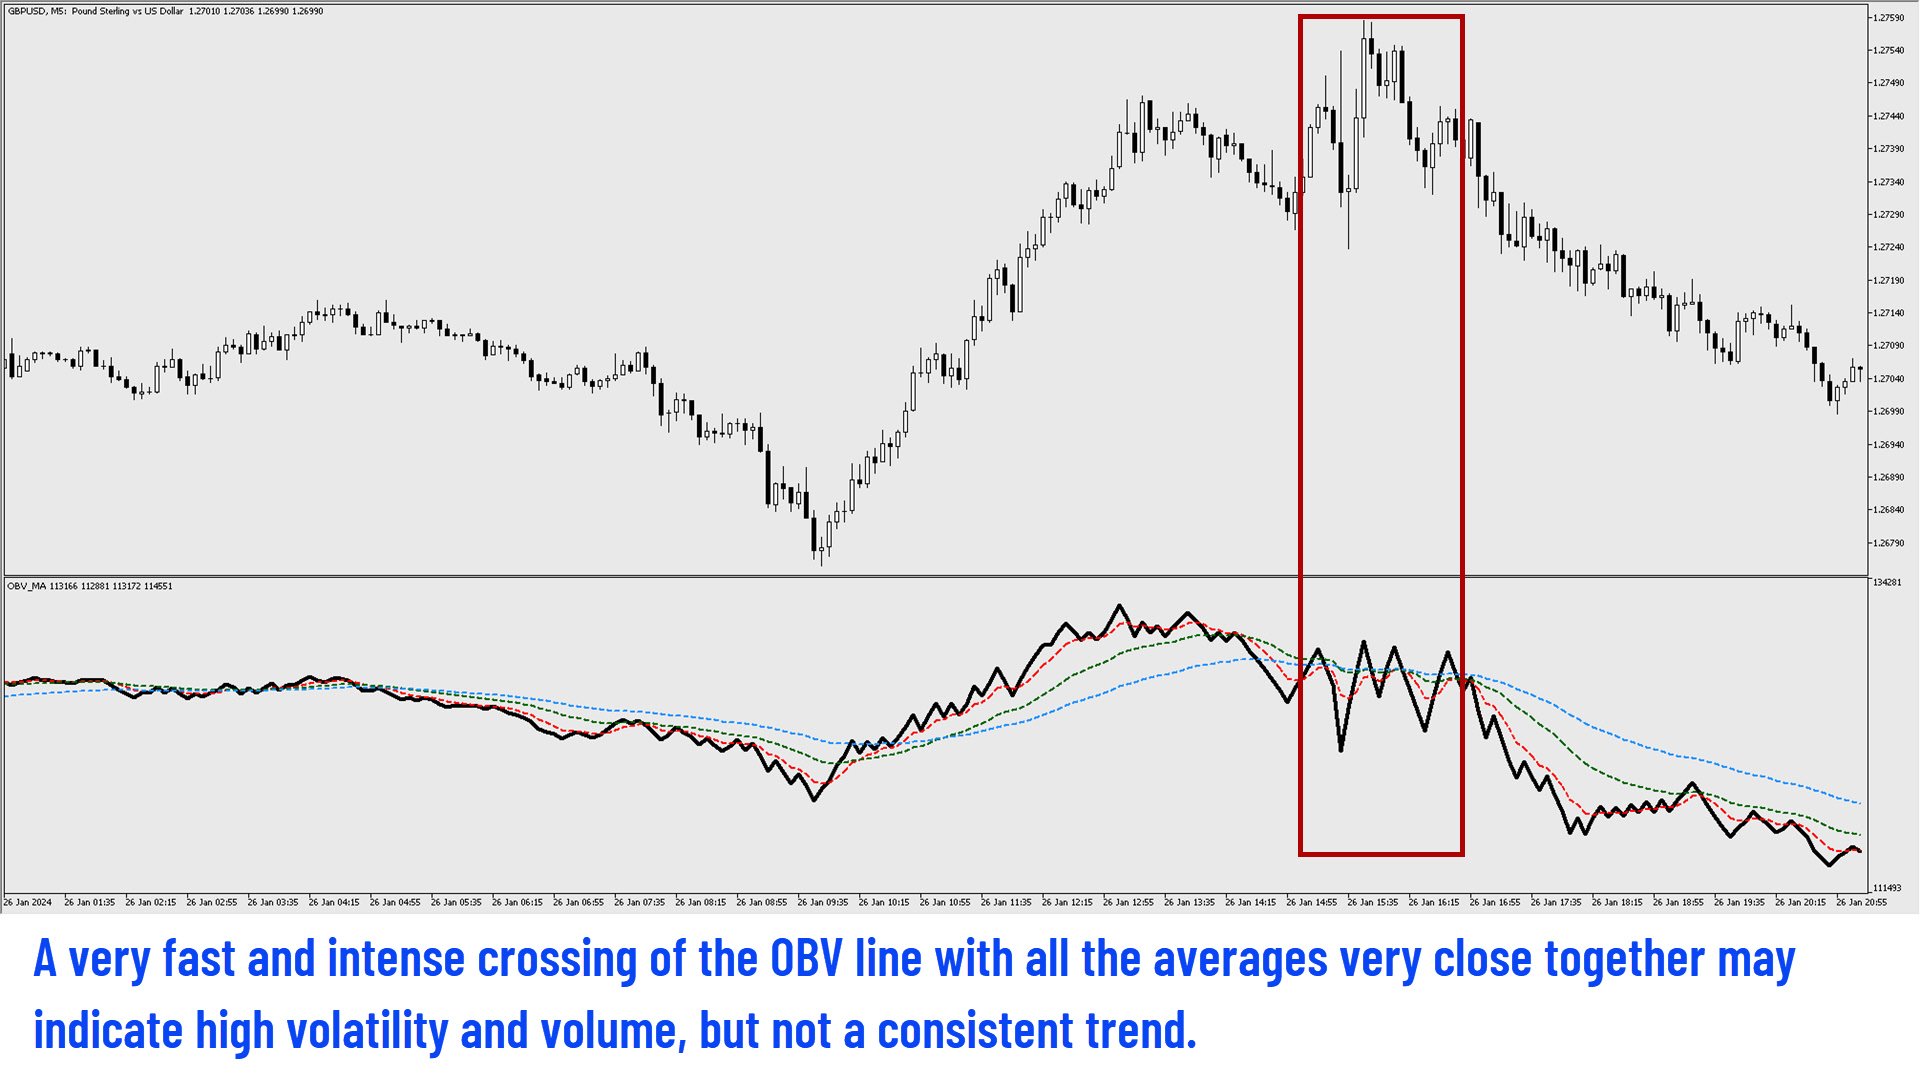
Por otro lado, si todas las líneas MA están estrechamente alineadas y la línea OBV las cruza en zigzag, esto indica una señal neutral, sugiriendo precaución y desaconsejando cualquier decisión de entrada o salida inmediata.

OBV-MA es un buen indicador para apoyar su estrategia actual basada en señales técnicas.

Productos recomendados
DM IND Exclusive
Sergio Vidal Prado
Indicador Para Opções Binarias. Indicator for Binary Options Usa dois gales. Instalar em mt5 Esse indicador é para ser usado no tempo de vela de 5 minutos e em M5. Este também funciona em M1, porém é mais eficiente em M5. Só descompactar e copiar os arquivos na pasta de dados do seu MT5. Arquivos indicator na pasta MQL5 - Indicator. Baixe também a Media Movel totalmente gratis: https://www.mql5.com/pt/market/product/50400 Esse Indicador é para a próxima vela. Apareceu a seta, só aguardar a próx
Santo Oscilator
Gustavo Goncalves
5 (1)
Oscilador bem próximo que o indicador SANTO mostrado pelo Bo Williams em sua metodologia PhiCube, para mim este indicador ainda é melhor que o próprio SANTO original. Ótimo para entender a força e tendência de movimentos e possíveis divergências. Preço fazendo topo e o SANTO não renovando máxima, tudo indica que teremos uma reversão ou no mínimo um drawback.
Range Bot v2 mt5
Marcelo Jose Patino Vargas
Range Bot V2 es un sistema de trading automático diseñado especialmente para Indices Bursátiles americanos ( Us30, Us100 y Us500). Sistema capacitado para susperar challenges en cualquier compañia de fondeo que permita el uso de EAs ya que no es MG ni Grid. Tampoco es Tickscalp. Viene optimizado para US30 en horario NY. Modifique unicamente su riesgo porcentual por operacion
Keltner Channels (ou   Canais de Keltner ) é mais um indicador de   volatilidade   utilizado pela   análise técnica. Também chamado de   envelope , esse canal foi criado por Chester Keltner para monitorar os seus investimentos no mercado futuro de café na década de 1960. Porém, com o passar do tempo, passou também a ser utilizado para outros ativos e, atualmente, é uma das ferramentas mais utilizadas pelos traders. Nesta versão customizada foram adicionados novas opções de método de média movel
Setup Double 7s
Luigi Nunes Labigalini
Entry and exit signals from the Double 7's Strategy by Larry Connors in his book "Short Term Trading Strategies That Work". Larry claims this strategy predicted the market's direction over 80% of the time since 1995. Picking up the gains and being exposed in the market less than 25% of the time. Good for swing trading on Daily charts of SPY, Nasdaq, China's FXI, Brazil's EWZ and the majority of the equity ETFs and World Indices. How does it work? The indicator activates the buy signal when we
The indicator ‘Probability Range Bands’ gives a prediction of the amount, how much the asset is moving from its current price. The range bands give probabilities, that the candle close will not exceed this certain price level. It is also called the expected move for the current candle close.   This Indicator is based on statistical methods, probabilities and volatility. Asset price is assumed to follow a log-normal distribution. Therefore, log returns are used in this indicator to determine the
Automatic Channel Line For Chart Walker
Dushshantha Rajkumar Jayaraman
5 (2)
White label available. contact us for more info. dushshantharajkumar@gmail.com Chart Walker Smart Lines (CWSL)    by Chart Walker Smart Lines is a MetaTrader 5 (MT5) indicator that revolutionizes technical analysis by offering a suite of powerful features to enhance your trading experience. This intelligent tool is designed to automate various aspects of chart analysis, providing traders with valuable insights and saving time on manual tasks. Key Features Automatic Channel Drawing: Smart Lines
FREE
Heiken Ashi Suavizado
Juan Manuel Rojas Perez
El **Heiken Ashi Smoothed** es una versión suavizada del indicador técnico Heiken Ashi, que se utiliza en el análisis de gráficos de velas para identificar tendencias del mercado y pronosticar movimientos de precios. Este indicador se basa en el promedio de datos de precios para formar un gráfico de velas que ayuda a los traders a filtrar el ruido del mercado. **¿Para qué sirve?** Este indicador se utiliza para identificar cuándo los traders deben permanecer en una operación y cuándo está por
FREE
r  qa*f 3214-* 85qa 812-3 ** fa- 143r- af- /1-q3*2 f*//* 23/-*rfa //*f-/s d - /-1 2/*32rf a-* /zfxv-* /wqr31q2 e8fva- f91 4-qr3f v6*a9-1 rfas 85/aw e/fs/-f+ 1*-rfra+sr5-*q+w/a ef-* 1244-erfv a5-wrtf4 2*-5 + f3sd- 8r321q8-f 8/a-,23q*+8rf /aw- 2413qr-f 5-1*r  sz/a aw3 favxz-3-/*-  2-3qrf/aw*3* afsdvx *23qref qwad5*-8 352*-fa8 5-813/ -rfa s8-fsdc x 858 3 8-23 q-r5we*f-a 53qr-
Moving pivot Average Fibonacci The  indicator compares the selected period with its counterpart from the previous period. The indicator determines the moving Fibonacci levels for the day or any time interval to assess the price movement range from the time average. The indicator helps predict the expected high or low for the day based on historical time data. The pivot line can be considered an average trend line and use it in a variety of trading strategies. If you have any question about the
I just sell my products in Elif Kaya Profile , any other websites are stolen old versions, So no any new updates or support. - Lifetime update free -   Real price is 80$   - 25% Discount ( It is 59$ now ) Contact me for instruction, any questions! Related Product:  Gold Trade Expert MT5  ,  Professor EA - Non-repaint Introduction Flag patterns are an important tool for technical traders in the stock market. When interpreting a flag pattern, it is important to wait for the pattern to pick a d
My Pivot
Ashok Kumar Singha
My Pivot is an Indicator based on Pivot Lines and Support-Resistance zones. This Indicator will Plot 11 SR zones including Pivot Line which will definitely help you to understand the exact SR zones of the Market. Steps to Setup the Indicator: Install the Custom Indicator; Set all the Lines Color, Width and Styles; Set visualization to All Timeframe; and DONE It can be used for: All Pairs: Forex, Cryptocurrencies, Metals, Stocks, Indices.  All Timeframe All Brokers All type of Trading S
Cybertrade Auto Fibonacci retraction and projection  - MT5 Auto Fibonacci is an indicator that automatically plots the Fibonacci retracement and projection based on the number of bars you select in the indicator setting. You can customize nine different levels of retraction and three levels of projection. It works on periods longer than the period visible on the chart. All values ​​are available in the form of buffers to simplify possible automations. This indicator is the same one we use in ou
FREE
Signal Eskiya, in addition to channel lines, reflects entry signals in the form of arrows. Trading strategies using the channel indicator belong to the classic methods of technical analysis, are easy to execute, and therefore available even to beginners. Price ranges work equally well on any trading assets and timeframes, they can be used both independently and with additional confirmation from oscillators and market volumes. American traders say: “Trend is your friend”, which means “Trend is
CISD - CSD + High & Low ICT Indicator in MetaTrader 5 The CISD – CSD + High and Low Indicator is a powerful tool that plots key High and Low-price levels while highlighting CISD formations on the chart. Designed based on the ICT trading strategy , this MT5 indicator helps identify false breakouts at major price levels and marks CISD occurrences with arrows to signal trade opportunities.   CISD + High/Low Indicator Features Below is a breakdown of the CISD - CSD + High and Low Indicator specifica
FREE
BBVectorDynamics_Robot is an innovative trading advisor specifically designed for volatile markets. Based on unique algorithms for analyzing market forces and identifying imbalances between buyers and sellers, this advisor helps you make precise and well-considered decisions in the trading process. Main features of the bb vector dynamics_robot advisor: Calculation of dynamic vectors. System determines the differences between the extreme price values and smoothed averages over a specified perio
KT Price Border MT5
KEENBASE SOFTWARE SOLUTIONS
KT Price Border crea un canal de precios de tres bandas que identifica posibles zonas de máximos y mínimos en el mercado. Estos niveles también pueden utilizarse como soporte y resistencia dinámicos. La banda media también puede utilizarse para identificar la dirección de la tendencia, por lo que también funciona como un indicador de seguimiento de tendencias. Además, su facilidad de uso y la claridad de sus señales de trading benefician enormemente a los traders principiantes. Características
Displays trends in current chart. You can display trends of multiple timeframes in one chart by inserting this indicator as often as you want. Key features: displays trend line by finding highs and lows counts number of high/low of current trend in different color (long/short) allows you to display multiple timeframe trends in one chart Settings: Indicator Name: if you want to show M5 and H1 on one chart add TITrend twice to your current chart and rename M5 to "TITrendM5" and H1 to "TITrendH1" C
IndiceXperience
Mateus Silva Marques Dos Santos
Indicador para mercado de Índice Futuro Brasileiro (WIN) __________________________________________________________________________________________________ O indicador trabalha com rompimento de canal indicando o sentido do movimento e os 3 possíveis TP e o SL baseado no ATR. Indicação de utilização em TimeFrame de 5M, mas pode ser utilizado em qualquer tempo gráfico de sua preferencia. __________________________________________________________________________________________________
Identificador de Inside Bar
Rodrigo Oliveira Malaquias
Identificador de Inside Bar O Inside Bar é uma formação de vela de reversão / continuação, e é um dos padrões de Candle mais operados pelos trader. Esse indicador permite que você identifique um O Inside Bar no gráfico de forma rápida e fácil, lhe permitindo uma tomada de decisão muito rápida e precisa. Sendo ideal para lhe ajudar nas suas diversas estratégias de Day Trade ou swing trade. O visual e a marca registrada da análise gráfica por esse motivo esse indicador conta com 3 opções visuais p
WT Vwap Bands
Ricardo Almeida Branco
The WT Vwap Bands indicator is an indicator that combines price and volume, helping to show whether the price is within the "fair price", overbought or oversold. The indicator code was designed for performance and has already been tested in a real trading account. In addition to the visual inputs (color, thickness and line style), the user can define a% value that depends on the price. The default values work with the most distant band at 1% of the price and then dividing this distance in
The Rocket Trend indicator is trending. The indicator draws two-color points connected by lines along the chart. This is a trend indicator, it is an algorithmic indicator. It is easy to work and understand when a blue circle appears, you need to buy, when a red one appears, sell. The indicator is used for scalping and pipsing, and has proven itself well. Rocket Trend is available for analyzing the direction of the trend for a specific period of time. Ideal for novice traders learning the laws o
Este indicador de múltiples períodos de tiempo y múltiples símbolos busca barras de pines. Combinado con sus propias reglas y técnicas, este indicador le permitirá crear (o mejorar) su propio sistema poderoso. Características Puede monitorear todos los símbolos visibles en su ventana Market Watch al mismo tiempo. Aplique el indicador a un solo gráfico y monitoree instantáneamente todo el mercado. Puede monitorear cada marco de tiempo, desde M1 hasta MN, y le envía una alerta en tiempo real cuand
ArcTracer
Syed Oarasul Islam
This Indicator draws Fibonacci Arc levels in two different ways. You can select whether to draw Fibonacci Arc levels based on your favourite ZigZag settings or you can let the indicator to draw Arc levels based on given number of bars or candles.  You can also set Mobile and Email notification for your favourite Arc levels individually. With this indicator you will not have to feel lonely as the it can generate Voice alerts, which will keep you focused on your trading and remove boredom.  Produc
AO Trade
Ka Lok Louis Wong
El sistema de AO Trade está diseñado específicamente para el comercio de tendencias, aprovechando los tiempos de subasta o de noticias como puntos de referencia para comparar con otros tiempos de pedido específicos y anticipar las tendencias del mercado. **Todos los parámetros de tiempo utilizados en el EA se basan en la hora de su terminal. Los diferentes brokers pueden operar en diferentes zonas horarias GMT, lo que puede variar aún más debido a los ajustes de horario de verano.** **Por favo
Gator
Eric Mangeni Wakho
Presentamos Gator Algo (Algoritmo Inteligente), un Asesor Experto (EA) avanzado diseñado con una combinación única de estrategia de oferta y demanda para darte una ventaja en el mercado. Aprovecha los indicadores Hull y Stochastic Trend para entradas y salidas precisas. Con notificaciones integradas de Telegram, estarás informado en tiempo real de todas las acciones comerciales. Gator Algo combina automatización de vanguardia con un enfoque estratégico que utiliza IA para ayudarte a maximizar la
Four MA on OBV
Danton Dos Santos Sardinha Junior
Four MA on OBV - ¡Su Guía Definitiva para el Éxito en el Trading! Desbloquee el verdadero potencial de sus operaciones con el indicador Four MA on OBV . Diseñado exclusivamente para la plataforma MetaTrader 5, este potente indicador combina cuatro medias móviles con el On-Balance Volume (OBV) para proporcionar señales precisas y fiables. Características Técnicas: Cuatro Medias Móviles: Integración de medias móviles simples, exponenciales, suavizadas y lineales para un monitoreo detallado de l
mql4 version:  https://www.mql5.com/en/market/product/44606   Simple indicator to calculate profit on fibonacci retracement levels with fixed lot size, or calculate lot size on fibonacci levels with fixed profit. Add to chart and move trend line to set the fibonacci retracement levels. Works similar as default fibonacci retracement line study in Metatrader. Inputs Fixed  - select what value will be fix, lot or profit Fixed value  - value that will be fix on all levels Levels  - levels for which
Adaptive Trend Lines
Henri Salvatore Bigatti
4.75 (24)
This indicator shows the TLH and TLL and some trendlines that allow us to estimate the trend of market.  It also shows the values of the angles of the lines in percentage in points (pip) , the standard deviation, and the trend of each line, and when it breaks the lines of support and resistance (TLH and TLL). And finally, it also shows the points identified as supports and resistances through the fractal algorithm in the graph. The high and low trend lines are supported by the highs and lows, th
FREE
FibExtender
Syed Oarasul Islam
This Indicator draws Fibonacci Extension levels in two different ways. You can select whether to draw Fibonacci Extension levels based on your favourite ZigZag settings or you can let the indicator to draw Fibonacci Extension  level based on given number of Bars or Candles.  You can also set Mobile and Email notification for your favourite Extension  levels individually. With this indicator you will not have to feel lonely as the it can generate Voice alerts, which will keep you focused on your
Los compradores de este producto también adquieren
TPSpro RFI Levels MT5
Roman Podpora
4.55 (20)
INSTRUCCIONES       RUSO   -   ING        Se   recomienda utilizar con un indicador.       -       TPSpro   TENDENCIA PRO -   Versión MT5 Un elemento clave en el trading son las zonas o niveles desde los que se toman las decisiones de compra o venta de un instrumento de trading. A pesar de los intentos de los principales actores de ocultar su presencia en el mercado, inevitablemente dejan rastros. Nuestra tarea era aprender a identificar estos rastros e interpretarlos correctamente. Funciones p
CBT Quantum Maverick Sistema de Comercio de Opciones Binarias de Alta Eficiencia CBT Quantum Maverick es un sistema de opciones binarias de alto rendimiento diseñado para traders que buscan precisión, simplicidad y un enfoque disciplinado. No requiere personalización: el sistema está optimizado para resultados efectivos desde el primer momento. Simplemente sigue las señales, que se pueden dominar con un poco de práctica. Características clave: Precisión de señales: Señales basadas en la próxim
Visual Heatmap Book Analyzer
Alexandre Moraes De Souza Lima
Visual Heatmap Book Analyser This indicator monitors the market liquidity and generates colors based on order patterns, quantities, and renewal activities in the book. This allows you to visualize the order flow and identify areas of high and low liquidity and activity. The indicator uses machine learning techniques to analyze the order behavior in the book, enabling it to detect patterns and trends in orders, allowing you to make informed decisions about your trading operations. The color pale
Pro Thunder V10: ¡El Indicador Definitivo para Operaciones de Opciones Binarias! Lleva tu trading al siguiente nivel con Pro Thunder V10 , el pináculo de las operaciones con opciones binarias. Impulsado por tecnología avanzada de Redes Neuronales con IA , este indicador revolucionario está diseñado para ofrecer precisión y confiabilidad incomparables. Desde señales en tiempo real que no se repintan hasta un rendimiento impecable en condiciones de mercado volátiles, Pro Thunder V10 es t
MetaForecast M5
Vahidreza Heidar Gholami
5 (3)
MetaForecast predice y visualiza el futuro de cualquier mercado basándose en las armonías de los datos de precios. Aunque el mercado no siempre es predecible, si existe un patrón en el precio, MetaForecast puede predecir el futuro con la mayor precisión posible. En comparación con otros productos similares, MetaForecast puede generar resultados más precisos al analizar las tendencias del mercado. Parámetros de entrada Past size (Tamaño del pasado) Especifica el número de barras que MetaForecast
PZ Trend Trading MT5
PZ TRADING SLU
3.8 (5)
Trend Trading es un indicador diseñado para sacar el máximo provecho posible de las tendencias que tienen lugar en el mercado, mediante el cronometraje de retrocesos y rupturas. Encuentra oportunidades comerciales al analizar qué está haciendo el precio durante las tendencias establecidas. [ Guía de instalación | Guía de actualización | Solución de problemas | FAQ | Todos los productos ] Opere en los mercados financieros con confianza y eficiencia Aproveche las tendencias establecidas sin ser
RelicusRoad Pro MT5
Relicus LLC
4.78 (18)
Ahora $ 147 (aumentando a $ 499 después de algunas actualizaciones) - Cuentas ilimitadas (PC o Mac) Manual de usuario de RelicusRoad + Videos de capacitación + Acceso al grupo privado de Discord + Estado VIP UNA NUEVA MANERA DE VER EL MERCADO RelicusRoad es el indicador comercial más poderoso del mundo para divisas, futuros, criptomonedas, acciones e índices, y brinda a los comerciantes toda la información y las herramientas que necesitan para mantenerse rentables. Brindamos análisis técnico
This indicator is based on the mathematics of the great trader W.D. Ganna. With its help, you can easily find strong levels by analyzing swings to find the optimal entry point. The indicator works on all instruments and all timeframes. The indicator is fully manual and has control buttons. All you need to do is press the NEW button, a segment will appear, which you can place on any movement, swing or even 1 candle that you want to analyze. By placing the segment, press the OK button. A grid (th
CONTACT US  after purchase to get the Indicator Manual. Try Now—Limited Discount for the next 10 Buyers! Download the  Metatrader 4 Version Read the product description carefully before purchasing the product.  Due to regulatory restrictions, our service is unavailable in certain countries such as India, Pakistan, and Bangladesh. Disclaimer: • Our products are available only on mql5.com. • We never contact anyone or sell our products privately. • We do not provide any personal trading advice.
This indicator identifies and displays zones, as it were areas of strength, where the price will unfold. The indicator can work on any chart, any instrument, at any timeframe. The indicator has two modes. The indicator is equipped with a control panel with buttons for convenience and split into two modes. Manual mode: To work with manual mode, you need to press the NEW button, a segment will appear. This segment is stretched over the movement and the LVL button is pressed. The level is displayed
PZ Swing Trading MT5
PZ TRADING SLU
5 (5)
Swing Trading es el primer indicador diseñado para detectar oscilaciones en la dirección de la tendencia y posibles oscilaciones de reversión. Utiliza el enfoque de intercambio de línea de base, ampliamente descrito en la literatura comercial. El indicador estudia varios vectores de precios y tiempos para rastrear la dirección de la tendencia agregada y detecta situaciones en las que el mercado está sobrevendido o sobrecomprado y listo para corregir. [ Guía de instalación | Guía de actualización
LIMITED! JUST 10 COPIES AVAILABLE!  BONUS AUX VIP Club 2024 : Include EA CAP, CEP, LDH, PSC307 & AO4C to enhance the performance of this tool to its maximum potential  Click Here to Download Files   ( for users only ) FREE Trading Education Available Daily via Zoom --- For More Info or Instant Message Click link ---  https://t.me/abcdwave Transform your trading with the "Five Magic Bullets" Indicator, tailored for traders who embrace the power of Elliott Wave Chaos Theory. Spec
TPA True Price Action indicator reveals the true price action of the market makers through 100% non-repainting signals strictly at the close of a candle! TPA shows entries and re-entries, every time the bulls are definitely stronger than the bears and vice versa. Not to confuse with red/green candles. The shift of power gets confirmed at the earliest stage and is ONE exit strategy of several. There are available now two free parts of the TPA User Guide for our customers. The first "The Basics"
Elliott Wave Trend was designed for the scientific wave counting. This tool focuses to get rid of the vagueness of the classic Elliott Wave Counting using the guideline from the template and pattern approach. In doing so, firstly Elliott Wave Trend offers the template for your wave counting. Secondly, it offers Wave Structural Score to assist to identify accurate wave formation. It offers both impulse wave Structural Score and corrective wave Structure Score. Structural Score is the rating to sh
Introduction to Fractal Pattern Scanner Fractal Indicator refers to the technical indicator that makes use of the fractal geometry found in the financial market. Fractal Pattern Scanner is the advanced Fractal Indicator that brings the latest trading technology after the extensive research and development work in the fractal geometry in the financial market. The most important feature in Fractal Pattern Scanner is the ability to measure the turning point probability as well as the trend probabil
Hello I Want to introduce The Forex Buy Sell Arrow Premium MT5 i recently release this premium indicator! its 1000% Non Repaint Indicator, It Work Perfectly Well,, i tested it day by day, Just mind blowing Result,  Including Powerful trend Algorithm! How It Work? well, it work market trend formula, when trend Bullish Or when trend Bearish,  Recommend Timeframe M30, H1 it work all timeframe, and all currency pair, 100% non repaint, How to take signal From Forex Buy Sell Arrow Premium Ind
Volume by Price MT5
Brian Collard
3.25 (4)
Volume Profile, Footprint and Market Profile TPO (Time Price Opportunity). Volume and TPO histogram bar and line charts. Volume Footprint charts. TPO letter and block marker collapsed and split structure charts. Static, dynamic and flexible range segmentation and compositing methods with relative and absolute visualizations. Session hours filtering and segment concatenation with Market Watch and custom user specifications. Graphical layering, positioning and styling options to suit the user's a
Happy entries
Godwill Fortune Otieno Juma
The  product gives optimized entries for 3min ,1 hr and day timeframes  Does well with indices  ASIAN- HK50 AND CHINA A50 USA-US30,US100,US500 GER40 ,UK100 For stocks trade with the day timeframes Happy Entry employs advanced algorithms and real-time data analysis to identify optimal entry points with unprecedented accuracy. Its adaptive nature allows it to seamlessly adjust to changing market conditions, ensuring you never miss out on profitable opportunities. Whether you're a beginner or seas
FxaccurateLS
Shiv Raj Kumawat
WHY IS OUR FXACCCURATE LS MT5 THE PROFITABLE ? PROTECT YOUR CAPITAL WITH RISK MANAGEMENT Gives entry, stop and target levels from time to time. It finds Trading opportunities by analyzing what the price is doing during established trends. POWERFUL INDICATOR FOR A RELIABLE STRATEGIES We have made these indicators with a lot of years of hard work. It is made at a very advanced level. Established trends provide dozens of trading opportunities, but most trend indicators completely ignore them! The
AT Forex Indicator MT5
Marzena Maria Szmit
5 (5)
The AT Forex Indicator MT5 is a sophisticated trading tool designed to provide traders with a comprehensive analysis of multiple currency pairs. This powerful indicator simplifies the complex nature of the forex market, making it accessible for both novice and experienced traders. AT Forex Indicator uses advanced algorithms to detect trends, patterns and is an essential tool for traders aiming to enhance their forex trading performance. With its robust features, ease of use, and reliable signal
Este es posiblemente el indicador de reconocimiento automático de formación de precios más completo que puede encontrar para la plataforma MetaTrader. Detecta 19 patrones diferentes, toma las proyecciones de Fibonacci tan en serio como usted, muestra la zona de reversión potencial (PRZ) y encuentra niveles adecuados de stop-loss y take-profit. [ Guía de instalación | Guía de actualización | Solución de problemas | FAQ | Todos los productos ] Detecta 19 formaciones de precios armónicos diferen
TrendMaestro5
Stefano Frisetti
note: this indicator is for METATRADER4, if you want the version for METATRADER5 this is the link:  https://www.mql5.com/it/market/product/108106 TRENDMAESTRO ver 2.4 TRENDMAESTRO recognizes a new TREND in the bud, he never makes mistakes. The certainty of identifying a new TREND is priceless. DESCRIPTION TRENDMAESTRO identifies a new TREND in the bud, this indicator examines the volatility, volumes and momentum to identify the moment in which there is an explosion of one or more of these data a
Elliot Waves Analyzer Pro
Viktor Weidenthal
2.67 (3)
Elliot Waves Analyzer Pro calculates Elliot Waves to Help Identify Trend direction and Entry Levels. Mainly for Swing Trading Strategies. Usually one would open a Position in trend direction for Wave 3 or a Correction for Wave C . This Indicator draws Target Levels for the current and next wave. Most important Rules for Elliot Wave Analysis are verified by the Indicator.  The Pro version analyzes Multiple Timeframes and shows the Subwaves and Target-Levels.   For an Overview  " Elliot Waves Anal
Introduction to X3 Chart Pattern Scanner X3 Cherart Pattern Scanner is the non-repainting and non-lagging indicator detecting X3 chart patterns including Harmonic pattern, Elliott Wave pattern, X3 patterns, and Japanese Candlestick patterns. Historical patterns match with signal patterns. Hence, you can readily develop the solid trading strategy in your chart. More importantly, this superb pattern scanner can detect the optimal pattern of its kind. In addition, you can switch on and off individu
VIP Buy Sell Signals
Hapu Arachchilage Tharindu Lakmal
Contact me through this email aaddress to download the FREE strategy PDF for this indicator tharindu999lakmal@gmail.com Introduction   The   "Buy Sell Signals"   is designed to provide BUY and SELL trade signals based on the current market conditions.   A   Trading Strategy   (Chee sheet)  has been  provided for this trading indicator.   (Read the description). This indicator has time tuned e ntry signals . so,   you will enter the market at the very best price level   with this indicator .  
Seconds Charts
Aleksandr Goryachev
Micro  ******************* Секундные графики MT5 ********************** Более точного инструмента для входа в сделку вы не найдёте. Входные параметры: Timeframe, sek - период построения графика, секунды Displayed bars - отображаемые бары Step of price levels, pp, 0-off - шаг отрисовки ценовых уровней, пункты Scale points per bar, 0-off - масштаб в пунктах на бар Show lines - отображение текущих уровней Show comment - отображение комментария Standard color scheme - стандартная цветовая сх
Weis Wave with Alert MT5
Trade The Volume Waves Single Member P.C.
4.94 (16)
Rental/Lifetime Package Options and Privileges  Rent Monthly Six Months   Yearly/Lifetime Weis Wave with Speed with Alert+Speed Index x x x Manual  x x x Quick Set up Video x x x Blog x x x Lifetime Updates x x x Setup and Training Material x x Discord Access Channel "The SI traders"          x Rectangle Break Alert Tool      x How to trade with it:    http://www.tradethevolumewaves.com   ** If you purchase please contact me to setup your  : Two hour  webinar and  training Room and  complet
DESCRIPCIÓN ICSM (Impulse-Correction SCOB Mapper) es el indicador que analiza el movimiento del precio e identifica impulsos válidos, correcciones y SCOBs (Single Candle Order Block). Es una herramienta poderosa que se puede utilizar con cualquier tipo de análisis técnico porque es flexible, informativa, fácil de usar y mejora sustancialmente la conciencia del trader sobre las zonas de interés más líquidas. CONFIGURACIÓN General | Visuales Tema de color — define el tema de color del ICSM.
VTrende Pro
Andrii Diachenko
5 (1)
VTrende Pro - MTF indicator for trend trading with a display panel for MT5 *** Videos can be translated into any language using subtitles (video language - Russian) Although the signals of the VTrende Pro indicator can be used as signals of a full-fledged trading system, it is recommended to use them in conjunction with the Bill Williams TS. VTrende Pro is an extended version of the VTrende indicator. Difference between Pro version and VTrende: - Time zones - Signal V - signal 1-2 waves -    S
Introduction to Chart Pattern MT Chart Pattern MT is a chart pattern scanner to detect the triangle pattern, falling wedge pattern, rising wedge pattern, channel pattern and so on. Chart Pattern MT uses highly sophisticated chart pattern detection algorithm. However, we have designed it in the easy to use with intuitive user interface. Chart Pattern MT will show all the patterns in your chart in the most efficient format for your trading. You do not have to do tedious manual pattern detection an
Otros productos de este autor
¿Cuántas veces ha buscado un PIVOT que funcione en una vela específica cada día? A muchos operadores les gusta estimar la dirección de la tendencia del día basándose en un momento específico cada día, como 30 minutos después de la apertura del mercado, o a las 12 del mediodía, etc. Este indicador le permite especificar una hora determinada (hora y minuto) y traza un pivote desde esa hora hasta el día siguiente a la misma hora. Muestra cinco líneas basadas en esa hora/vela concreta: mediana, m
FREE
Keltner-Enhanced mejora la precisión y legibilidad de los Canales Keltner con muchas opciones para ajustarlos y más cinco cálculos de precios más allá del predeterminado META. El indicador Keltner-E es un indicador de bandas similar a las Bandas de Bollinger y a las Envolventes de Medias Móviles. Consisten en una envolvente superior por encima de una línea media y una envolvente inferior por debajo de la línea media.  Los principales acontecimientos a tener en cuenta al utilizar los canales d
FREE
El Jurik Advanced MA (JurMA) es un "non-repaint" indicador técnico desarrollado sobre el JMA original concebido por Mark Jurik.  Está diseñado para reducir el desfase presente en las medias móviles tradicionales, mejorar la suavidad y reducir el ruido. JurMA se adapta a la volatilidad del mercado y el usuario puede ajustar su sensibilidad, lo que lo hace útil para identificar tendencias y retrocesos en los mercados financieros. Esta adaptabilidad y eficacia lo hacen popular entre operadores y
Trend On Close
David Ben Svaiter
TrendOnClose es un sofisticado indicador diseñado para inversores en mercados binarios, centrado en el análisis estadístico de tendencias y contra-tendencias dentro de ciclos de velas específicos. Cada ciclo se define por el precio de CIERRE de la vela, estableciendo la dirección de la tendencia (ARRIBA/ABAJO - BULL/BEAR) para el posterior análisis estadístico hasta el inicio del siguiente ciclo. El análisis estadístico opera con dos configuraciones: ⦁ Objetivo Estadístico como VELA SUBSECUEN
HAshi-E es una forma mejorada de analizar las señales Heiken-Ashi. Información: Heiken-Ashi es especialmente valorado por su capacidad para filtrar la volatilidad a corto plazo, lo que lo convierte en una herramienta preferida para identificar y seguir tendencias, ayuda en la toma de decisiones sobre puntos de entrada y salida, y ayuda a distinguir entre señales falsas y auténticos cambios de tendencia. A diferencia de los gráficos de velas tradicionales, las velas Heiken-Ashi se calculan uti
Diseñado por Welles Wilder para gráficos diarios de materias primas, el ADXW es utilizado actualmente en diversos mercados por operadores técnicos para evaluar la fuerza de una tendencia o incluso una tendencia para operaciones a corto o largo plazo. El ADXW utiliza un indicador direccional positivo (DI+) y negativo (DI-) además de su línea de tendencia (ADX). Según Wilder, una tendencia tiene fuerza cuando la señal del ADX es superior a 25; la tendencia es débil (o el precio no tiene tendenc
En el ámbito del análisis técnico, ParbMA emerge como una herramienta altamente intuitiva para examinar la tendencia del Parabolic SAR. Este enfoque innovador aprovecha una línea personalizable, distinguida por su versatilidad en opciones de color, forma y anchura. Tal flexibilidad mejora el análisis visual y ayuda significativamente en la planificación estratégica y la toma de decisiones. El ParbMA (Media Móvil Parabólica) es un indicador técnico personalizado que combina los conceptos del Pa
Slow AMA
David Ben Svaiter
Compared to simple or exponential moving averages, slow adaptive trend lines might offer a more nuanced view of the trend by adjusting their sensitivity based on market conditions. However, their slow nature might also mean they are late in signaling reversals when market conditions change rapidly - and that is the difference between them and our SlowAMA . SlowAMA was designed to be a better long-term trend indicator than EMA and other Moving Averages. It uses our JurMA calculations, reducing
HAshi-E es una forma mejorada de analizar las señales Heiken-Ashi. Información: Heiken-Ashi es especialmente valorado por su capacidad para filtrar la volatilidad a corto plazo, lo que lo convierte en una herramienta preferida para identificar y seguir tendencias, ayuda en la toma de decisiones sobre puntos de entrada y salida, y ayuda a distinguir entre señales falsas y auténticos cambios de tendencia. A diferencia de los gráficos de velas tradicionales, las velas Heiken-Ashi se calculan uti
¿Cuántas veces ha buscado un PIVOT que funcione en un intervalo de tiempo específico cada día? A muchos operadores les gusta estimar la dirección de la tendencia del día basándose en un intervalo de tiempo específico cada día, como desde 2 horas antes de la apertura de la Bolsa de Nueva York hasta 1 hora después, o desde la apertura de la Bolsa de Nueva York hasta 30 minutos después. Este indicador le permite especificar un intervalo de tiempo determinado (hora y minuto) y traza un pivote des
VIDYA Enhanced
David Ben Svaiter
El indicador VIDYA-ENHANCED (Promedio Dinámico de Índice Variable) es una herramienta de análisis técnico utilizada para identificar tendencias y movimientos laterales. Ajusta dinámicamente su sensibilidad en función de la volatilidad del mercado, utilizando el Chande Momentum Oscillator como índice de volatilidad. Esta característica permite a VIDYA-ENHANCED ser más ágil durante los periodos de movimientos significativos de los precios, permaneciendo más estable durante las fases menos voláti
Filtro:
No hay comentarios
Respuesta al comentario