• Información general
  • Comentarios
  • Discusión

MP Custom Levels for MT5

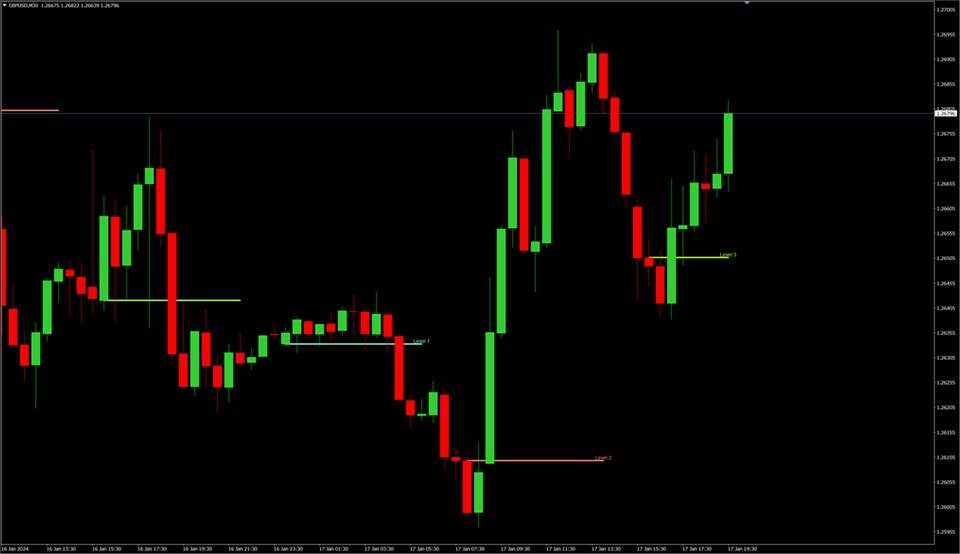
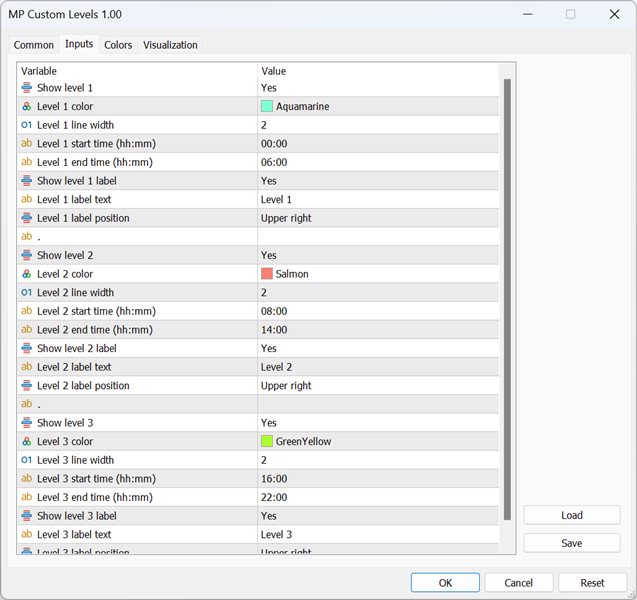
This utility identifies certain candle open times on chart, this can help you to see your favorite candle open and use it as it fits in your strategy.
This tool is very useful for intraday charting and indicating your sessions.
___________________________________________________________________________________

Disclaimer:
Do NOT trade or invest based upon the analysis presented on this channel. Always do your own research and due diligence before investing or trading. I’ll never tell you what to do with your capital, trades or investments. I’ll also never recommend for you to buy, sell, long or short any asset, commodity, security, derivative or cryptocurrency related instrument as it's extremely HIGH RISK! You should always consult with a professional/licensed financial adviser before trading or investing in any type of assets.
Productos recomendados
Touch VWAP MT5
Danrlei Hornke
5 (2)
O Touch VWAP é um indicador que permite calcular uma Média Ponderada por Volume (VWAP) apenas apertando a tecla 'w' no seu teclado e após clicando no candle do qual deseja realizar o calculo, clicando abaixo do candle é calculada a VWAP baseado na minima dos preços com o volume, clicando sobre o corpo do candle é calculado uma VWAP sobre o preço medio com o volume e clicando acima do candle é calculado uma VWAP baseado na máxima dos preços com o volume, voce tambem tem a opção de remover a VWAP
FREE
This indicator is stand alone version from  MP Pivot Levels  (All in one) containing Demark's Pivots. Calculations:     PP = X / 4     R1 = X / 2 - LOWprev     S1 = X / 2 - HIGHprev Uses: When the pair currency price may change the direction of movement. Possible constraints of support and resistance that creates plateaus for the currency pair prices. Tendency identification by comparing the present prices according to current day's pivot point and also the prior day's pivot points. ____________
FREE
Cybertrade Keltner Channels
Emanuel Andriato
4.75 (4)
Cybertrade Keltner Channels - MT5 Created by Chester Keltner, this is a volatility indicator used by technical analysis. It is possible to follow the trend of financial asset prices and generate support and resistance patterns. In addition, envelopes are a way of tracking volatility in order to identify opportunities to buy and sell these assets. It works on periods longer than the period visible on the chart. All values ​​are available in the form of buffers to simplify possible automations.
FREE
Santa Donchian
Marco Aurelio Cestari
4.5 (2)
Santa Donchian Indicator  is an efficient way to detect support, resistence and break outs in any market. The Donchian channel measures the high and the low of a previously defined range.  Typically, a trader would look for a well-defined range and then wait for the price to break out to either one side for a trade entry trigger. Advantages Never repaints, never backpaints, never recalculates. Works in all symbols and all timeframes. Perfect trend filter for any strategy or expert advisor. Full
FREE
Rejection Zones
Paulo Henrique Faquineli Garcia
Este poderoso indicador analisa o gráfico e mostra zonas de Rejeição de Preços! Isto é, locais onde o preço foi, mas não foi aceito pelo mercado! A visualização desta zona de Rejeição, facilita o entendimento do trader na tomada de decisões de onde operar e como operar! O indicador é composto por 4 linhas, sendo classificadas em 2 grupos: Linhas Vermelha e Amarela: Denotam os extremos onde o preço conseguiu chegar, mas não foi aceito! Linhas Laranja e Azul: A partir delas, denotam o Início da z
FREE
Stackable VWAP
Flavio Javier Jarabeck
3.5 (4)
Volume Weighted Average Price (VWAP) is a trading benchmark commonly used by Big Players that gives the average price a Symbol has traded throughout the day. It is based on both Volume and price. Additionally we put in this indicator the MVWAP (Moving Volume Weighted Average Price). For those who do not know the usage and the importance od this indicator I recommend a great article about this subject at Investopedia ( https://www.investopedia.com/articles/trading/11/trading-with-vwap-mvwap.asp
FREE
Bounce Zone MT5
Nguyen Thanh Cong
4.43 (7)
Introduction The Bounce Zone indicator is a cutting-edge non-repainting technical tool built to identify key areas on the price chart where market sentiment is likely to cause a significant price reversal. Using advanced algorithms and historical price data analysis, this indicator pinpoints potential bounce zones. Combined with other entry signal, this indicator can help forex traders place the best trades possible Signal A possible buy signal is generated when price is in the green zone an
FREE
MIDAS Super VWAP
Flavio Javier Jarabeck
4.44 (9)
Imagine VWAP, MVWAP and MIDAS in one place... Well, you found it! Now you can track the movement of Big Players in various ways, as they in general pursue the benchmarks related to this measuring, gauging if they had good execution or poor execution on their orders. Traders and analysts use the VWAP to eliminate the noise that occurs throughout the day, so they can measure what prices buyers and sellers are really trading. VWAP gives traders insight into how a stock trades for that day and deter
FREE
This indicator is based on Mr. Mark Fisher's ACD strategy, based on the book "The Logical Trader." - OR lines - A lines - C lines - Daily pivot range - N days pivot range - Customizable trading session - Drawing OR with the desired time Drawing levels A and C based on daily ATR or constant number - Possibility to display daily and last day pivots in color zone - Displaying the status of daily PMAs (layer 4) in the corner of the chart - Show the order of daily pivot placement with multi-day piv
FREE
Candle Timer Simple
Jithin Sajan Sajan
5 (1)
SETTINGS Make sure to select Chart shift option in the chart.   (Right click in the chart ---> Properties (dialog box) ----> Select Chart Shift) Kindly rate and comment about the product for upgradation & Support When using candlestick timers, keep in mind that the timing of candlestick patterns can play a crucial role in your trading strategy. For instance, different timeframes (such as 1-minute, 5-minute, hourly, ) can provide varying insights into price movements and trends. Make sure to i
FREE
Economic Markers
Flavio Javier Jarabeck
4.79 (14)
Easily get all relevant economic events of the current day right into your chart, as markers. Filter what kind of markers do you want: by country (selected individually) and by Importance (High relevance, Medium, Low or any combination of these). Configure the visual cues to your liking. If there is more than one event set to the very same time, their Names will be stacked and you will see the messages merged with the plus (+) sign on the marker. Obviously that long or too much events on the sam
FREE
QuantumAlert Stoch Navigator is a free indicator available for MT4/MT5 platforms, its work is to provide "alerts" when the market is inside "overbought and oversold" regions in the form of "buy or sell" signals. This indicator comes with many customization options mentioned in the parameter section below, user can customise these parameters as needful. Join our   MQL5 group , where we share important news and updates. You are also welcome to join our private channel as well, contact me for the p
FREE
Rule Plotter Scanner
Francisco Gomes Da Silva
¿Alguna vez has pensado en tener un escáner que analice todas las estrategias y muestre los puntos de compra y venta en todos los marcos temporales de ese activo, todo al mismo tiempo? Eso es exactamente lo que hace este escáner. Este escáner fue diseñado para mostrar las señales de compra y venta que creaste en el Rule Plotter: creador de estrategias sin necesidad de programación y ejecutarlas dentro de este escáner en diversos activos y marcos temporales diferentes. La estrategia predeterminad
FREE
The Magic SMA indicator is of great help in determining trend direction. It can be an excellent addition to your existing strategy or the basis of a new one. We humans can make better decisions when we see better visually. So we designed it to show a different color for rising and falling trends. Everyone can customize this in the way that suits them best. By setting the Trend Period, we can optimize it for longer or shorter trends for our strategy. It is great for all time frames. IF YOU NEED
FREE
TG Ponto de Cobertura
Celestino Ferreira Gomes
TG Ponto de Cobertura (Coverage Trade) This Indicator checks your trading results on the day relative to the asset on the chart and adds a line at the price corresponding to the coverage point for the open position, considering the entry price and lot size. The coverage point will be recalculated after new entries, based on the average price of the open operation and the lot size. If the result for the day is zero, a line will be displayed at the price of the current trade. If the day's result
FREE
Pivot Point Fibo RSJ es un indicador que rastrea las líneas de soporte y resistencia del día utilizando las tasas de Fibonacci. Este espectacular indicador crea hasta 7 niveles de soporte y resistencia a través del Pivot Point utilizando las tasas de Fibonacci. Es fantástico cómo los precios respetan cada nivel de este soporte y resistencia, donde es posible percibir posibles puntos de entrada / salida de una operación. Características Hasta 7 niveles de soporte y 7 niveles de resistencia Es
FREE
Candle Timer 2X
Ronaldo Franco De Oliveira Cardoso
5 (5)
The RFOC Candle Timer 2x was created for the trader to locate himself in time, having access to the pending time for the formation of a new candle. Additionally, it is possible to include in the chart a second timer that shows the pending time for the formation of a new candle in a time period different from the current one.   The user will have the option to select up to 4 different positions for the timer display ("No candle", lower left corner, lower right corner or upper right corner). In ad
FREE
Strong movement levels
Nikolay Mitrofanov
5 (2)
Looks for strong price movements and draws levels upon their completion. You determine the strength of the movement yourself by specifying in the settings the number of points and the number of candles of the same color in a row in one direction. There are 2 types of building in the settings: extrenum - high / low close - close price You can also adjust the number of displayed levels and the number of candles for calculations. By default, the settings indicate 5 levels for 360 candles. That
FREE
Donchian Pro
Paulo Henrique Faquineli Garcia
5 (3)
The Donchian Channel Channels are among the most popular tools of technical analysis, as they visually convey to the analyst the limits within which most price movement tends to occur. Channel users know that valuable information can be obtained at any time, whether prices are in the central region of a band or close to one of the border lines. One of the best known techniques to explore these concepts is Bollinger Bands. However, John Bollinger was not the only one to research the application
FREE
Force Numbers
Flavio Javier Jarabeck
5 (1)
Several assets in several markets have the behavior of using specific numbers as Force Numbers, where support, resistance and price thrust is created. Let this indicator draw those levels of support and resistance for you. You can also stack it to show different level of Prices! This technique is being used by Tape Readers and Order Flow traders all over the world for a long time. Give it a try. Challenge yourself to study new ways of Price Action! SETTINGS What Price reference to use in the c
FREE
Candle Zones
Flavio Javier Jarabeck
You probably heard about Candlesticks behaviors, which in most of the times could denote and trace Volume behaviors even if you are not watching Volume itself... Well, this indicator will do this. Naked traders love to rely solely on candlesticks patterns and with Candle Zones you can trap special patterns and DRAW THEM on your chart. As simple as that. There are several filters you can tweak in order to achieve the analysis you want. Just give it a try. After several months of testing, we think
FREE
QuantumAlert RSI Navigator is a free indicator available for MT4/MT5 platforms, its work is to provide "alerts" when the market is inside "overbought and oversold" regions in the form of "buy or sell" signals. This indicator comes with many customization options mentioned in the parameter section below, user can customise these parameters as needful. Join our MQL5 group , where we share important news and updates. You are also welcome to join our private channel as well, contact me for the priva
FREE
Coral Indi
Dinh Duong Luong
Coral trend is   a trend-following indicator that is widely popular among FOREX traders . It is usually used as a confluence with other indicators. It uses combinations of moving averages with complex smoothing formulas! It has two configurable parameters: Coefficient   - smoothing ratio (*) Applied price Calculation: Coral = (-0.064) * B6 + 0.672 * B5 - 2.352 * B4 + 2.744 * B3
FREE
Pivot Reversal Free
Fyodor Korotkov
5 (1)
Hi there! Since I am starting commercial and non-commercial product publishing I would highly appreciate: If you like this product, please rate it. That will help to promote not only this product, but indirectly another ones. So, such promotion will help to make some money from commercial products. Thus, I will have opportunity to fund my another directions of trading researches like bot development using mql4 and mql5 programming languages as well as python written products like crypto bots. If
FREE
Support Resistance Indicator The "Support Resistance" indicator is a versatile tool designed to help traders identify key support and resistance levels based on an underlying algorithm. These levels indicate price points where an asset historically experiences buying (support) or selling (resistance) pressure. The indicator allows traders to visualize these levels on their charts, making it easier to make informed decisions. All Products   |   Contact PARAMETERS: Timeframe : Users can select the

FREE
Bollinger colorido
Sergio Domingues
5 (1)
Funciona como bandas de bollinger normais. Criado por Joe Ross, é um setup de maior risco por ser contra-tendência. Pode ser usado para Day Trade, Swing Trade e Position. Para identificar, é necessário inserir no gráfico as Bandas de Bollinger, com uma Média Móvel Simples de 20 períodos e largura (desvio) 2. Verifica-se um fechamento de determinado candle abaixo da banda inferior de Bollinger. Se o próximo candle fechar dentro das Bandas, marca-se a máxima dele. O rompimento dessa máxima será o
FREE
Super Trend eu
Emin Ulucanli
4.75 (4)
SUPERTREND; Es un indicador de seguimiento de tendencias basado en el SuperTrend ATR creado por Olivier Seban. Se puede utilizar para detectar cambios en la dirección de la tendencia y localizar paradas. Cuando el precio cae por debajo de la curva del indicador, se vuelve rojo e indica una tendencia bajista. Por el contrario, cuando el precio se mueve por encima de la curva, el indicador se vuelve verde, lo que indica una tendencia alcista. Al igual que otros indicadores, funciona bien en SuperT
FREE
Vegas indicador
Valter Cezar Costa
3.5 (2)
Esse Indicador é uma boa opção para quem gosta de operar a longo prazo e com paciência. Ele trabalho com os níveis de fibo na media de 200 são  9 níveis  onde você pode operar nas reversões o mercado partir do níveis abaixo.    Level 1 = 550 pontos    Level 2 = 890 pontos    Level 3 = 1440 pontos    Level 4 = 2330 pontos    Level 5 = 3770 pontos    Level 7 = 9870 pontos    Level 8 = 15970 pontos   Level 9 = 25840 pontos      Level 6 = 6100 pontos
FREE
Indicador de Sesiones de Trading El Indicador de Sesiones de Trading visualiza los puntos altos y bajos, así como los horarios de inicio y fin de las sesiones de trading de Asia, Londres y Nueva York directamente en tu gráfico. Funciones: Visualización de las principales sesiones de trading Resaltado de puntos altos y bajos Visualización de los horarios de inicio y fin de cada sesión Horarios de las sesiones personalizables Fácil de usar y eficiente Personalización: Cada sesión de trading (Asia,
FREE
BOS CHoCH and FVG
Saksham Solanki
4 (2)
Contact me for any queries or custom orders, if you want to use this in an EA. Key Features: Pattern Recognition : Identifies Fair Value Gaps (FVGs) Spots Break of Structure (BOS) points Detects Change of Character (CHoCH) patterns Versatile Application : Optimized for candlestick charts Compatible with any chart type and financial instrument Real-Time and Historical Analysis : Works seamlessly with both real-time and historical data Allows for backtesting strategies and live market analysis Vis
FREE
Los compradores de este producto también adquieren
Trade Assistant MT5
Evgeniy Kravchenko
4.41 (177)
Ayuda a calcular el riesgo por operación, la fácil instalación de una nueva orden, gestión de órdenes con funciones de cierre parcial, trailing stop de 7 tipos y otras funciones útiles. Materiales e instrucciones adicionales. Instrucciones de instalación   -   Instrucciones para la aplicación   -   Versión de prueba de la aplicación para una cuenta demo Función de línea -   Muestra en el gráfico la línea de apertura, Stop Loss, Take Profit. Con esta función es fácil establecer una nueva orden
Bienvenido a Trade Manager EA: la herramienta definitiva de gestión de riesgos diseñada para hacer que el trading sea más intuitivo, preciso y eficiente. No es solo una herramienta para realizar órdenes; es una solución integral para la planificación de operaciones, gestión de posiciones y control del riesgo. Ya seas un principiante, un trader avanzado o un scalper que necesita ejecuciones rápidas, Trade Manager EA se adapta a tus necesidades, ofreciendo flexibilidad en todos los mercados, desde
Local Trade Copier EA MT5
Juvenille Emperor Limited
4.98 (84)
Experimente una copia de operaciones excepcionalmente rápida con Local Trade Copier EA MT5 . Con su fácil configuración de 1 minuto, este copiador de operaciones le permite copiar operaciones entre múltiples terminales de MetaTrader en la misma computadora con Windows o en Windows VPS con velocidades de copiado ultra rápidas de menos de 0.5 segundos. Ya seas un trader principiante o profesional, el   Local Trade Copier EA MT5   ofrece una amplia gama de opciones para personalizarlo según tus ne
The product will copy all telegram signal to MT5 ( which you are member) , also it can work as remote copier.  Easy to set up, copy order instant, can work with almost signal formats, image signal,  s upport to translate other language to English Work with all type of channel or group, even channel have "Restrict Saving Content", work with  multi channel, multi MT5 Work as remote copier: with signal have ticket number, it will copy exactly via ticket number. Support to backtest signal. How to s
RiskGuard Management
MONTORIO MICHELE
5 (19)
ATENCIÓN: el experto no funciona en el probador de estrategias. Para una versión de prueba, visita mi perfil. Manual de instrucciones Para descargar el journal automático, visita mi perfil RiskGuard Management – Trading profesional, sin compromisos RiskGuard Management es el aliado definitivo para todo trader que desee maximizar sus ganancias y minimizar sus pérdidas mediante una gestión de riesgo avanzada. No es solo una herramienta: es un sistema inteligente que te ayuda a seguir tu plan de
Trade Dashboard MT5
Fatemeh Ameri
4.97 (70)
Tired of complex order placement and manual calculations? Trade Dashboard is your solution. With its user-friendly interface, placing orders becomes effortless, by a single click, you can open trades, set stop loss and take profit levels, manage trade lot size, and calculate risk to reward ratios, allowing you to only focus on your strategy. Say goodbye to manual calculations and streamline your trading experience with Trade Dashboard. Download  Demo Version  right now. You can find  Details of
MT5 to Telegram Signal Provider es una utilidad fácil de usar y completamente personalizable que permite enviar señales especificadas al chat, canal o grupo de Telegram, convirtiendo tu cuenta en un proveedor de señales . A diferencia de la mayoría de los productos competidores, no utiliza importaciones DLL. [ Demo ] [ Manual ] [ Versión MT4 ] [ Versión Discord ] [ Canal de Telegram ] Configuración Está disponible una guía del usuario paso a paso. No se requiere conocimiento de la API de Telegr
Trade Manager DaneTrades
Levi Dane Benjamin
4.58 (24)
Trade Manager para ayudarle a entrar y salir rápidamente de operaciones mientras calcula automáticamente su riesgo. Incluye funciones que le ayudarán a evitar el exceso de operaciones, las operaciones de venganza y las operaciones emocionales. Las operaciones se pueden gestionar automáticamente y las métricas de rendimiento de la cuenta se pueden visualizar en un gráfico. Estas características hacen que este panel sea ideal para todos los operadores manuales y ayuda a mejorar la plataforma Meta
Custom Alerts MT5
Daniel Stein
5 (7)
Custom Alerts: Monitorea varios mercados y no te pierdas ninguna oportunidad clave Descripción general Custom Alerts es una solución dinámica para traders que desean una forma consolidada de seguir posibles setups en múltiples instrumentos. Al integrar datos de nuestras herramientas principales —como FX Power, FX Volume y IX Power—, Custom Alerts te notifica automáticamente sobre eventos cruciales del mercado sin que tengas que manejar múltiples gráficos o arriesgarte a perder oportunidades im
Exp COPYLOT CLIENT for MT5
Vladislav Andruschenko
3.9 (31)
La copiadora comercial para MT5 es un comercio   copiadora para la plataforma МetaТrader 5 . Copia operaciones de forex entre   cualquier cuenta  MT5  - MT5, MT4  - MT5 para la versión COPYLOT MT5 (o MT4 - MT4 MT5  - MT4 para la versión COPYLOT MT4) Copiadora confiable! Versión MT 4 Descripción completa +DEMO +PDF Cómo comprar Cómo instalar    Cómo obtener archivos de registro    Cómo probar y optimizar    Todos los productos de Expforex También puede copiar operaciones en el terminal МТ4 ( МТ
Cerberus Equity Watcher
Samuel Bandi Roccatello
5 (3)
Cerberus the Equity Watcher es una herramienta de gestión de riesgos que monitorea constantemente   el valor de tu cuenta y evita drawdowns importantes, que sean ellos causados por EA defectuosos o por las emociones si eres un trader discrecional. Es extremadamente útil para los traders sistemáticos que confían en EA que pueden contener errores o que pueden no funcionar bien en condiciones de mercado inesperadas. Cerberus   permite establecer un valor mínimo de tu cuenta y (opcionalmente) un va
Telegram To MT5 Receiver
Levi Dane Benjamin
4.82 (11)
Copie las señales de cualquier canal del que sea miembro (incluidos los privados y restringidos) directamente a su MT5.  Esta herramienta ha sido diseñada pensando en el usuario al ofrecer muchas características que necesita para gestionar y monitorear las operaciones. Este producto se presenta en una interfaz gráfica fácil de usar y visualmente atractiva. ¡Personalice su configuración y comience a usar el producto en minutos! Guía del usuario + Demo  | Versión MT4 | Versión Discord Si desea p
Didi Alert Needle Detector
Alexandre Tadeu Molina
5 (7)
Alerta EA DIDI - Detector de agujas del ATM SYSTEMS ¿Está buscando una herramienta que le ayude a aprovechar las mejores oportunidades comerciales en los mercados financieros? Entonces necesita saber que DIDI Alert - Agulhadas Detector de ATM Systems es el único asesor en el mercado que utiliza la poderosa estrategia comercial Needles Setup de Didi Aguiar a través de DIDI INDEX, con una variedad de recursos disponibles, a diferencia de cualquier otro asesor dedicado a esta estrategia. ¡Tan com
KT Equity Protector MT5
KEENBASE SOFTWARE SOLUTIONS
4.67 (3)
KT Equity Protector EA supervisa continuamente el capital de la cuenta y cierra todas las órdenes de mercado y pendientes una vez que el capital alcanza un nivel de stop-loss o un objetivo de ganancias predefinido.  Después de cerrar todas las posiciones, el EA puede cerrar todos los gráficos abiertos para evitar que otros asesores expertos abran nuevas operaciones. Stop-Loss de Capital Si el saldo actual de su cuenta es de $5000 y establece un stop-loss de capital en $500, el KT Equity Protect
-25% discount ($149 -> $111) Everything for chart Technical Analysis indicator mt5 in one tool Draw your supply demand zone with rectangle and support resistance with trendline and get alerts to mobile phone or email alert -  Risk reward indicator mt5 Video tutorials, manuals, DEMO download   here .   Find contacts on my   profile . 1.   Extended rectangles and trendlines Object will be extended to the right edge of the chart when price will draw new candles on chart. This is rectangle extende
2025 happy new year -25% discount ($199 -> $149) Advanced trading tool: One click smart orders that execute under your conditions Developed by trader for trading community:  position size calculator (lot size), open position after price action, strategy builder, set and forget trading, mobile notifications... Risk Management -  Risk percentage position size calculator, gain percentage, target risk reward ratio, spread and commissions are included in calculations 7 Advanced order types  - Set a
HINN Lazy Trader
ALGOFLOW OÜ
5 (2)
Community, update news, feature discussions, complaints, suggestions, and first-line support are organized in a free Discord server . Use   Webmoney  to pay in crypto. Lazy Trader is your personal risk management assistant that independently finds the best market entries, manages positions, and helps you extract maximum profit from every trading idea! It monitors charts from M1 to W1 , finds optimal entry points based on your parameters, and manages trades without your involvement: -   Got a
The product will copy all  Discord  signal   to MT5   ( which you are member  ) , also it can work as remote copier.  Easy to set up. Work with almost signal formats, support to translate other language to English Work with multi channel, multi MT5. Work with Image signal. Copy order instant, auto detect symbol. Work as remote copier: with signal have ticket number, it will copy exactly via ticket number. How to setup and guide: Let read all details about setup and download Discord To MetaTrader
The Expert Advisor is a risk manager helping users to control their trading. In the settings, it is possible to specify the parameters at which the risk manager force closes the opened trades and closes the terminal as well, if it is needed to prevent opening trades on emotions, which do not correspond to the trading strategy. Risk Manager settings Check limit to close   - check the equity limit Limit to close   - minimum account equity triggering loss prevention measures Check day limit to cl
50% off. Original price: $375 Reward Multiplier is a semi-automatic trade manager based on pyramid trading that opens additional orders with the running profit of your trades to maximize return exponentially without increasing the risk. Unlike other similar EAs, this tool shows potential profit/loss and reward to risk ratio before even entering the first trade! Download Demo here  (starting lot is fixed at 0.01) Guide + tips here MT4 version   here You only open the first order. When your trade
OrderManager MT5
Lukas Roth
4.79 (19)
Presentamos el   OrderManager : Una herramienta revolucionaria para MT5 Gestiona tus operaciones como un profesional con la nueva utilidad Order Manager para MetaTrader 5. Diseñado con la simplicidad y la facilidad de uso en mente, Order Manager te permite definir y visualizar fácilmente el riesgo asociado con cada operación, permitiéndote tomar decisiones informadas y optimizar tu estrategia de trading. Para más información sobre OrderManager, por favor consulta el manual. [ Manual ] [ Versión
******************************* ***************** ********************** ***************** ********************** ************************* GoldMine Train es un EA de estrategia de trading de tendencias para oro. El operador determina la dirección de la tendencia principal y ordena al Train que avance. El Train comprará/venderá continuamente en la dirección. El volumen del lote dependerá del saldo de la cuenta y del índice de apalancamiento preestablecido. Cuando el operador cambia la direc
Telegram to MT5 Coppy
Sergey Batudayev
4.8 (5)
Telegram to MT5: The Ultimate Signal Copying Solution Simplify your trading with Telegram to MT5 , the modern tool that copies trading signals directly from Telegram channels and chats to your MetaTrader 5 platform, without the need for DLLs. This powerful solution ensures precise signal execution, extensive customization options, saves time, and boosts your efficiency. [Instructions ] [ DEMO ] Key Features Direct Telegram API Integration Authenticate via phone number and secure code. Easily man
Trend Line Optimizer MT5
Evgenii Aksenov
4.2 (10)
Este es un optimizador de parámetros automático para el indicador Trend Line PRO Fácil y rápidamente, seleccionará los parámetros óptimos para su indicador favorito Trend Line PRO.  La optimización toma solo unos segundos. El optimizador le permite encontrar los mejores parámetros para cada par y período: Amplitude, TP1-TP3, StopLoss, así como los valores para Time Filter y HTF Filter en la sección seleccionada de la historia (Days)  Para optimizar diferentes Marcos de tiempo, necesita un rang
Seconds Chart MT5
Boris Sedov
4.56 (16)
Seconds Chart — una herramienta única para crear gráficos en segundos en MetaTrader 5 . Con Seconds Chart , puede construir gráficos con marcos temporales definidos en segundos, proporcionando una flexibilidad y precisión de análisis ideales que no están disponibles en gráficos estándar de minutos u horas. Por ejemplo, el marco temporal S15 indica un gráfico con velas de 15 segundos. Puede utilizar cualquier indicador, asesor experto y script, trabajando con ellos tan fácilmente como con gráfico
Copiadora->Interfaz de interacción cómoda y rápida, los usuarios pueden usarla de inmediato       ->>>> Recomendado para usar en computadoras Windows o VPS Windows Características: Configuraciones de copy trading personalizadas y diversificadas: 1. Se pueden configurar diferentes modos de lote para diferentes fuentes de señal 2. Se pueden configurar diferentes fuentes de señal para copy trading hacia adelante y hacia atrás 3. Las señales se pueden configurar con comentarios 4. Si se debe calibr
Profit or Loss Pad
Vladislav Andruschenko
4.5 (10)
Cerrar posiciones en MetaTrader 5 al alcanzar la ganancia / pérdida total con la función de seguimiento de ganancias.   CloseIfProfitorLoss con seguimiento Puede habilitar las   paradas virtuales (orden separada)   , cálculo y cierre para   posiciones de COMPRA y VENTA por separado (COMPRA VENTA separada)   , cerrar y calcular   todos los símbolos o solo el símbolo actual (Todos los símbolos)   , habilitar trailing con fines de lucro (   Trailing   Profit) Las posiciones se cierran en función d
Uber Trade Manager
MDevaus Oy
4.87 (15)
UTM Manager es una herramienta intuitiva y fácil de usar que ofrece una ejecución comercial rápida y eficiente. Una de las características más destacadas es el modo "Ignorar spread", que le permite operar al precio de las velas, ignorando los spreads por completo (por ejemplo, permite operar con pares de spread más altos en LTF, evita que el spread lo saque de las operaciones). Otro aspecto clave del UTM Manager es su copiadora comercial local única, que permite la flexibilidad para ejecutar dif
Transform Your Trading with the MT5 to MT4/5 Local Trade Copier. Seamlessly bridge the gap between two trading platforms with a user friendly interface for a easy to use copier. User Guide + Demo  |   MT4 Version Local Trade Clone MT5 does not work in the Strategy Tester. For a   demo   please go to the   User Guide To Copy to MT4 you will need to purchase the MT4 version separately  Features Copy trades across MT4 and MT5 in any combination (MT4>MT4, MT4>MT5, MT5>MT4, MT5>MT5). Easy to use GU
DrawDown Limiter
Haidar, Lionel Haj Ali
5 (20)
Drawdown Limiter EA You are in the right place if you were searching for Drawdown control, Drawdown limiter, Balance protection, Equity Protection or Daily Drawdown Limit related to Prop Firm, FTMO, or Funded account trading, or if you want to protect your trading account. Have you suffered from controlling your drawdown when trading funded accounts? This EA is meant for you. Prop firms usually set a rule called “Trader Daily Drawdown”, and if it is not respected, you are disqualified.  I am an
Otros productos de este autor
MP Colored MACD for MT5
Pierre Ksachikian
5 (1)
MACD (short for   M oving   A verage   C onvergence/ D ivergence) is a popular trading indicator used in technical analysis of securities prices. It is designed to identify changes in the strength, direction, momentum, and duration of a trend in a security's price. History Gerald Appel created the MACD line in the late 1970s. Thomas Aspray added the histogram feature to Appel's  MACD in 1986. The three major components and their formula 1. The MACD line: First, "PM Colored MACD" employs two M
MP Squeeze Momentum is a volatility and momentum indicator derivated of "TTM Squeeze" volatility indicator introduced by John Carter. It capitalizes on the tendency for price to break out strongly after consolidating in a tight range. Introduction: The volatility component of MP Squeeze Momentum measures price compression using Bollinger Bands and Keltner Channels. If the Bollinger Bands are completely enclosed within the Keltner Channels, that indicates a period of very low volatility. This st
FREE
MP Heatmap for MT5
Pierre Ksachikian
5 (2)
A heatmap is a graphical representation of data in two dimensions, using colors to display different factors. Heatmaps are a helpful visual aid for viewers, enabling the quick dissemination of statistical or data-driven information. The MP Heatmap indicator provides a graphical representation of the relative strengths of major currencies compared to others, organizing data from pairs into color-coded results and producing a clear overview of the entire Forex market. The MP Heatmap indicator dis
FREE
MP Candle Countdown indicator with a progress bar is a tool used in technical analysis that displays the time remaining until the current candlestick on a chart closes, along with a progress bar that shows visually the amount of time that has elapsed since the candlestick opened. This indicator can be helpful for traders who use candlestick charting to make trading decisions, as it provides both a visual representation of the time left until a candlestick closes and an indication of how much ti
FREE
An “inside bar” pattern is a two-bar price action trading strategy in which the inside bar is smaller and within the high to low range of the prior bar, i.e. the high is lower than the previous bar’s high, and the low is higher than the previous bar’s low. Its relative position can be at the top, the middle or the bottom of the prior bar. The prior bar, the bar before the inside bar, is often referred to as the “mother bar”. You will sometimes see an inside bar referred to as an “ib” and its m
FREE
A pin bar pattern consists of one price bar, typically a candlestick price bar, which represents a sharp reversal and rejection of price. The pin bar reversal as it is sometimes called, is defined by a long tail, the tail is also referred to as a “shadow” or “wick”. The area between the open and close of the pin bar is called its “real body”, and pin bars generally have small real bodies in comparison to their long tails. The tail of the pin bar shows the area of price that was rejected, and t
FREE
The MP Andean Oscillator is used to estimate the direction and also the degree of variations of trends. It contains 3 components: Bull component, Bear component and Signal component. A rising Bull component indicates that the market is up-trending while a rising Bear component indicates the presence of down-trending market. Settings: Oscillator period: Specifies the importance of the trends degree of variations measured by the indicator. Signal line per: Moving average period of the Signal line
FREE
This indicator is stand alone version from  MP Pivot Levels  (All in one) containing Woodie Pivots. Woodie’s pivot points are made up of multiple key levels, calculated from past price points, in order to frame trades in a simplistic manner. The key levels include the ‘pivot’ itself, and multiple support and resistance levels (usually up to three each). Traders use these levels as a guide for future price movements when setting up trades. The pivot : (Previous high + previous low + 2 x previous
FREE
This indicator is stand alone version from  MP Pivot Levels  (All in one) containing Demark's Pivots. Calculations:     PP = X / 4     R1 = X / 2 - LOWprev     S1 = X / 2 - HIGHprev Uses: When the pair currency price may change the direction of movement. Possible constraints of support and resistance that creates plateaus for the currency pair prices. Tendency identification by comparing the present prices according to current day's pivot point and also the prior day's pivot points. ____________
FREE
MP SMI for MT5
Pierre Ksachikian
The purpose of using Smart money index (SMI) or smart money flow index is to find out investors sentiment. The index was constructed by Don Hays and measures the market action. The indicator is based on intra-day price patterns. The beginning of the trading day is supposed to represent the trading by retail traders. The majority of retail traders overreact at the beginning of the trading day because of the overnight news and economic data. There is also a lot of buying on market orders and shor
FREE
Candle size oscillator is an easy to use tool to figure out candle size from highest to lowest price of each candle. It's a powerful tool for price action analysts specifically for those who works intraday charts and also a perfect tool for short term swing traders. Kindly note that you can also edit the Bullish and Bearish candles with different colors. #Tags: Candle size, oscillator, price action, price range, high to low, candle ticks __________________________________________________________
FREE
MP Trend Scanner for MT4
Pierre Ksachikian
4 (1)
This trend scanner indicator is using two main indicators to identify trends. Frist the EMAs to provide a view on Bullish / Bearish momentum. When the shorter EMA (calculated off more recent price action) crosses, or is above, the slower moving EMA (calculated off a longer period of price action), it suggests that the market is in an uptrend. Second the Stochastic RSI, When RSI is < 20 it is considered oversold, and when > 80 it is overbought. These conditions suggests that momentum is very str
FREE
MP Inside Bar
Pierre Ksachikian
5 (2)
An “inside bar” pattern is a two-bar price action trading strategy in which the inside bar is smaller and within the high to low range of the prior bar, i.e. the high is lower than the previous bar’s high, and the low is higher than the previous bar’s low. Its relative position can be at the top, the middle or the bottom of the prior bar. The prior bar, the bar before the inside bar, is often referred to as the “mother bar”. You will sometimes see an inside bar referred to as an “ib” and its m
FREE
This indicator is stand alone version from  MP Pivot Levels  (All in one) containing Woodie Pivots. Woodie’s pivot points are made up of multiple key levels, calculated from past price points, in order to frame trades in a simplistic manner. The key levels include the ‘pivot’ itself, and multiple support and resistance levels (usually up to three each). Traders use these levels as a guide for future price movements when setting up trades. The pivot : (Previous high + previous low + 2 x previous
FREE
MP Relative Bandwidth Filter (RBF) is created to be used to identify your trading zones based on volatility. This easy to use technical indicator attempts to compare between Bandwidth of higher length and ATR of lower length to identify the areas of low and high volatility: Relative Bandwidth = Bandwidth / ATR The Bandwidth is based on Bollinger Band which its length ideally needs to be higher and ATR length needs to be ideally lower. After calculating Relative Bandwidth, the Bollinger Band is
FREE
This creative simple indicator will provide a precise framework for market sentiment within technical analysis of different timeframes. For instance, for traders like me that uses   "Mark Fisher"   strategy regularly, this is a perfect indicator for having an insight to markets from short term to long term point of view, using Break points of candles' lows and highs and perfect to combine with   "Price Action" . For more options and modifications you can also edit the low timeframe candles withi
FREE
MP Demark Pivot Levels
Pierre Ksachikian
4.5 (2)
This indicator is stand alone version from  MP Pivot Levels  (All in one) containing Demark's Pivots. Calculations:     PP = X / 4     R1 = X / 2 - LOWprev     S1 = X / 2 - HIGHprev Uses: When the pair currency price may change the direction of movement. Possible constraints of support and resistance that creates plateaus for the currency pair prices. Tendency identification by comparing the present prices according to current day's pivot point and also the prior day's pivot points. ____________
FREE
MP Andean Oscillator
Pierre Ksachikian
5 (1)
The MP Andean Oscillator is used to estimate the direction and also the degree of variations of trends. It contains 3 components: Bull component, Bear component and Signal component. A rising Bull component indicates that the market is up-trending while a rising Bear component indicates the presence of down-trending market. Settings: Oscillator period: Specifies the importance of the trends degree of variations measured by the indicator. Signal line per: Moving average period of the Signal line
FREE
This creative simple indicator will provide a precise framework for market sentiment within technical analysis of different timeframes. For instance, for traders like me that uses   "Mark Fisher"   strategy regularly, this is a perfect indicator for having an insight to markets from short term to long term point of view, using Break points of candles' lows and highs and perfect to combine with   "Price Action" . For more options and modifications you can also edit the low timeframe candles withi
FREE
MP Price Change Indicator is a tool to calculate the price movement by percentage. The Value of this indicator can be adjusted to look back of the percent of price change within certain timeframes. This is a powerful tool when used by other indicators as well, such as ATR and ADR, for understanding price fluctuations and tolerance in different strategies. ___________________________________________________________________________________ Disclaimer: Do NOT trade or invest based upon the analysi
FREE
MP Gradient Adaptive RSI oscillator uses AMA with the basic RSI to cover the retracements with minimum lag. Trigger line crossing the oscillator will provide an entry point for trader. Settings: RSI period: period of the oscillator Sensitivity of the oscillator: controls the sensitivity of the oscillator to retracements, with higher values minimizing the sensitivity to retracements. RSI applied price: source input of the indicator Number of bars to draw: is used when the Fill Type option is no
FREE
MP Pin Bar
Pierre Ksachikian
A pin bar pattern consists of one price bar, typically a candlestick price bar, which represents a sharp reversal and rejection of price. The pin bar reversal as it is sometimes called, is defined by a long tail, the tail is also referred to as a “shadow” or “wick”. The area between the open and close of the pin bar is called its “real body”, and pin bars generally have small real bodies in comparison to their long tails. The tail of the pin bar shows the area of price that was rejected, and t
FREE
This utility identifies certain candle open times on chart, this can help you to see your favorite candle open and use it as it fits in your strategy. This tool is very useful for intraday charting and indicating your sessions. ___________________________________________________________________________________ Disclaimer: Do NOT trade or invest based upon the analysis presented on this channel. Always do your own research and due diligence before investing or trading. I’ll never tell you what
FREE
MP Price Change Indicator is a tool to calculate the price movement by percentage. The Value of this indicator can be adjusted to look back of the percent of price change within certain timeframes. This is a powerful tool when used by other indicators as well, such as ATR and ADR, for understanding price fluctuations and tolerance in different strategies. ___________________________________________________________________________________ Disclaimer: Do NOT trade or invest based upon the analysi
FREE
Candle size oscillator is an easy to use tool to figure out candle size from highest to lowest price of each candle. It's a powerful tool for price action analysts specifically for those who works intraday charts and also a perfect tool for short term swing traders. Kindly note that you can also edit the Bullish and Bearish candles with different colors. #Tags: Candle size, oscillator, price action, price range, high to low, candle ticks __________________________________________________________
FREE
MP Close By Loss Or Profit for MT5 The Reason I made this Expert is because I want traders who already found out how to be profitable in the market use an easier tool throughout their trading days. This Expert will consider your exposure of trades and close them based on profit targets and losses you set for your own Risk Management. I want to thank my friend who helped me on this Expert, and his brilliant work is now shared here with you. A bit of advice after running the expert on your platfo
FREE
This indicator helps to identify market sessions, It's High/Low, Open Range (OR), range of the sessions in pips and percentage of previous day (change%) under OHLC. It is also editable for any brokerage market watch time. For traders who use session trading strategies such as Mark B. Fisher ACD it can be super effective, where they can edit OR from the settings to either line or box.  We tried to make the settings easier to edit, for traders' use on different markets, charts and brokerage time.
MP Pivot Levels
Pierre Ksachikian
This indicator contains Pivot Levels of: Traditional Fibonacci Woodie Classic Demark Camarilla Calculation periods can be set to auto / Daily / Weekly / Monthly / Yearly. Number of Levels are editable. Options to hide level labels and price labels. Pivots Points are price levels chartists can use to determine intraday support and resistance levels. Pivot Points use the previous days Open, High, and Low to calculate a Pivot Point for the current day. Using this Pivot Point as the base, three resi
MP Colored MACD
Pierre Ksachikian
MACD (short for M oving A verage C onvergence/ D ivergence) is a popular trading indicator used in technical analysis of securities prices. It is designed to identify changes in the strength, direction, momentum, and duration of a trend in a security's price. History Gerald Appel created the MACD line in the late 1970s. Thomas Aspray added the histogram feature to Appel's  MACD in 1986. The three major components and their formula 1. The MACD line: First, "PM Colored MACD" employs two Moving
This indicator provides insights into Relative Strength Index (RSI) values over multiple timeframes. It highlights the percentage of RSIs across varying periods that are classified as overbought or oversold, and also calculates the average of these RSIs. The percentage of overbought or oversold RSIs is further utilized to define adaptive thresholds for these levels. Settings: Maximum Length: Specifies the longest RSI period used in the calculations. Minimum Length: Specifies the shortest RSI pe
Filtro:
No hay comentarios
Respuesta al comentario