• Información general
  • Comentarios
  • Discusión

Heyken Ashi Trend

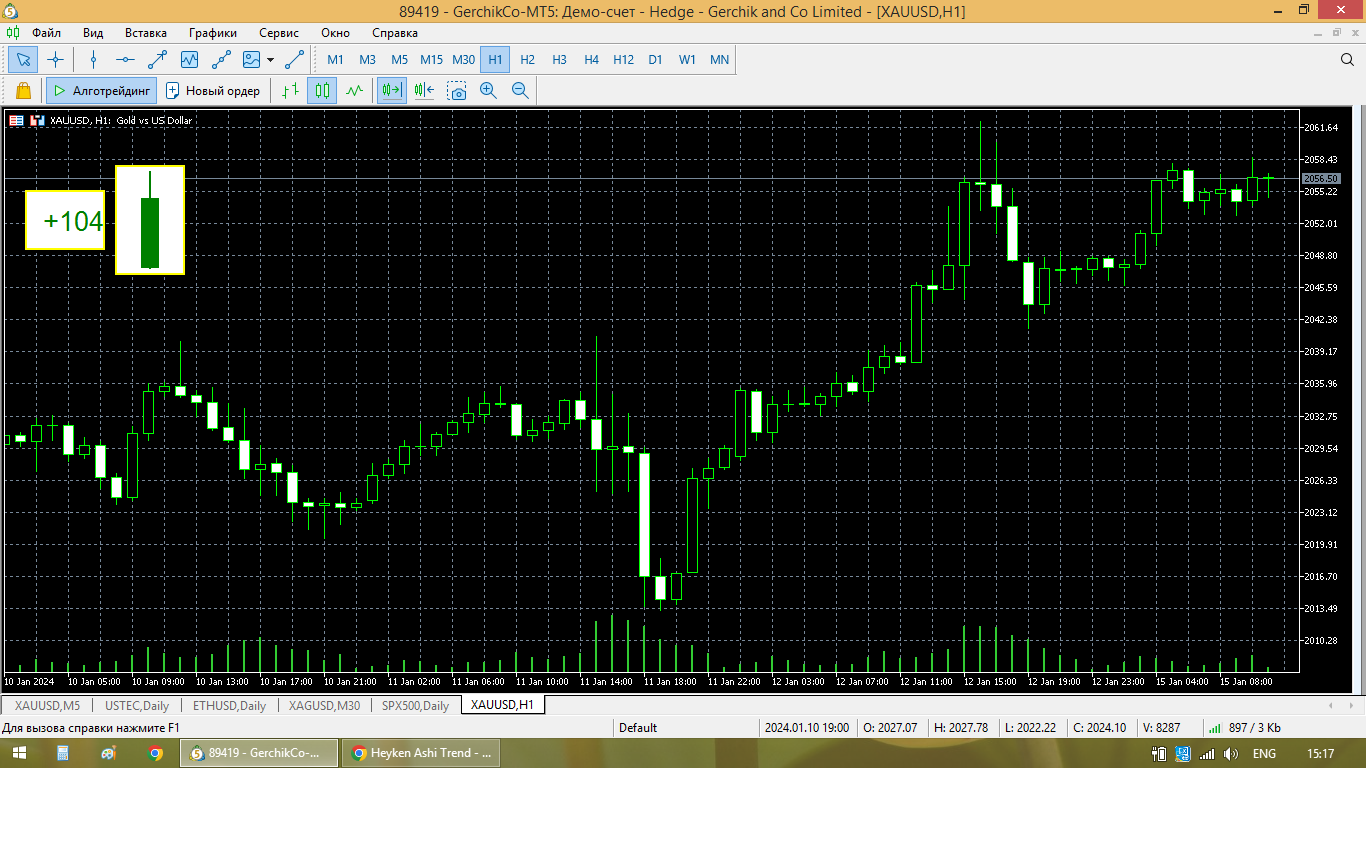
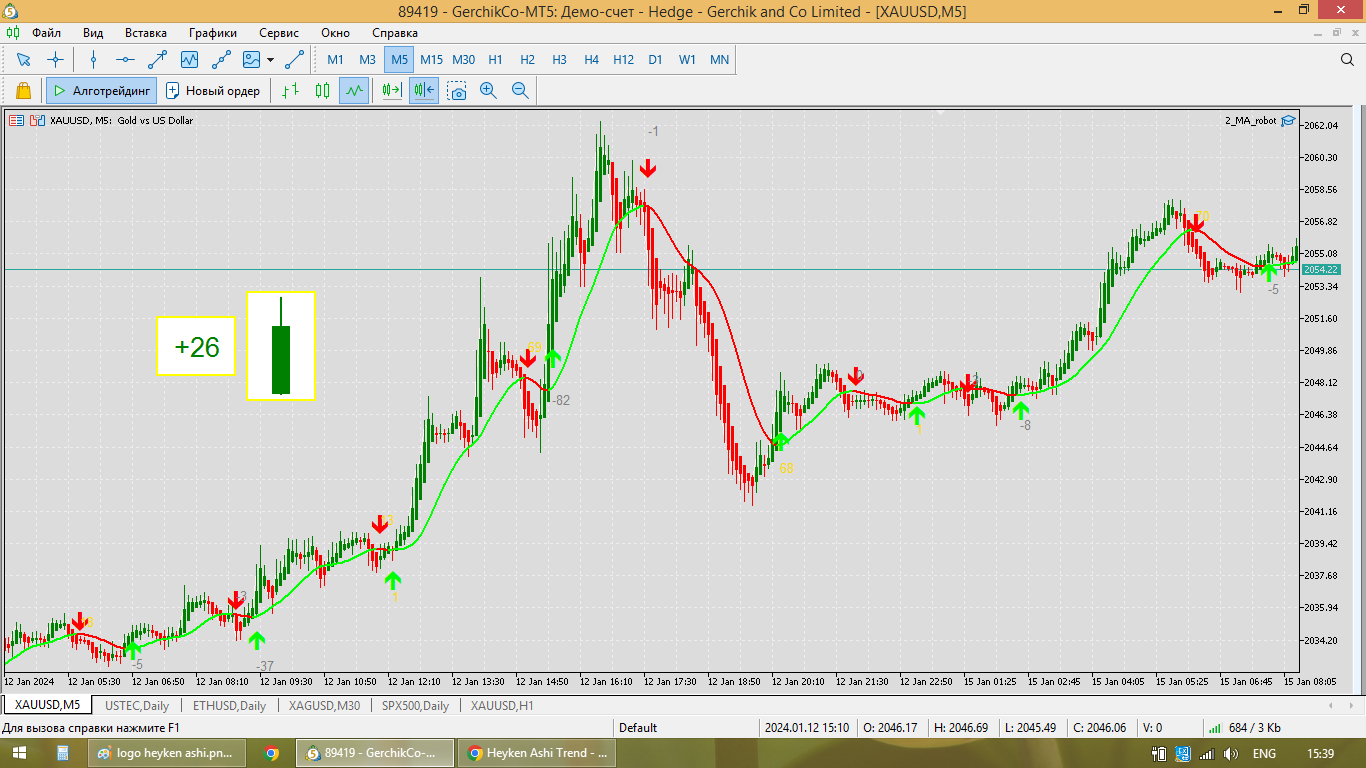
This Indicator shows the trend of movement. If the candle is red, you need to look for Buy signals. If the candle is Red, then look for a Sell signal.


The indicator is especially suitable for scalping.


When trading, take into account risk management.


For trading, I recommend the timeframe M5 M30


Good luck to all ))


If you have any questions, please contact us at +77767238899


Email dilshodaka25@gmail.com

Productos recomendados
Trading patterns on Forex is considered to be the highest level of trading, since it usually requires years of mastering various patterns (shapes and candle combinations) and the ways they affect the price. Patterns are different combinations of Japanese candles on a chart, shapes of classical technical analysis, as well as any regularities of the market behavior repeating many times under the same conditions. After the patterns appear on a chart, the price starts behaving in a certain way allow
Noize Absorption Index - is the manual trading system that measures the difference of pressure between bears forces and bulls forces. Green line - is a noize free index that showing curent situation. Zero value of index shows totally choppy/flat market.Values above zero level shows how powerfull bullish wave is and values below zero measures bearish forces.Up arrow appears on bearish market when it's ready to reverse, dn arrow appears on weak bullish market, as a result of reverse expectation.
Description : Rainbow EA MT5 is a simple Expert advisor based on   Rainbow MT5 indicator witch is based on Moving average with period 34. The indicator is incorporated in the EA, therefore, it is not required for the EA to operate, but if you wish, you can download it from   my product page . The Expert Advisor settings are as follows : Suitable for Timeframes up to H1 The parameters below can be set according to your trading rules. StopLoss ( Stop Loss in pips) TakeProfit ( Take Profit in pi
HMA Trend Professional MT5
Pavel Zamoshnikov
4.25 (4)
Improved version of the free HMA Trend indicator (for MetaTrader 4) with statistical analysis. HMA Trend is a trend indicator based on the Hull Moving Average (HMA) with two periods. HMA with a slow period identifies the trend, while HMA with a fast period determines the short-term movements and signals in the trend direction. The main differences from the free version: Ability to predict the probability of a trend reversal using analysis of history data. Plotting statistical charts for analyz
Owl Smart Levels MT5
Sergey Ermolov
4.07 (28)
Versión MT4  |  FAQ El Indicador Owl Smart Levels es un sistema comercial completo dentro de un indicador que incluye herramientas de análisis de mercado tan populares como los fractales avanzados de Bill Williams , Valable ZigZag que construye la estructura de onda correcta del mercado y los niveles de Fibonacci que marcan los niveles exactos de entrada. en el mercado y lugares para tomar ganancias. Descripción detallada de la estrategia Instrucciones para trabajar con el indicador Asesor de c
Renko Gold
Ignacio Agustin Mene Franco
Renko Gold !  indica clara mente los pisos y techos donde va de 4 lineas ,  la linea de abajo que marca el piso en color verde confirmando con la linea mas fina aclara la entrada en compra ,  lo mismo es para la venta , la linea de arriba marca el techo y la mas fina de color  rojo marca la venta ,  este indicador sirve para todas las temporalidades !  Para los mercados de Forex y Indices sinteticos ! Tambien sirve para los mercados de crypto !  Buen Profit! World Inversor. 
To get access to MT4 version please click here . - This is the exact conversion from TradingView: "Stochastic Momentum Index" By "UCSgears". - This is a popular version of stochastic oscillator on tradingview. - This is a light-load processing and non-repaint indicator. - Buffers are available for the lines on chart. - You can message in private chat for further changes you need. Thanks for downloading
¡El nivel Premium es un indicador único con más del 80% de precisión de predicciones correctas! ¡Este indicador ha sido probado por los mejores especialistas en comercio durante más de dos meses! ¡El indicador del autor no lo encontrarás en ningún otro lugar! ¡A partir de las capturas de pantalla, puede ver por sí mismo la precisión de esta herramienta! 1 es ideal para operar con opciones binarias con un tiempo de vencimiento de 1 vela. 2 funciona en todos los pares de divisas, accion
TrendDetect
Pavel Gotkevitch
The Trend Detect indicator combines the features of both trend indicators and oscillators. This indicator is a convenient tool for detecting short-term market cycles and identifying overbought and oversold levels. A long position can be opened when the indicator starts leaving the oversold area and breaks the zero level from below. A short position can be opened when the indicator starts leaving the overbought area and breaks the zero level from above. An opposite signal of the indicator can
Este innovador indicador de medición de la fuerza de la moneda de INFINITY es un ayudante indispensable para los revendedores y comerciantes que negocian en el largo plazo. El sistema de Análisis de fortaleza / debilidad de las monedas ha sido conocido y utilizado en el mercado por los principales operadores del mundo. Cualquier comercio de arbitraje no está completo sin este análisis. Nuestro indicador determina fácilmente la fuerza de las monedas subyacentes entre sí. Muestra gráficos de líne
Indicator and Expert Adviser  EA Available in the comments section of this product. Download with Indicator must have indicator installed for EA to work. Mt5 indicator alerts for bollinger band and envelope extremes occurring at the same time. Buy signal alerts occur when A bullish candle has formed below both the lower bollinger band and the lower envelope  Bar must open and close below both these indicators. Sell signal occur when A bear bar is formed above the upper bollinger band and upp
Ante todo, vale la pena enfatizar que esta Herramienta de Trading es un Indicador No Repintado, No Redibujado y No Retrasado, lo que la hace ideal para el trading profesional. Curso en línea, manual del usuario y demostración. El Indicador de Conceptos de Acción del Precio Inteligente es una herramienta muy potente tanto para traders nuevos como experimentados. Combina más de 20 indicadores útiles en uno solo, combinando ideas avanzadas de trading como el Análisis del Trader del Círculo Inte
Volality Index Scalper
Lesedi Oliver Seilane
5 (1)
Volality Index scalper indicator  Meant for Volality pairs such as Volality 10, 25, 50, 75 and 100 The indicator works on all timeframes from the 1 minute to the monthly timeframe the indicator is non repaint the indicator has 3 entry settings 1 color change on zero cross 2 color change on slope change 3 color change on signal line cross Orange line is your sell signal Blue line is your buy signal.
This indicator uses the metaquotes ZigZag indicator as base to plot fibonacci extension and fibonacci retracement based in the Elliot waves. A fibonacci retracement will be plotted on every wave draw by the ZigZag. A fibonacci extension will be plotted only after the 2nd wave. Both fibonacci will be updated over the same wave tendency. Supporting until 9 consecutive elliot waves. Parameters: Depth: How much the algorithm will iterate to find the lowest and highest candles Deviation: Amoun
Trend Monitor MT5
Pavel Zamoshnikov
4.5 (2)
The indicator generates early signals basing on ADX reading data combined with elements of price patterns. Works on all symbols and timeframes. The indicator does not redraw its signals. You see the same things on history and in real time. For better visual perception signals are displayed as arrows (in order not to overload the chart). Features The best results are obtained when the indicator works on two timeframes. For example: M30 – the indicator shows the main trend; M5 – the indicator ge
Double HMA MTF for MT5
Pavel Zamoshnikov
3.67 (3)
This is an advanced multi-timeframe version of the popular Hull Moving Average (HMA) Features Two lines of the Hull indicator of different timeframes on the same chart. The HMA line of the higher timeframe defines the trend, and the HMA line of the current timeframe defines the short-term price movements. A graphical panel with HMA indicator data from all timeframes at the same time . If the HMA switched its direction on any timeframe, the panel displays a question or exclamation mark with a tex
Your Trend Friend
Luigi Nunes Labigalini
5 (1)
The trend is your friend! Look at the color of the indicator and trade on that direction. It does not  repaint. After each candle is closed, that's the color of the trend. You can focus on shorter faster trends or major trends, just test what's most suitable for the symbol and timeframe you trade. Simply change the "Length" parameter and the indicator will automatically adapt. You can also change the color, thickness and style of the lines. Download and give it a try! There are big movements
Stratos Pali mt5
Michela Russo
5 (1)
Stratos Pali Indicator is a revolutionary tool designed to enhance your trading strategy by accurately identifying market trends. This sophisticated indicator uses a unique algorithm to generate a complete histogram, which records when the trend is Long or Short. When a trend reversal occurs, an arrow appears, indicating the new direction of the trend. Important Information Revealed Leave a review and contact me via mql5 message to receive My Top 5 set files for Stratos Pali at no cost ! Do
Supertrend indicator uses a combination of a moving average and average true range to detect the trend of a trading instrument. Supertrend indicator for MetaTrader 5 easily shows the trend as a line following the price. Triple SuperTrend Histo indicator  calculate  three supertrends to show the trend as a histogram. Changing the color from red to green means you can BUY , from green to red means you can SELL . Description of the method of drawing a histogram. The price is above the EMA 20
Provided Trend is a complex signal formation indicator. As a result of the work of internal algorithms, you can see only three types of signals on your chart. The first is a buy signal, the second is a sell signal, and the third is a market exit signal. Options: CalcFlatSlow - The first parameter that controls the main function of splitting the price chart into waves. CalcFlatFast - The second parameter that controls the main function of splitting the price chart into waves. CalcFlatAvg - Par
An indicator of pattern #31 ("Long Island") from Encyclopedia of Chart Patterns by Thomas N. Bulkowski. The second gap is in the opposite direction. Parameters: Alerts - show alert when an arrow appears   Push - send a push notification when an arrow appears (requires configuration in the terminal) GapSize - minimum gap size in points ArrowType - a symbol from 1 to 17 ArrowVShift - vertical shift of arrows in points   ShowLevels - show levels ColUp - color of an upward line ColDn - color of a
Supply and Demand Pro
Godbless C Nygu
4 (1)
Join Deriv link on profile>>> GET THIS FULL COPY AND GET ANOTHER FREE INDICATOR ONE OF THE BEST AND USEFULL INDICATORS IN THE WORLD ..This is the one of the best usefull indicators which has chosen to be used by top traders in the world. AUTOMATIC SUPPORT AND RESISTANCE This way of trading is also called Supply and demand, On this way of trading you can see auto colours appear where the market changes direction buying or selling Direction. ALL KIND OF PAIRS METALS AND INDICIES ARE INCLUDE
VR Cub MT 5
Vladimir Pastushak
VR Cub es un indicador para obtener puntos de entrada de alta calidad. El indicador fue desarrollado para facilitar los cálculos matemáticos y simplificar la búsqueda de puntos de entrada a una posición. La estrategia comercial para la cual se diseñó el indicador ha demostrado su eficacia durante muchos años. La simplicidad de la estrategia comercial es su gran ventaja, que permite que incluso los operadores novatos negocien con éxito con ella. VR Cub calcula los puntos de apertura de posiciones
SolarTrade Suite Financial Indicator: Jupiter Market Indicator - ¡Su guía confiable en el mundo de los mercados financieros! Este es un indicador de tendencia que utiliza algoritmos especiales innovadores y avanzados para calcular su valor, y también tiene un diseño agradable a la vista. Es muy fácil entender las lecturas de este indicador: color azul - compra, rojo - venta. Vea nuestros otros productos de la serie SolarTrade Suite en la parte inferior de la descripción. ¿Quiere navegar
PZ Fibonacci MT5
PZ TRADING SLU
5 (1)
Are you tired of plotting Fibonacci retracements or extensions manually? This indicator displays Fibo retracements or extensions automatically, calculated from two different price points, without human intervention or manual object anchoring. [ Installation Guide | Update Guide | Troubleshooting | FAQ | All Products ] Easy to use Manual anchoring is not needed Perfect for price confluence studies The indicator evaluates if retracements or extensions are needed Once drawn, you can manually edit t
Was: $249  Now: $99   Market Profile defines a number of day types that can help the trader to determine market behaviour. A key feature is the Value Area, representing the range of price action where 70% of trading took place. Understanding the Value Area can give traders valuable insight into market direction and establish the higher odds trade. It is an excellent addition to any system you may be using. Inspired by Jim Dalton’s book “Mind Over Markets”, this indicator is designed to suit the
The Penta-O is a 6-point retracement harmonacci pattern which usually precedes big market movements. Penta-O patterns can expand and repaint quite a bit. To make things easier this indicator implements a twist: it waits for a donchian breakout in the right direction before signaling the trade. The end result is an otherwise repainting indicator with a very reliable trading signal. The donchian breakout period is entered as an input. [ Installation Guide | Update Guide | Troubleshooting | FAQ | A
Antes que nada, vale la pena enfatizar que este Sistema de Trading es un Indicador No Repintado, No Redibujado y sin Retardos, lo que lo hace ideal para el trading profesional. Curso en línea, manual del usuario y demostración. El "Sistema de Trading de Soporte y Resistencia Inteligente" es un indicador avanzado diseñado para traders nuevos y experimentados. Empodera a los traders con precisión y confianza en el mercado de divisas. Este sistema integral combina más de 7 estrategias, 10 indicado
Este indicador encuentra los patrones de retroceso AB = CD. El patrón de retroceso AB = CD es una estructura de precios de 4 puntos en la que el segmento de precios inicial está parcialmente retrocedido y seguido de un movimiento equidistante desde la finalización del retroceso, y es la base básica de todos los patrones armónicos. [ Guía de instalación | Guía de actualización | Solución de problemas | FAQ | Todos los productos ] Tamaños de patrones personalizables Relaciones de CA y BD pe
Atomic Analyst MT5
Issam Kassas
4.42 (19)
En primer lugar, vale la pena enfatizar que este Indicador de Trading no repinta, no redibuja y no se retrasa, lo que lo hace ideal tanto para el trading manual como para el automatizado. Manual del usuario: configuraciones, entradas y estrategia. El Analista Atómico es un Indicador de Acción del Precio PA que utiliza la fuerza y el impulso del precio para encontrar una mejor ventaja en el mercado. Equipado con filtros avanzados que ayudan a eliminar ruidos y señales falsas, y aumentan el poten
Los compradores de este producto también adquieren
TPSpro RFI Levels MT5
Roman Podpora
4.73 (11)
INSTRUCCIONES       RUSO   -   ING        Se   recomienda utilizar con un indicador.       -       TPSpro   TENDENCIA PRO -   Versión MT5 Un elemento clave en el trading son las zonas o niveles desde los que se toman las decisiones de compra o venta de un instrumento de trading. A pesar de los intentos de los principales actores de ocultar su presencia en el mercado, inevitablemente dejan rastros. Nuestra tarea era aprender a identificar estos rastros e interpretarlos correctamente. Funciones p
TPSproTREND PrO MT5
Roman Podpora
4.89 (9)
TPSpro TREND PRO  - is a trend indicator that automatically analyzes the market and provides information about the trend and each of its changes, as well as giving signals for entering trades without redrawing! The indicator uses each candle, analyzing them separately. referring to different impulses - up or down impulse. Exact entry points into transactions for currencies, crypto, metals, stocks, indices!  Version MT4               DETAILED DESCRIPTION               R ecommended to use with an
Primero que todo, vale la pena enfatizar que este Sistema de Trading es un Indicador No Repintado, No Redibujado y No Retrasado, lo que lo hace ideal tanto para el trading manual como para el automatizado. Curso en línea, manual y descarga de ajustes preestablecidos. El "Sistema de Trading Inteligente MT5" es una solución completa de trading diseñada para traders nuevos y experimentados. Combina más de 10 indicadores premium y presenta más de 7 estrategias de trading robustas, lo que lo convie
Gold Stuff mt5
Vasiliy Strukov
4.92 (167)
Gold Stuff mt5: un indicador de tendencia diseñado específicamente para el oro, también se puede usar en cualquier instrumento financiero. El indicador no se vuelve a dibujar ni se retrasa. El marco de tiempo recomendado es H1. IMPORTANTE! Póngase en contacto conmigo inmediatamente después de la compra para obtener instrucciones y bonificación!   Puede obtener una copia gratuita de nuestro indicador Strong Support y Trend Scanner, por favor envíe un mensaje privado. ¡a mí! PARÁMETROS Draw
Quantum Trend Sniper
Bogdan Ion Puscasu
4.8 (49)
Introduciendo       Indicador Quantum Trend Sniper   , el innovador indicador MQL5 que está transformando la forma en que identificas y negocias los cambios de tendencia. Desarrollado por un equipo de comerciantes experimentados con experiencia comercial de más de 13 años,       Indicador de francotirador de tendencia cuántica       está diseñado para impulsar su viaje comercial a nuevas alturas con su forma innovadora de identificar cambios de tendencia con una precisión extremadamente alta.
FxaccurateLS
Shiv Raj Kumawat
WHY IS OUR FXACCCURATE LS MT5 THE PROFITABLE ? PROTECT YOUR CAPITAL WITH RISK MANAGEMENT Gives entry, stop and target levels from time to time. It finds Trading opportunities by analyzing what the price is doing during established trends. POWERFUL INDICATOR FOR A RELIABLE STRATEGIES We have made these indicators with a lot of years of hard work. It is made at a very advanced level. Established trends provide dozens of trading opportunities, but most trend indicators completely ignore them!
FX Power MT5 NG
Daniel Stein
5 (5)
Obtenga su actualización diaria del mercado con detalles y capturas de pantalla a través de nuestro Morning Briefing aquí en mql5 y en Telegram ! FX Power MT5 NG es la nueva generación de nuestro popular medidor de fuerza de divisas, FX Power. ¿Y qué ofrece este medidor de fuerza de nueva generación? Todo lo que le encantaba del FX Power original PLUS Análisis de fuerza de ORO/XAU Resultados de cálculo aún más precisos Períodos de análisis configurables individualmente Límite de cálculo persona
Blahtech Supply Demand MT5
Blahtech Limited
4.54 (13)
Was: $299  Now: $99   Supply Demand uses previous price action to identify potential imbalances between buyers and sellers. The key is to identify the better odds zones, not just the untouched ones. Blahtech Supply Demand indicator delivers functionality previously unavailable on any trading platform. This 4-in-1 indicator not only highlights the higher probability zones using a multi-criteria strength engine, but also combines it with multi-timeframe trend analysis, previously confirmed swings
PZ Swing Trading MT5
PZ TRADING SLU
5 (4)
Swing Trading es el primer indicador diseñado para detectar oscilaciones en la dirección de la tendencia y posibles oscilaciones de reversión. Utiliza el enfoque de intercambio de línea de base, ampliamente descrito en la literatura comercial. El indicador estudia varios vectores de precios y tiempos para rastrear la dirección de la tendencia agregada y detecta situaciones en las que el mercado está sobrevendido o sobrecomprado y listo para corregir. [ Guía de instalación | Guía de actualización
Este es un genial indicador para MT5 que ofrece señales precisas para entrar en una transacción sin redibujar. Se puede aplicar a cualquier activo financiero: fórex, criptomonedas, metales, acciones, índices. Nos dará valoraciones bastante precisas y nos dirá cuándo es mejor abrir y cerra una transacción. Eche un vistazo  al vídeo  (6:22), ¡contiene un ejemplo de procesamiento de una sola señal que ha amortizado el indicador! La mayoría de los tráders mejoran sus resultados comerciales durante l
Este tablero muestra los últimos   patrones armónicos   disponibles para los símbolos seleccionados, por lo que ahorrará tiempo y será más eficiente /   versión MT4 . Indicador gratuito:   Basic Harmonic Pattern Columnas del indicador Symbol:   aparecerán los símbolos seleccionados Trend :   alcista o bajista Pattern :   tipo de patrón (gartley, mariposa, murciélago, cangrejo, tiburón, cifrado o ABCD) Entry :   precio de entrada SL:   precio de stop loss TP1:   1er precio de toma de benefici
Fxaccurate TCT
Shiv Raj Kumawat
WHY IS OUR FXACCCURATE TCT MT5 THE PROFITABLE ? Gives entry, stop and target levels from time to time. It finds Trading opportunities by analyzing what the price is doing during established trends. We have made these indicators with a lot of years of hard work. It is made at a very advanced level. Established trends provide dozens of trading opportunities, but most trend indicators completely ignore them! The trend reveals trading indicator represents an average of 10 different trades per trend
Advanced Supply Demand MT5
Bernhard Schweigert
4.5 (14)
¡Actualmente con 33% de descuento! ¡La mejor solución para cualquier tráder principiante o experto! Este indicador es una herramienta comercial única, de alta calidad y asequible, porque incorpora una serie de características patentadas y una nueva fórmula. Con esta actualización, podrá mostrar zonas de doble marco temporal. No solo podrá mostrar un marco temporal más alto, sino también mostrar ambos, el marco temporal del gráfico MÁS el marco temporal más alto: MOSTRANDO ZONAS ANIDADAS. A todos
Auto Order Block with break of structure based on ICT and Smart Money Concepts (SMC) Futures Break of Structure ( BoS )             Order block ( OB )            Higher time frame Order block / Point of Interest ( POI )    shown on current chart           Fair value Gap ( FVG ) / Imbalance   -  MTF      ( Multi Time Frame )    HH/LL/HL/LH  -  MTF      ( Multi Time Frame )  Choch  MTF      ( Multi Time Frame )  Volume Imbalance     ,  MTF          vIMB Gap’s Power of 3 Equal High
FX Volume MT5
Daniel Stein
4.93 (14)
Obtenga su actualización diaria del mercado con detalles y capturas de pantalla a través de nuestro Morning Briefing aquí en mql5 y en Telegram ! FX Volume es el PRIMER y ÚNICO indicador de volumen que proporciona una visión REAL del sentimiento del mercado desde el punto de vista de un bróker. Proporciona una visión impresionante de cómo los participantes institucionales del mercado, como los brokers, están posicionados en el mercado Forex, mucho más rápido que los informes COT. Ver esta info
Gartley Hunter Multi
Siarhei Vashchylka
5 (8)
Gartley Hunter Multi - An indicator for searching for harmonic patterns simultaneously on dozens of trading instruments and on all possible timeframes. Manual (Be sure to read before purchasing) | Version for MT4 Advantages 1. Patterns: Gartley, Butterfly, Shark, Crab. Bat, Alternate Bat, Deep Crab, Cypher 2. Simultaneous search for patterns on dozens of trading instruments and on all possible timeframes 3. Search for patterns of all possible sizes. From the smallest to the largest 4. A
MetaForecast M5
Vahidreza Heidar Gholami
5 (2)
MetaForecast predice y visualiza el futuro de cualquier mercado basándose en las armonías de los datos de precios. Aunque el mercado no siempre es predecible, si existe un patrón en el precio, MetaForecast puede predecir el futuro con la mayor precisión posible. En comparación con otros productos similares, MetaForecast puede generar resultados más precisos al analizar las tendencias del mercado. Parámetros de entrada Past size (Tamaño del pasado) Especifica el número de barras que MetaForecas
Golden Spikes Premium
Kwaku Bondzie Ghartey
5 (1)
Golden Spikes Detector Acknowledgement and Dedications:  The name of this indicator was Inspired by an Original; Mr Grant Koopman; a Knowledgeable and experienced Synthetics trader. I dedicate this indicator to Mr Grant.  Overview: The Golden Spikes Premium is a groundbreaking trading indicator meticulously crafted for the Boom and Crash indices on the Deriv market. Tailored to meet the needs of discerning traders, this powerful tool operates exclusively on the one-minute timeframe, providin
AT Forex Indicator MT5
Marzena Maria Szmit
5 (4)
The AT Forex Indicator MT5 is a sophisticated trading tool designed to provide traders with a comprehensive analysis of multiple currency pairs. This powerful indicator simplifies the complex nature of the forex market, making it accessible for both novice and experienced traders. AT Forex Indicator uses advanced algorithms to detect trends, patterns and is an essential tool for traders aiming to enhance their forex trading performance. With its robust features, ease of use, and reliable signal
TrendMaestro5
Stefano Frisetti
note: this indicator is for METATRADER4, if you want the version for METATRADER5 this is the link:  https://www.mql5.com/it/market/product/108106 TRENDMAESTRO ver 2.4 TRENDMAESTRO recognizes a new TREND in the bud, he never makes mistakes. The certainty of identifying a new TREND is priceless. DESCRIPTION TRENDMAESTRO identifies a new TREND in the bud, this indicator examines the volatility, volumes and momentum to identify the moment in which there is an explosion of one or more of these data a
Matrix Arrow Indicator MT5
Juvenille Emperor Limited
5 (12)
Matrix Arrow Indicator MT5   es una tendencia única 10 en 1 que sigue un indicador   100% sin repintado   de marcos temporales múltiples que se puede usar en todos los símbolos/instrumentos:   divisas ,   materias primas ,   criptomonedas ,   índices ,   acciones .  Matrix Arrow Indicator MT5  determinará la tendencia actual en sus primeras etapas, recopilando información y datos de hasta 10 indicadores estándar, que son: Índice de movimiento direccional promedio (ADX) Índice de canales de prod
Trend Forecaster
Alexey Minkov
5 (6)
The Trend Forecaster indicator utilizes a unique proprietary algorithm to determine entry points for a breakout trading strategy. The indicator identifies price clusters, analyzes price movement near levels, and provides a signal when the price breaks through a level. The Trend Forecaster indicator is suitable for all financial assets, including currencies (Forex), metals, stocks, indices, and cryptocurrencies. You can also adjust the indicator to work on any time frames, although it is recommen
TPA True Price Action indicator reveals the true price action of the market makers through 100% non-repainting signals strictly at the close of a candle! TPA shows entries and re-entries, every time the bulls are definitely stronger than the bears and vice versa. Not to confuse with red/green candles. The shift of power gets confirmed at the earliest stage and is ONE exit strategy of several. There are available now two free parts of the TPA User Guide for our customers. The first "The Basics"
Este indicador analiza la acción pasada de los precios para anticipar la presión de compra y venta en el mercado: lo hace mirando hacia atrás en el pasado y analizando los picos y valles de precios en torno al precio actual. Es un indicador de confirmación de última generación. [ Guía de instalación | Guía de actualización | Solución de problemas | FAQ | Todos los productos ] Predecir la presión de compra y venta en el mercado Evite quedar atrapado comprando vendiendo frenéticos No se necesita
Introducing   Volume Orderflow Profile , a versatile tool designed to help traders visualize and understand the dynamics of buying and selling pressure within a specified lookback period. Perfect for those looking to gain deeper insights into volume-based market behavior! MT4 Version -  https://www.mql5.com/en/market/product/122656/ The indicator gathers data on high and low prices, along with buy and sell volumes, over a user-defined period. It calculates the maximum and minimum prices during t
Volume Break Oscillator es un indicador que combina el movimiento de precios con las tendencias de volumen en forma de oscilador. Quería integrar el análisis de volumen en mis estrategias, pero siempre me han decepcionado la mayoría de los indicadores de volumen, como OBV, Money Flow Index, A/D, pero también Volume Weighted Macd y muchos otros. Por lo tanto, escribí este indicador para mí mismo, estoy satisfecho con su utilidad y, por lo tanto, decidí publicarlo en el mercado. Característic
Indicador para negociación manual y análisis técnico de Forex. Consiste en un indicador de tendencia con el nivel de apertura del día de negociación y un indicador de flecha para determinar los puntos de entrada. El indicador no cambia de color; funciona cuando se cierra la vela. Contiene varios tipos de alertas para flechas de señal. Puede configurarse para funcionar en cualquier gráfico, instrumento comercial o período de tiempo. La estrategia de trabajo se basa en la búsqueda de movi
Introduction Harmonic Patterns are best used to predict potential turning point. Traditionally, Harmonic Pattern was identified manually connecting peaks and troughs points in the chart. Manual harmonic pattern detection is painfully tedious and not suitable for everyone. You are often exposed under subjective pattern identification with manual pattern detection. To avoid these limitations, Harmonic Pattern Plus was designed to automate your harmonic pattern detection process. The functionality
Renko is a well-known Japanese charting technique that removes time from the chart. Instead of drawing bars in constant intervals (time) as a normal chart would, a Renko chart does so only when price moves beyond a predefined amount. In a Renko chart, a bar is created when price exceeds the previous bar’s high or low by a predefined amount or what we call the Box Size. The result is a chart with equally sized bars running up or down in 45 degree angles. Such a chart offers the following advant
Los objetivos de oro son el mejor indicador de tendencias. El algoritmo único del indicador analiza el movimiento del precio del activo, teniendo en cuenta factores de análisis técnico y matemático, determina los puntos de entrada más rentables, emite una señal en forma de flecha y el nivel de precio (entrada de COMPRA / entrada de VENTA) para abrir un pedido. El indicador también muestra inmediatamente el nivel de precio de Stop Loss y cinco niveles de precio de Take Profit. ATENCIÓN:   El i
Filtro:
No hay comentarios
Respuesta al comentario