Valakrune EA
- Asesores Expertos
- Mr Ruengrit Loondecha
- Versión: 1.0
- Activaciones: 5
Noticed : TP and SL use a % no PIPs or POINTs. EA run like Repeating orders, can use utilities like Close ALL or Close at PROFITS if u like!
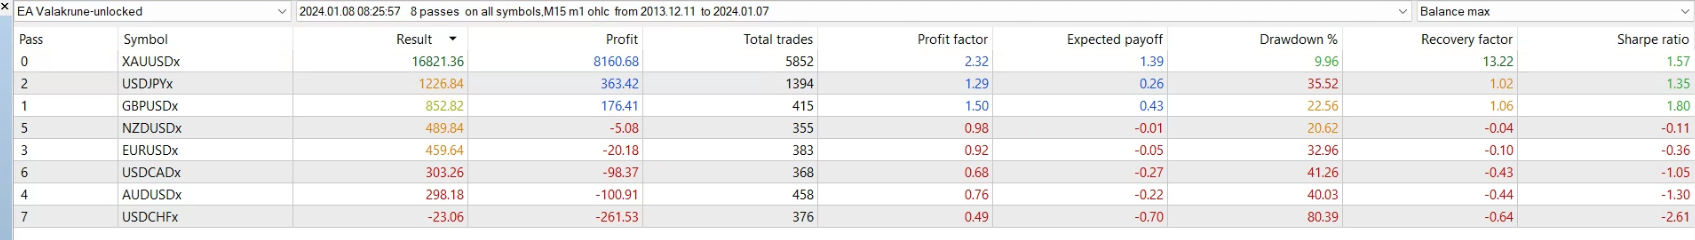
Currencies : XAUUSD (another will come soon)
Fund : Build from $100 but Advise $500
Brokers : ALL (Major build for GMT+2 / +3)
Timeframe : M15 (can optimizing by -|+ 50% and 1-5 steps in INPUT, EA has stable area for all pairs)
Leverage 1: 500 & Low Latency for BEST Result
Order type : Entry market & Series orders
Signals and Indicators i used, Description (by BARD) :
1. Demystifying Trends: DEMA (Double Exponential Moving Average)
DEMA reacts faster to price changes than traditional EMAs, making it ideal for capturing early trend shifts. Its double smoothing reduces noise while maintaining sensitivity, providing a clearer picture of the underlying trend direction.
2. Quantifying Volatility: StdDev (Standard Deviation)
StdDev measures the degree to which price data deviates from the average. A rising StdDev signifies increasing volatility, indicating potentially larger price swings, while a falling StdDev suggests a calmer market.
3. Rate of Change Revealed: ROC (Rate of Change)
ROC measures the percentage change in price over a specific period, highlighting the current momentum. A rising ROC indicates accelerating momentum, potentially suggesting trend continuation, while a falling ROC signifies weakening momentum, hinting at a possible trend reversal.
4. Hull's Moving Average Mastery: HMA (Hull Moving Average)
HMA utilizes weighted moving averages to adjust for price lags, resulting in a smoother and more responsive indicator compared to traditional MAs. This makes it valuable for identifying trends and potential turning points with greater accuracy.
5. Commodity Channel Unraveled: CCI (Commodity Channel Index)
CCI compares the current price to the average price over a specific period, but statistically normalized to account for different volatilities across assets. This allows for comparison between different instruments and helps identify overbought/oversold conditions, potentially signaling trend reversals.
6. Relative Vigor Unveiled: RVI (Relative Vigor Index)
RVI compares the closing price to the average price range over a specific period, highlighting the strength of buying or selling pressure. A rising RVI indicates strong buying, potentially suggesting upward momentum, while a falling RVI signifies strong selling, potentially hinting at a downward trend.


El usuario no ha dejado ningún comentario para su valoración