• Información general
  • Comentarios
  • Discusión

Cool volumes

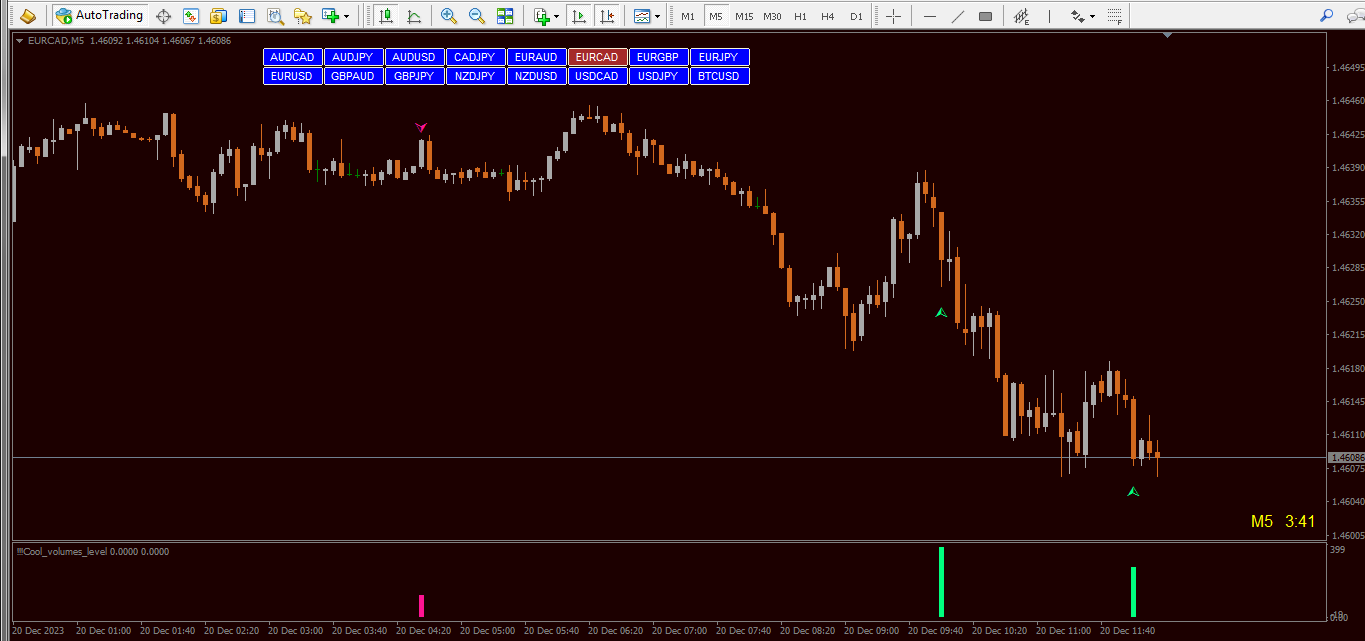
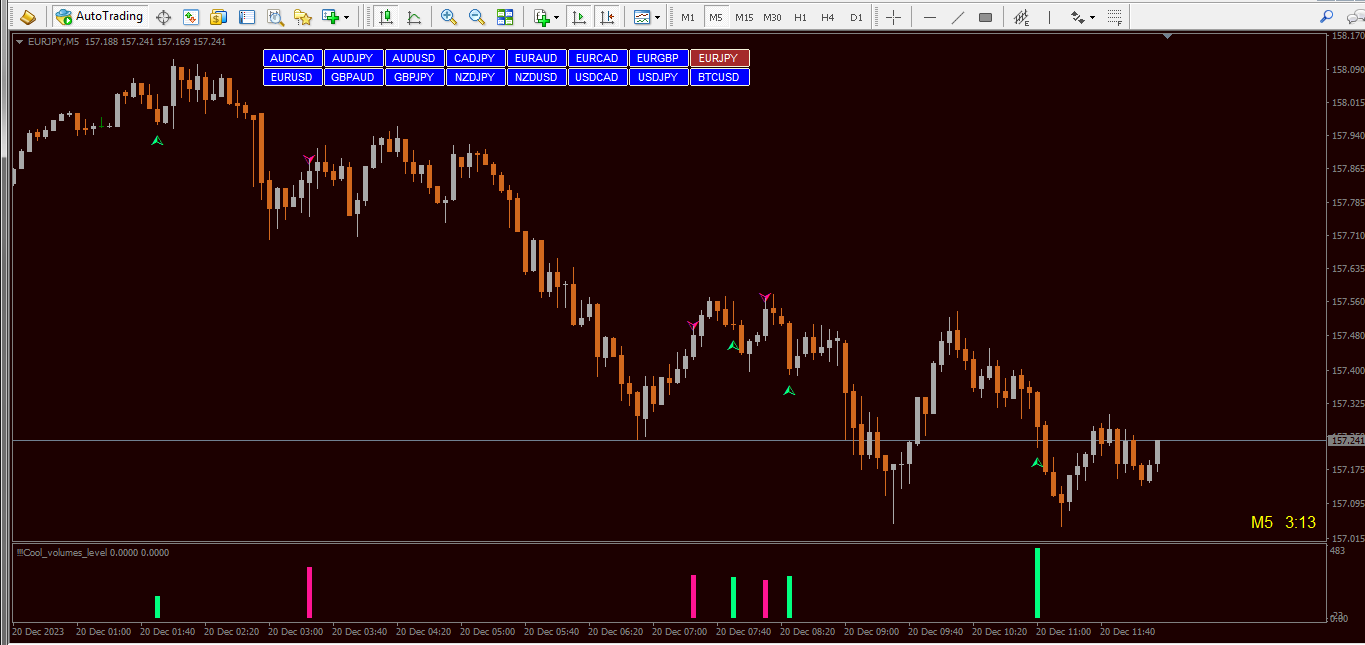
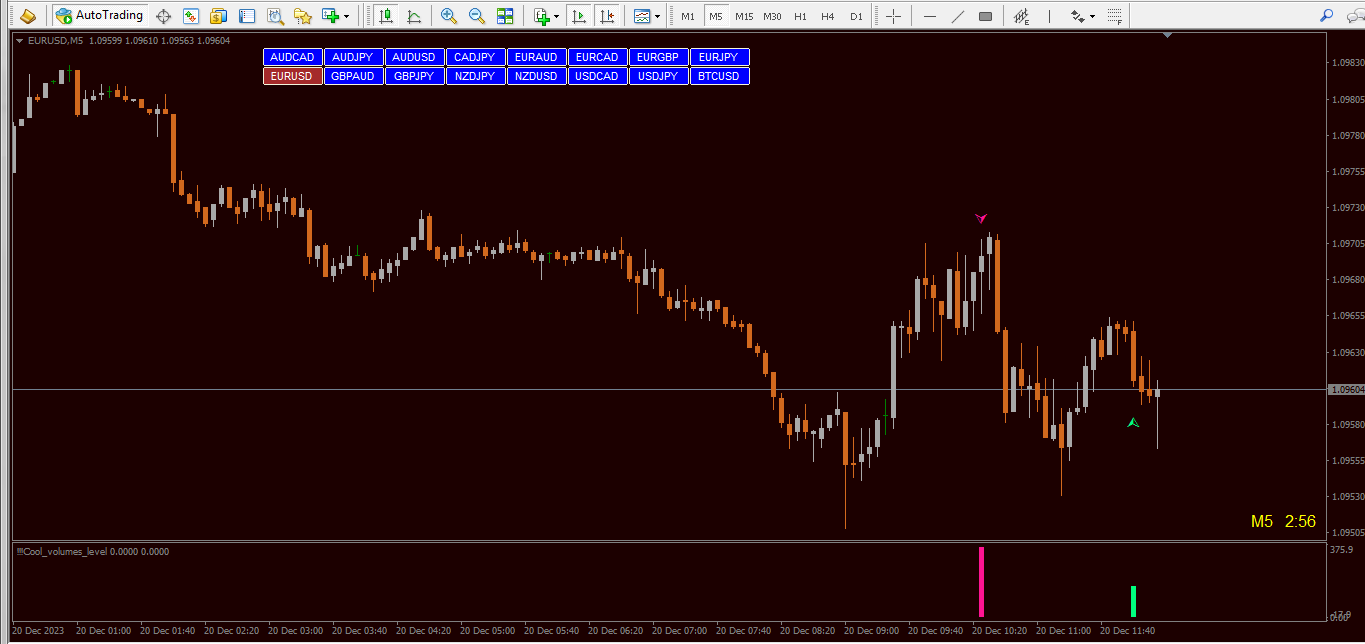
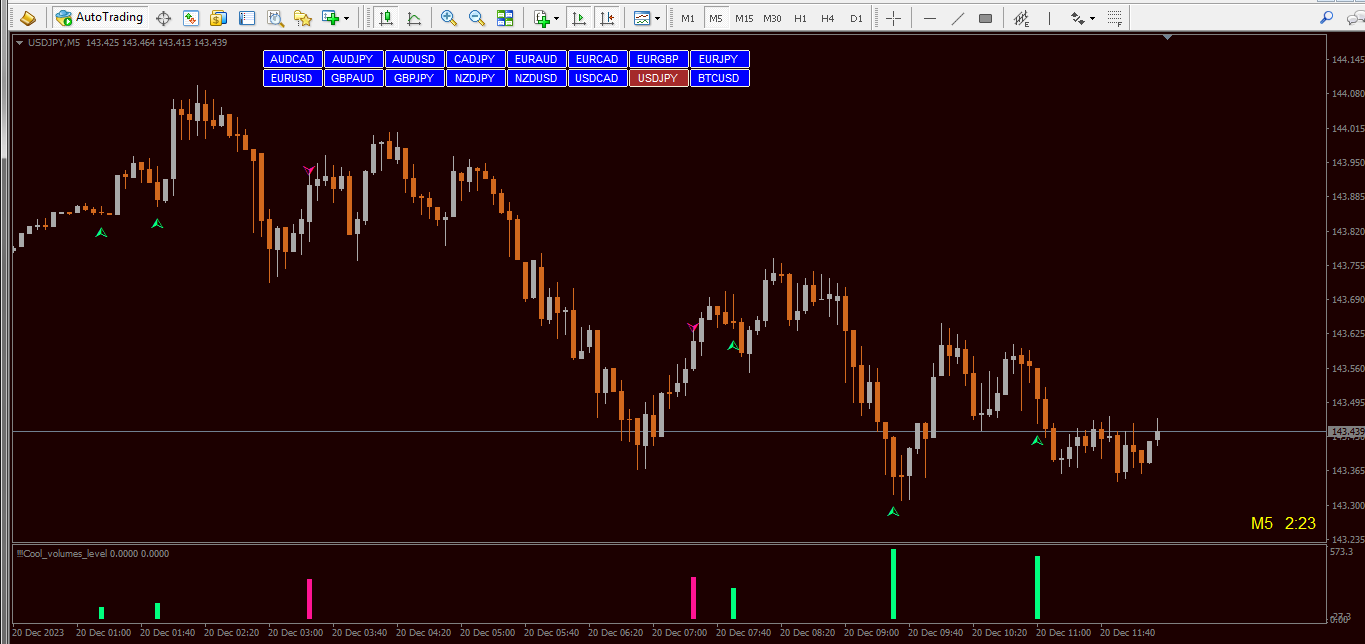
El indicador de Dial "Cool volumes" se basa en los volúmenes de ticks en MT4.

El indicador en sí mismo rastrea en un cierto período de tiempo (selección del marco de tiempo) el número de volúmenes para comprar o vender. Y cuando hay un exceso anómalo en los volúmenes de vendedores o compradores, emite una señal para vender o comprar.

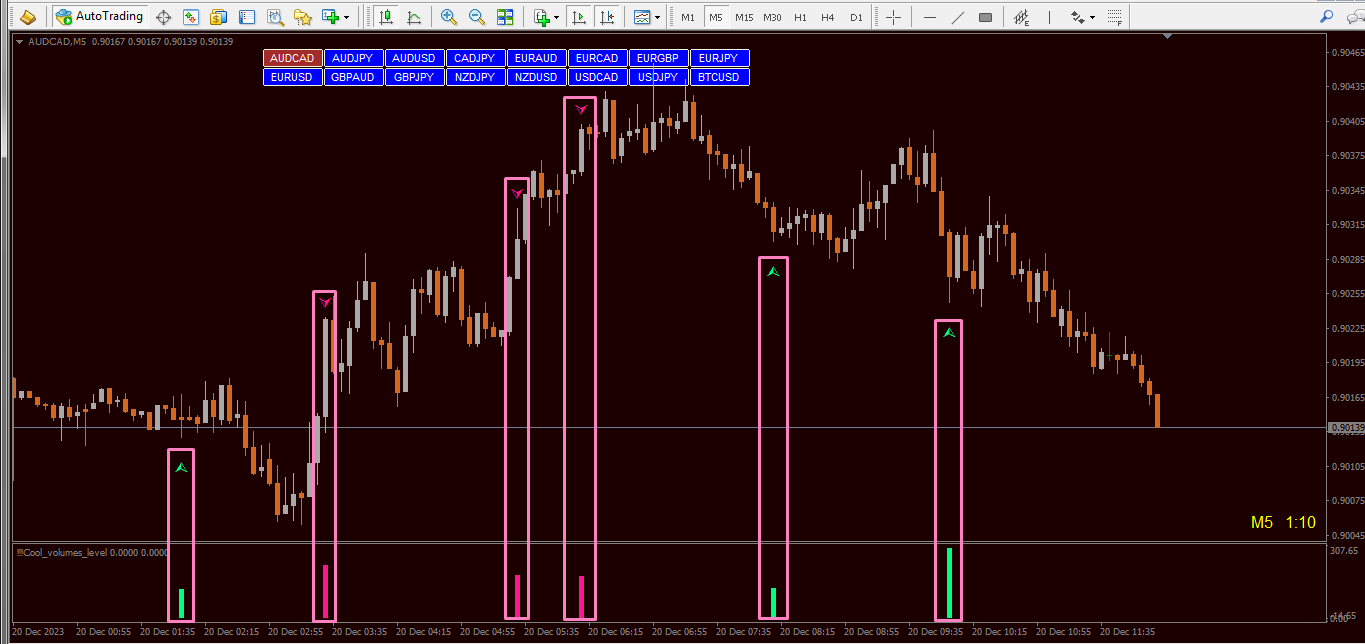
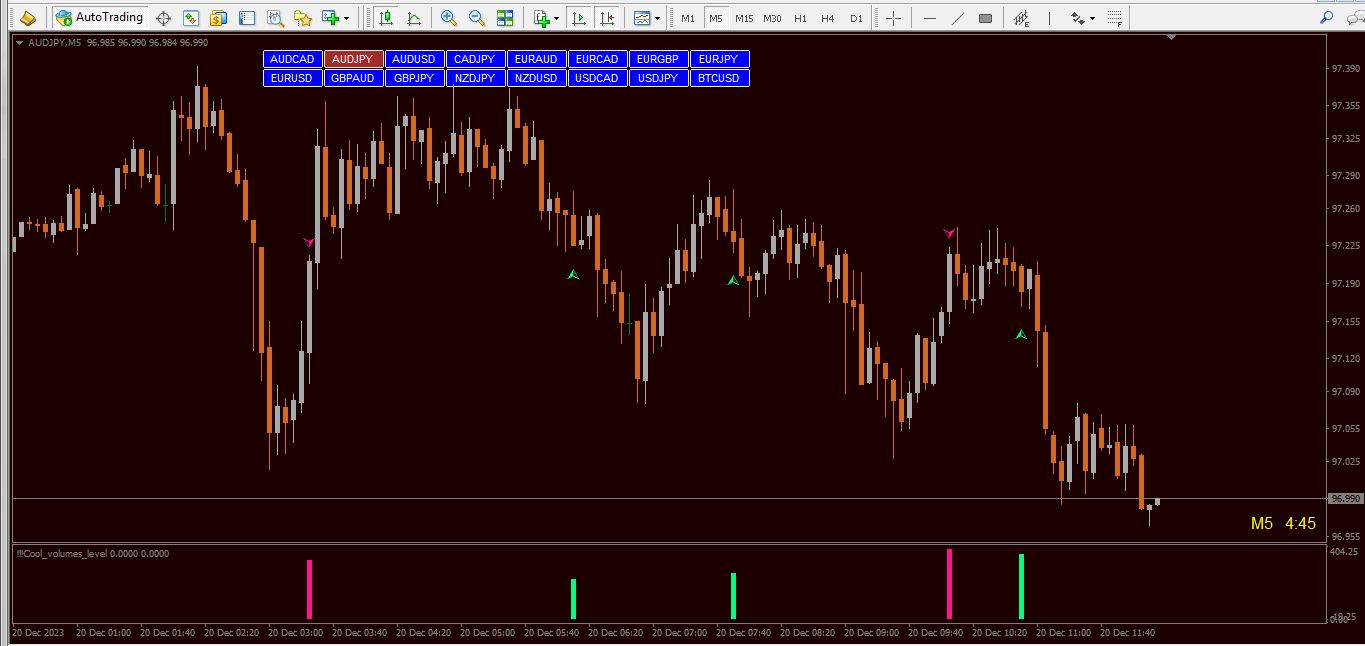
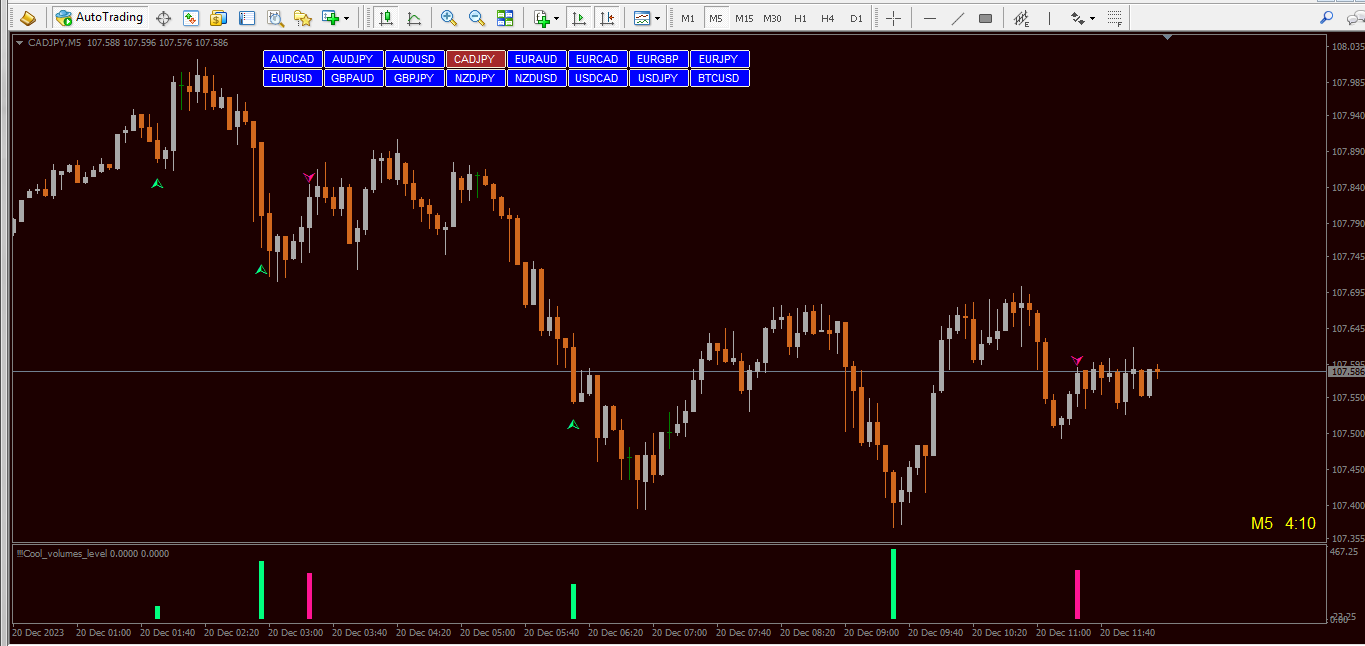
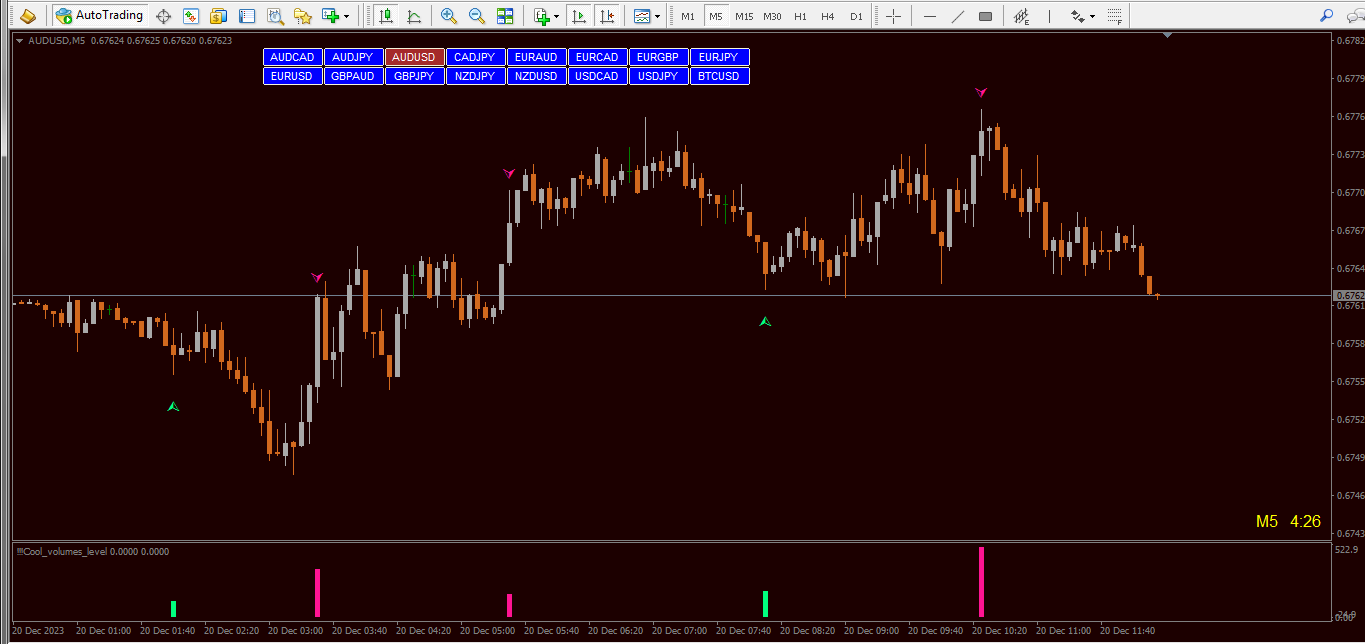
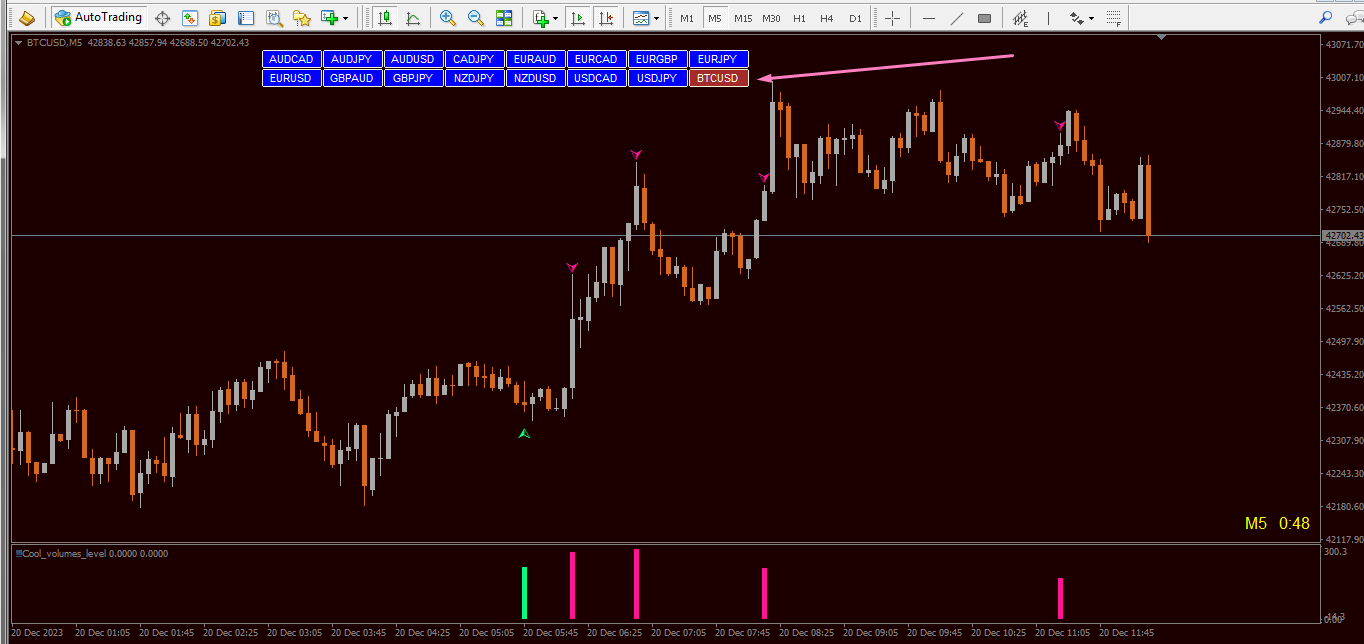
En la ventana inferior, se dibujan gráficos de barras de colores, donde el color verde muestra el predominio de los compradores en este momento, lo que significa una posible inversión inmediata para un aumento en el rango de precios dado. El color rojo indica lo contrario al predominio de los vendedores, lo que significa una posible reversión inmediata a la baja.

Además, para facilitar la percepción Visual, se agregaron flechas directamente a la ventana principal del gráfico.

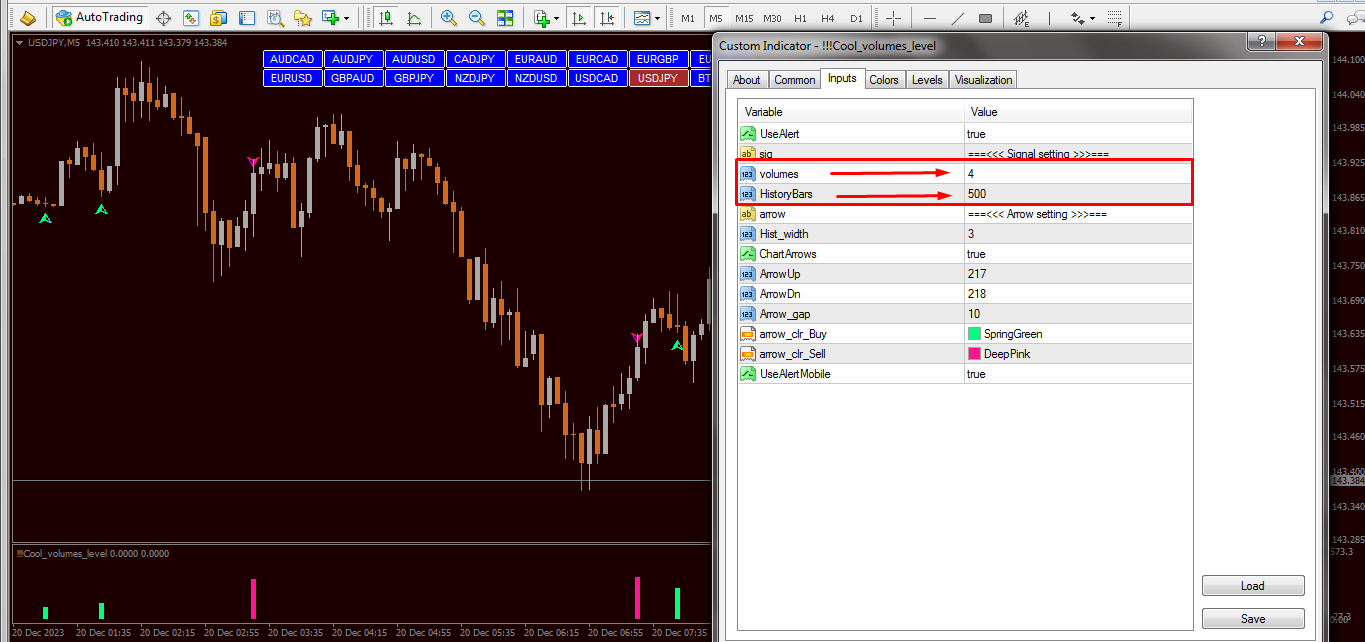
En las variables externas para la comodidad del usuario, se prescriben las variables de configuración para la frecuencia de las señales y su número en el historial (HistoryBars). Pero no se recomienda poner un valor de más de 1000. Más de esto hará que su terminal se ralentice.

También en la sección "===<<< Arrow setting > > > = = = " puede configurar cualquier parámetro de flecha e histograma a voluntad. El grosor del histograma, la distancia de las flechas de las velas, los códigos de flecha y sus colores. O puede desactivar completamente las flechas en la ventana principal del gráfico.

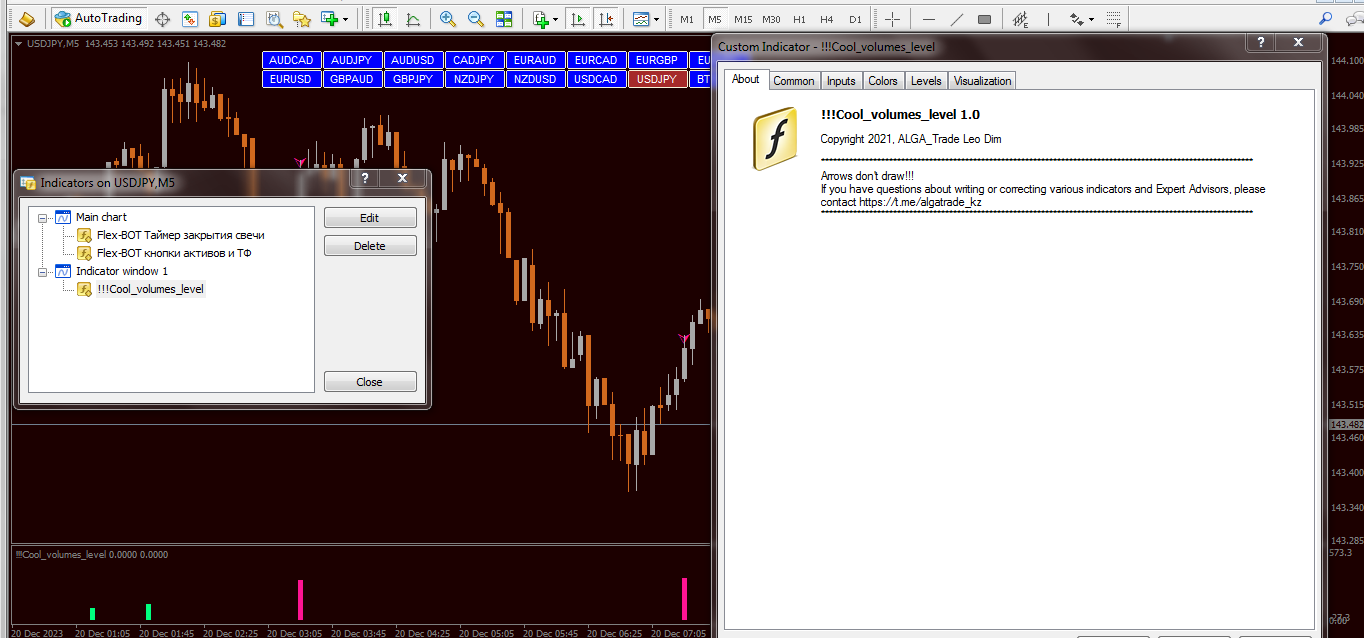
Las flechas y las señales no dibujan en absoluto. Incluso después de cambiar los Marcos de tiempo y actualizar el terminal. ¡Pero es necesario ingresar a las transacciones después de fijar el histograma y la flecha!
Todo el ÉXITO!!!
Productos recomendados
UGenesys Volume MT4
Odaine Ramon Mcmillan
COMPRA ESTE INDICADOR ¡Y OBTÉN NUESTRO BONO SECRETO! ¿Por qué es IMPORTANTE el VOLUMEN? Esta es una de las preguntas más frecuentes que hacen los operadores principiantes. El volumen en el mercado es importante porque es principalmente cuando el mercado está en movimiento. Cuando un mercado tiene un buen volumen, muchas bancos, fondos de cobertura y grandes instituciones participan y mueven los precios hacia arriba o hacia abajo. ESTE ES EL MOMENTO PERFECTO PARA OPERAR. El Indicador de Volumen d
Colored indicator of the linear channel based on the Fibonacci sequence. It is used for making trading decisions and analyzing market sentiment. The channel boundaries represent strong support/resistance levels, as they are the Fibonacci proportion levels. Users can select the number of displayed lines of channel boundaries on the chart by means of the input parameters. Attaching multiple instances of the indicator to the chart with different calculation periods leads to displaying a system of c
Description A colored universal multicurrency/multi-symbol indicator  MACD Classic Smart that consists of two indicators: MACD Line Smart and MACD Histo Smart. Both indicators are based on double or triple moving average . Comparing to the standard MACD Classic this indicator is more sensitive to what allows generating advance signals. he indicator may be used with any broker, irrespective of the name of the financial instrument since it is necessary to manually enter the name as an input parame
I Permanent
Vladimir Gorbachev
Universal adaptable indicator. It determines the estimated trading range for the current day based on the available history a real data, and displays the area of the probable price rollback on the chart. All this thanks to the built-in algorithm that automatically adapts to any behavior models of the market quotes. With the parameters adjusted, the indicator shows its effectiveness on most of the currency pairs, that have a rollback from the reached extremums during the current or the next tradi
Quatre
Maryna Shulzhenko
Quatre is a trend indicator, it indicates well the points of the beginning of the trend and its completion or reversal. This indicator is characterized by the following behavior: After a trend movement appears on the market, the indicator sends a signal of its beginning in the form of arrows. Quatre is a mathematical averaging of prices, and based on this, one can assume the direction of price movement (trend) in the future. Against the background of insignificant fluctuations, it is possible t
ChopEx
Joshua Iyanuoluw Adedeji
The Chop Exploder indicator is a custom indicator that has a long run, tight chop, short chop, and band colour. This indicator has MT4 alert notification,mobile notification, and email notification. The default indexing of all arrays and indicator buffers is left to right. The index of the first element is always equal to zero. Thus, the very first element of an array or indicator buffer with index 0 is by default on the extreme left position, while the last element is on the extreme right posit
Rira Renko
Vitor Palmeira Abbehusen
RENKO on Time Chart This indicator is an enhanced Renko, so you can watch the Renko bricks on the chart to understand price movement more clearly the other improvement is automated box size according to ATR (Average True Range) period you can set the ATR number as you want and the box size of Renko changes automatically based on price movement Inputs Mode: Box size is the input to specify the size of the Renko box you want to print on the chart. This input lets you choose the fixed box siz
Alpha Trend sign has been a very popular trading tool in our company for a long time. It can verify our trading system and clearly indicate trading signals, and the signals will not drift. Main functions: Based on the market display of active areas, indicators can be used to intuitively determine whether the current market trend belongs to a trend market or a volatile market. And enter the market according to the indicator arrows, with green arrows indicating buy and red arrows indicating se
The Vortex Indicator was inspired by the work of an Austrian inventor, Viktor Schauberger, who studied the flow of water in rivers and turbines. Etienne Botes and Douglas Siepman developed the idea that movements and flows within financial markets are similar to the vortex motions found in water. The Vortex Indicator was also partly inspired by J. Welles Wilder's concept of directional movement, which assumes the relationship between price bars gives clues as to the direction of a market. This i
Dynamic Forex28 Navigator
Bernhard Schweigert
5 (5)
Dynamic Forex28 Navigator: la herramienta de trading de Forex de última generación. ACTUALMENTE CON UN 49 % DE DESCUENTO. Dynamic Forex28 Navigator es la evolución de nuestros indicadores populares de larga data, que combina el poder de tres en uno: Indicador avanzado Currency Strength28 (695 reseñas) + Indicador avanzado Currency IMPULSE con ALERT (520 reseñas) + Señales combinadas CS28 (bonificación). Detalles sobre el indicador https://www.mql5.com/en/blogs/post/758844 ¿Qué ofrece el indi
Description A colored multicurrency/multisymbol oscillator of the market mood. The oscillator is designed for detecting the continuation or change of the market mood prior to its occurrence. An excellent example is the screenshots that show all the features of the oscillator. The oscillator may be used with any broker, irrespective of the name of the financial instrument since it is necessary to manually enter the name as an input parameter. If you enter a non-existent or incorrect name of a fin
Profit MACD
Aleksey Ivanov
5 (2)
I present an indicator for professionals. ProfitMACD is very similar to classic MACD in appearance and its functions . However, ProfitMACD is based on completely new algorithms (for example, it has only one averaging period) and is more robust, especially on small timeframes, since it filters random price walks. The classic MACD indicator (Moving Average Convergence / Divergence) is a very good indicator following the trend, based on the ratio between two moving averages, namely the EM
Description:  For a comprehensive understanding of our indicators, we invite you to explore the entire Q&A section within this MQL5 blog post   here . The "Divergence Strategy Indicator" is an advanced technical analysis tool designed to identify potential trend reversals and trend continuation opportunities in the market. It leverages the concept of divergence, a powerful phenomenon that occurs when price action diverges from an oscillator, indicating underlying shifts in market sentiment. Spo
Introduction It is common practice for professional trades to hide their stop loss / take profit from their brokers. Either from keeping their strategy to the themselves or from the fear that their broker works against them. Using this indicator, the stop loss / take profit points will be drawn on the product chart using the bid price. So, you can see exactly when the price is hit and close it manually.  Usage Once attached to the chart, the indicator scans the open orders to attach lines for t
VR Cub
Vladimir Pastushak
VR Cub es un indicador para obtener puntos de entrada de alta calidad. El indicador fue desarrollado para facilitar los cálculos matemáticos y simplificar la búsqueda de puntos de entrada a una posición. La estrategia comercial para la cual se diseñó el indicador ha demostrado su eficacia durante muchos años. La simplicidad de la estrategia comercial es su gran ventaja, que permite que incluso los operadores novatos negocien con éxito con ella. VR Cub calcula los puntos de apertura de posiciones
MetaCOT 2 is a set of indicators and specialized utilities for the analysis of the U.S. Commodity Futures Trading Commission reports. Thanks to the reports issued by the Commission, it is possible to analyze the size and direction of the positions of the major market participants, which brings the long-term price prediction accuracy to a new higher-quality level, inaccessible to most traders. The indicator of absolute positions shows the dynamics of the open positions or the number of traders in
Description:  For a comprehensive understanding of our indicators, we invite you to explore the entire Q&A section within this MQL5 blog post   here . The "Divergence Strategy Indicator" is an advanced technical analysis tool designed to identify potential trend reversals and trend continuation opportunities in the market. It leverages the concept of divergence, a powerful phenomenon that occurs when price action diverges from an oscillator, indicating underlying shifts in market sentiment. Spot
Summary This indicator is based on RSI and Momentum indicators. It also considers moving averages of these two indicators. The three indicators have adjustable settings. The arrows do not repaint since the indicator only uses confirmed values and waits for the candle to close before painting an arrow. The indicator is also able to alert when arrows appear. There are 3 types of alerts - Popup, Email and Mobile Push Notifications. The arrows can be used in the EA and the inputs can also be optimiz
FREE
Current Strength
Nacer Kessir
5 (1)
The indicator (Current Strength) is represented in a separate window by Blue and Pink histogram . The parameter NPeriod represents the number of bars on which we calculate the variation of  forces, the recommended value is 5. The Blue histogram measures the  buyers force , while the Pink  histogram   measures the  sellers force . The change in color signifies the change in strength which leads t he price .  Each  drop (especially below 52.8) after touching levels 96.3 or 1.236 must be condidered
This indicator is designed for M1 time-frame and shows: Sum of ticks when the price goes up (color Green -The major component of a candlestick = the body). Sum of points when the price goes up (color Green -The extension lines at the top of the candle). Sum of points when the price goes down (color Red -The major component of a candlestick = the body). Sum of points when the price goes down (color Red -The extension lines at the lower end of the candle). Keep in mind that Sum of Points will be g
PABT Pattern Indicator - it's classical system one of the signal patterns. Indicator logic - the Hi & Lo of the bar is fully within the range of the preceding bar, look to trade them as pullback in trend. In the way if indicator found PABT pattern it's drawing two lines and arrow what showing trend way.  - First line - it's entry point and drawing at: 1. On the high of signal bar or on middle of the signal bar (depending from indicator mode) for buy; 2. On the low of signal bar or on middle of t
Description A colored universal multicurrency/multi-symbol indicator MACD Line Smart (the indicator moving average convergence divergence is displayed as a histogram) based on double or triple moving average .  Comparing to the standard MACD this indicator is more sensitive to what allows generating advance signals. he indicator may be used with any broker, irrespective of the name of the financial instrument since it is necessary to manually enter the name as an input parameter. If you enter a
Last 50 Pips
Martin Alejandro Bamonte
El indicador Last 50 Pips está diseñado para ayudar a identificar rápidamente oportunidades de compra y venta basadas en el comportamiento reciente de los precios. Mide el cambio de precio en las últimas velas para destacar en color amarillo los momentos en que el precio puede estar cambiando de dirección. Señal de compra: Deberá abrir una operación de COMPRA cuando el indicador cambia de ROJO a AMARILLO , lo que sugiere un cambio de una tendencia bajista a una alcista. Por favor vea las imágen
ADX Pointer
Dominik Mandok
ADX Pointer is an indicator which is based on "Average Directional Index" and draws three numbers in chart window depending on the value of ADX. In ADX Pointer you can set "ADX_Period" which is of course period of Average Directional Index and you can also set 3 levels. When ADX value exceed first level ("ADX_Level1") in chart window appears number "1", when ADX exceed second level ("ADX_Level2") appears "2" and when ADX exceed third level ("ADX_Level3") appears "3". Simple. ADX Pointer works on
A top-quality from the famous XSuper Trend indicator. It is completely loyal to the original algorithm, and implements many useful features Which includes Trend Indicators as Filters like MACD,CCI and Alligator. The Chefs Super Trend Plus Indicator is a great way to identify the current market trend. The indicator shows a clear distinction between uptrends and downtrends. The indicators has optional filters for sound signal. Suitable for the following trending pairs: EUR/USD, GBP/USD, USD/JPY,
Breaking Pro MT4
Tais Miranda Hoffmann
5 (4)
A indicator to show saturation in buying or selling With fast and complex mathematical calculations Easily find saturation points for buying or selling Can be used in all symbols and time frames with many signals Can be combined with different indicators and different time frames With simple settings and simple working methods Features: Can be used on all symbols Can be used in all time frames Can be used in all markets (Forex, stock, etc.) Large number of signals Same performance on all time
Venom
Yaroslav Varankin
Venom indicator is a new type of indicator for scalping with high accuracy of correct predictions in the indicator you can select the indicator signal does not redraw, does not disappear, you can trust it 100% When a red blue arrow appears under the candlestick, an UP option is purchased. When red arrows appear, the DOWN option is purchased. the indicator is based on our new development, if there is an order with a large amount that opens in the direction we need, according to the analysis of th
Market Ticker
John Louis Fernando Diamante
The only Market Ticker on the market! Add a professional novelty to your workspace, with built in mini-charts A scrolling Market Ticker that displays price changes from all symbols in the Market Watch list. Provides an easy snapshot of symbol prices, and keeps scrolling automatically while you trade and analyse the chart. The ticker color (+/- price changes) are based on either the current or completed candle, and the previous candle. Options include: - MTF, eg choose to show price changes of
BoxChart MT4
Evgeny Shevtsov
4.5 (6)
The market is unfair if only because 10% of participants manage 90% of funds. An ordinary trader has slim changes to stand against these "vultures". This problem can be solved. You just need to be among these 10%, learn to predict their intentions and move with them. Volume is the only preemptive factor that faultlessly works on any timeframe and symbol. First, the volume appears and is accumulated, and only then the price moves. The price moves from one volume to another. Areas of volume accumu
Infinity Trend Pro
Yaroslav Varankin
1 (1)
This is a trend indicator without redrawing Developed instead of the binary options strategy (by the color of the Martingale candlestick) Also works well in forex trading When to open trades (binary options) A signal will appear in the place with a candle signaling the current candle It is recommended to open a deal for one candle of the current timeframe M1 and M5 When a blue dot appears, open a deal up When a red dot appears, open a trade down. How to open trades on Forex. When a signal is rec
Los compradores de este producto también adquieren
Gann Made Easy
Oleg Rodin
4.8 (116)
Gann Made Easy es un sistema de comercio de Forex profesional y fácil de usar que se basa en los mejores principios de comercio utilizando la teoría del Sr. W. D. Gann. El indicador proporciona señales precisas de COMPRA y VENTA, incluidos los niveles de Stop Loss y Take Profit. Puede comerciar incluso sobre la marcha utilizando notificaciones PUSH. ¡Por favor, póngase en contacto conmigo después de la compra! ¡Compartiré mis consejos comerciales con usted y excelentes indicadores de bonificació
¡Actualmente 20% OFF ! ¡La mejor solución para cualquier novato o trader experto! Este software funciona con 28 pares de divisas. Se basa en 2 de nuestros principales indicadores (Advanced Currency Strength 28 y Advanced Currency Impulse). Proporciona una gran visión general de todo el mercado de divisas. Muestra los valores de Advanced Currency Strength, la velocidad de movimiento de las divisas y las señales para 28 pares de divisas en todos los (9) marcos temporales. Imagine cómo mejorará
Scalper Inside PRO
Alexey Minkov
4.76 (63)
!SPECIAL SALE! An exclusive indicator that utilizes an innovative algorithm to swiftly and accurately determine the market trend. The indicator automatically calculates opening, closing, and profit levels, providing detailed trading statistics. With these features, you can choose the most appropriate trading instrument for the current market conditions. Additionally, you can easily integrate your own arrow indicators into Scalper Inside Pro to quickly evaluate their statistics and profitability
Golden Trend Indicator
Noha Mohamed Fathy Younes Badr
4.9 (10)
Golden Trend indicator  is The best indicator for predicting trend movement this indicator never lags and never repaints and never back paints    and give  arrow buy and sell    before the candle appear  and it will help you and  will make your trading decisions clearer its work on all currencies and  gold and crypto and all time frame This unique  indicator uses very secret algorithms to catch the  trends, so you can trade using this indicator and see the trend clear on charts  manual guide and
M1 Arrow
Oleg Rodin
5 (17)
Una estrategia intradía basada en dos principios fundamentales del mercado. El algoritmo se basa en el análisis de volúmenes y ondas de precios utilizando filtros adicionales. El algoritmo inteligente del indicador da una señal solo cuando dos factores de mercado se combinan en uno. El indicador calcula ondas de cierto rango en el gráfico M1 utilizando los datos del marco de tiempo más alto. Y para confirmar la onda, el indicador utiliza el análisis por volumen. Este indicador es un sistema come
Scalper Vault
Oleg Rodin
5 (29)
Scalper Vault es un sistema profesional de reventa que le brinda todo lo que necesita para una reventa exitosa. Este indicador es un sistema comercial completo que puede ser utilizado por operadores de divisas y opciones binarias. El marco de tiempo recomendado es M5. El sistema le proporciona señales de flecha precisas en la dirección de la tendencia. También le proporciona señales superiores e inferiores y niveles de mercado de Gann. Los indicadores proporcionan todo tipo de alertas, incluidas
Easy Breakout
Mohamed Hassan
5 (10)
After your purchase, feel free to contact me for more details on how to receive a bonus indicator called VFI, which pairs perfectly with Easy Breakout for enhanced confluence!   Easy Breakout is a powerful price action trading system built on one of the most popular and widely trusted strategies among traders: the Breakout strategy ! This indicator delivers crystal-clear Buy and Sell signals based on breakouts from key support and resistance zones. Unlike typical breakout indicators, it levera
Enigmera
Ivan Stefanov
5 (7)
ENIGMERA: El núcleo del mercado Importante: La demostración de MQL5.com se ejecuta en el Strategy Tester y puede no reflejar completamente la funcionalidad de Enigmera. Consulta la descripción, las capturas de pantalla y el video para más detalles. ¡No dudes en contactarme si tienes alguna pregunta! El código del indicador ha sido completamente reescrito. La versión 3.0 añade nuevas funcionalidades y elimina errores acumulados desde el inicio del indicador. Introducción Este indicador y sistem
Linear Trend Predictor : un indicador de tendencia que combina puntos de entrada y líneas de soporte de dirección. Funciona según el principio de romper el canal de precios altos/bajos. El algoritmo del indicador filtra el ruido del mercado, tiene en cuenta la volatilidad y la dinámica del mercado. Capacidades del indicador  Utilizando métodos de suavizado, muestra la tendencia del mercado y los puntos de entrada para abrir órdenes de COMPRA o VENTA.  Adecuado para determinar los movimientos
GOLD Impulse with Alert
Bernhard Schweigert
4.6 (10)
Este indicador es una super combinación de nuestros 2 productos Advanced Currency IMPULSE with ALERT  +   Currency Strength Exotics . ¡Funciona para todos los marcos de tiempo y muestra gráficamente el impulso de fuerza o debilidad para las 8 divisas principales más un Símbolo! Este Indicador está especializado en mostrar la aceleración de la fuerza de la divisa para cualquier símbolo como Oro, Pares Exóticos, Materias Primas, Índices o Futuros. Es el primero de su clase, cualquier símbolo p
FX Power MT4 NG
Daniel Stein
4.94 (18)
FX Power: Analiza la Fuerza de las Divisas para Decisiones de Trading Más Inteligentes Descripción General FX Power es tu herramienta esencial para comprender la fuerza real de las principales divisas y el oro en cualquier condición de mercado. Al identificar divisas fuertes para comprar y débiles para vender, FX Power simplifica las decisiones de trading y descubre oportunidades de alta probabilidad. Ya sea que quieras seguir las tendencias o anticipar reversiones utilizando valores extremos
Algo Pumping MT4
Ihor Otkydach
5 (4)
PUMPING STATION – Tu estrategia personal "todo incluido" Te presentamos PUMPING STATION, un indicador revolucionario para Forex que transformará tu forma de operar en una experiencia emocionante y eficaz. No es solo un asistente, sino un sistema de trading completo con potentes algoritmos que te ayudarán a operar de forma más estable. Al comprar este producto, recibes GRATIS: Archivos de configuración exclusivos: para una configuración automática y un rendimiento óptimo. Manual en video paso a p
FX Volume
Daniel Stein
4.6 (35)
FX Volume: Experimente el Verdadero Sentimiento del Mercado desde la Perspectiva de un Bróker Resumen Rápido ¿Desea llevar su estrategia de trading a otro nivel? FX Volume ofrece información en tiempo real sobre cómo los traders minoristas y los brókers están posicionados, mucho antes de que aparezcan informes retrasados como el COT. Ya sea que busque beneficios consistentes o simplemente quiera una ventaja más profunda en los mercados, FX Volume le ayuda a identificar desequilibrios important
Volatility Trend System - un sistema de comercio que da señales para las entradas. El sistema de volatilidad da señales lineales y puntuales en la dirección de la tendencia, así como señales para salir de ella, sin redibujar ni demoras. El indicador de tendencia monitorea la dirección de la tendencia a mediano plazo, muestra la dirección y su cambio. El indicador de señal se basa en cambios en la volatilidad y muestra entradas en el mercado. El indicador está equipado con varios tipos de alert
Pruebe "Chart Patterns All in One" en modo demo y obtenga un bono. Envíeme un mensaje después de probarlo en modo demo para recibir su bono. Deja un comentario después de la compra para recibir 8 indicadores de alta calidad como bono. El indicador Chart Patterns All-in-One ayuda a los traders a visualizar varios patrones de gráficos comúnmente utilizados en el análisis técnico. Este indicador apoya la identificación de posibles comportamientos del mercado, pero no garantiza rentabilidad. Se rec
Indicador cíclico para negociar y predecir la dirección del mercado. Muestra el comportamiento cíclico del precio en forma de oscilador. Da señales para abrir tratos al rebotar desde los límites superior e inferior del oscilador. En forma de histograma, muestra la fuerza suavizada de la tendencia. Complementará cualquier estrategia comercial, desde scalping hasta intradía. El indicador no se vuelve a dibujar. Adecuado para su uso en todos los símbolos/instrumentos. Marcos de tiempo adecuados par
Advanced Supply Demand
Bernhard Schweigert
4.91 (294)
¡Actualmente con 33% de descuento! ¡La mejor solución para cualquier tráder principiante o experto! Este indicador es una herramienta comercial única, de alta calidad y asequible, porque incorpora una serie de características patentadas y una nueva fórmula. Con esta actualización, podrá mostrar zonas de doble marco temporal. No solo podrá mostrar un marco temporal más alto, sino también mostrar ambos, el marco temporal del gráfico MÁS el marco temporal más alto: MOSTRANDO ZONAS ANIDADAS. A todos
ACTUALMENTE 26% DE DESCUENTO ¡La mejor solución para cualquier operador novato o experto! Este indicador es una herramienta única, de alta calidad y asequible porque hemos incorporado una serie de características propias y una nueva fórmula. ¡Con sólo UN gráfico puede leer la Fuerza de la Divisa para 28 pares de Divisas! Imagínese cómo mejorará su operativa porque podrá señalar el punto exacto de activación de una nueva tendencia o de una oportunidad de scalping. Manual del usuario: haga cli
Hydra Trend Rider is a non-repainting, multi-timeframe trend indicator that delivers precise buy/sell signals and real-time alerts for high-probability trade setups. With its color-coded trend line, customizable dashboard, and mobile notifications, it's perfect for traders seeking clarity, confidence, and consistency in trend trading. Download the Metatrader 5 Version Message us here after purchase to get the Indicator Manual. Download Now! Offer valid only for next 10 Buyers. Price will increas
Volume Break Oscillator es un indicador que combina el movimiento de precios con las tendencias de volumen en forma de oscilador. Quería integrar el análisis de volumen en mis estrategias, pero siempre me han decepcionado la mayoría de los indicadores de volumen, como OBV, Money Flow Index, A/D, pero también Volume Weighted Macd y muchos otros. Por lo tanto, escribí este indicador para mí mismo, estoy satisfecho con su utilidad y, por lo tanto, decidí publicarlo en el mercado. Características
El Sincronizador de Ondas es un indicador visual de análisis de ondas. Combina secuencias de movimiento de velas y construye ondas direccionales, produciendo movimientos sincronizados con el mercado. El inicio de cada onda comienza con una flecha de señal; también incluye alertas. El indicador nunca redibujará ni moverá las flechas en el historial anterior. Las flechas de señal aparecen al cierre de la vela. Compatible con cualquier instrumento de trading y marco temporal. Fácil de usar y confi
Candle Probability Scalper
Martin Alejandro Bamonte
Guía de Uso del Candle Probability Scalper Este indicador hace que el scalping sea facil y 100% intuitivo. Candle Probability Scalper te mostrará de un vistazo los datos de los porcentajes de fuerza de compradores y vendedores en TIEMPO REAL , y en la vela actual. Los porcentajes se actualizan en cada tick, con lo que segundo a segundo sabrás lo que están haciendo la mayoría de compradores y vendedores, sin ningún tipo de retrasos, esto te ayudará inmensamente a determinar o confirmar cual es la
IQ Gold Gann Levels a non-repainting, precision tool designed exclusively for XAUUSD/Gold intraday trading. It uses W.D. Gann’s square root method to plot real-time support and resistance levels, helping traders spot high-probability entries with confidence and clarity. William Delbert Gann (W.D. Gann) was an exceptional market analyst, whose trading technique was based on a complex blend of mathematics, geometry, astrology, and ancient mathematics which proved to be extremely accurate. Download
Legacy of Gann
Pavel Zamoshnikov
4.83 (12)
The indicator very accurately determines the levels of the possible end of the trend and profit fixing. The method of determining levels is based on the ideas of W.D.Gann, using an algorithm developed by his follower Kirill Borovsky. Extremely high reliability of reaching levels (according to K. Borovsky  - 80-90%) Indispensable for any trading strategy – every trader needs to determine the exit point from the market! Precisely determines targets on any timeframes and any instruments (forex, met
Gold Venamax MT4
Sergei Linskii
2 (1)
Gold Venamax : este es el mejor indicador técnico de acciones. El algoritmo del indicador analiza el movimiento del precio de un activo y refleja la volatilidad y las posibles zonas de entrada. Características del indicador: Este es un súper indicador con Magia y dos bloques de flechas de tendencia para un comercio cómodo y rentable. El botón rojo para cambiar de bloque se muestra en el gráfico. La magia se establece en la configuración del indicador, por lo que puede instalar el indicador en
IQ FX Gann Levels a precision trading indicator based on W.D. Gann’s square root methods. It plots real-time, non-repainting support and resistance levels to help traders confidently spot intraday and scalping opportunities with high accuracy. William Delbert Gann (W.D. Gann) was an exceptional market analyst, whose trading technique was based on a complex blend of mathematics, geometry, astrology, and ancient mathematics which proved to be extremely accurate. Download the Metatrader 5 Version M
Volume by Price MT4
Brian Collard
4.67 (12)
Volume Profile, Footprint and Market Profile TPO (Time Price Opportunity). Volume and TPO histogram bar and line charts. Volume Footprint charts. TPO letter and block marker collapsed and split structure charts. Static, dynamic and flexible range segmentation and compositing methods with relative and absolute visualizations. Session hours filtering and segment concatenation with Market Watch and custom user specifications. Graphical layering, positioning and styling options to suit the user's a
Grabber System MT4
Ihor Otkydach
3 (2)
Te presento un excelente indicador técnico: Grabber, que funciona como una estrategia de trading "todo incluido" lista para usar. En un solo código se integran potentes herramientas de análisis técnico del mercado, señales de trading (flechas), funciones de alertas y notificaciones push. Cada comprador de este indicador recibe además de forma gratuita: Grabber Utility: una herramienta para la gestión automática de órdenes abiertas Video manual paso a paso: cómo instalar, configurar y operar con
KT Asian Breakout Indicator
KEENBASE SOFTWARE SOLUTIONS
El indicador KT Asian Breakout analiza una parte clave de la sesión asiática para generar señales de compra y venta en ambas direcciones, basadas en la ruptura del precio. Se genera una señal de compra cuando el precio rompe por encima del máximo de la sesión y una señal de venta cuando el precio rompe por debajo del mínimo de la sesión. Cosas a tener en cuenta Si la caja de la sesión es demasiado ancha verticalmente, se recomienda evitar nuevas operaciones, ya que la mayor parte de la acción d
AT Forex Indicator MT4
Marzena Maria Szmit
5 (3)
The AT Forex Indicator MT4 is a sophisticated trading tool designed to provide traders with a comprehensive analysis of multiple currency pairs. This   powerful indicator   simplifies the complex nature of the forex market, making it accessible for both novice and experienced traders. AT Forex Indicator uses   advanced algorithms   to detect trends, patterns and is an essential tool for traders aiming to enhance their forex trading performance. With its robust features, ease of use, and reliabl
Otros productos de este autor
El indicador para Forex y opciones Binarias está escrito sobre la base de 2 indicadores estándar en MT4: ADX y RVI. Las señales se reciben cuando las líneas de ambos indicadores se cruzan simultáneamente. Pero también en los códigos se prescriben y las señales inversas. Esto es cuando las señales se convierten a la inversa. También puede activar y desactivar cada uno de los indicadores. Y también en RVI, puede usar 2 tipos de señales: 1) simplemente cuando una línea está por encima/por debajo
Super volumes
Yerzhan Satov
4 (1)
El indicador de Dial para Forex y opciones Binarias se basa en volúmenes de ticks. A diferencia de muchos indicadores de volumen, el indicador "Super volumes" calcula volúmenes alcistas y bajistas y emite señales sobre el predominio de cualquiera de ellos. Si decimos que en este momento en este rango hubo una ventaja de volúmenes alcistas, entonces la señal estará en Buy. O si el predominio fue de volúmenes bajistas, entonces, en consecuencia, la señal estará en Sell. En la configuración del i
El indicador de Dial "anaconda LD" es un indicador de inversión para el mercado Forex y principalmente para las opciones binarias. El algoritmo está escrito sobre la base de patrones de inversión. Es mejor usarlo junto con otros indicadores para filtrar las señales. Incluso con indicadores estándar en MT4, incluso con otros indicadores personalizados. Cualquier indicador de canal o nivel es especialmente adecuado... Debe elegir el tiempo de caducidad para diferentes activos. Que es de 1-5 barr
Cripton
Yerzhan Satov
El indicador de Dial para opciones Binarias y Forex es un indicador de inversión. Creado y escrito sobre la base de patrones de inversión. Se recomienda para las opciones Binarias para ponerlo en el gráfico M5. Entrar en las transacciones de 1-3 bares. En diferentes activos, dependiendo de las sesiones de negociación, debe seleccionar su tiempo de caducidad.  En las variables externas, puede cambiar la configuración. Por lo tanto, es posible aumentar y disminuir la frecuencia de las señales. L
El indicador de Dial "Create a cool signal" para el mercado de opciones Binarias y Forex es una especie de constructor de sus señales! En el que usted mismo puede elegir sus condiciones de señal en base a los indicadores estándar de 10 y registrados en él en MT4 y más otro indicador de búfer de terceros, que puede agregar a la variable "indicadores de búfer". ¡Es fácil! Escriba el nombre de su indicador y escriba sus números (los encontrará en la sección de colores donde se indican los números
El indicador de opciones Binarias y Forex "Highway profits" se basa en el principio de encontrar el precio detrás de las líneas del canal. Después de que el precio salga del canal y gradualmente comience a volver a él, entonces aparecerán las señales. Operar con este indicador es muy fácil y conveniente. E incluso un comerciante principiante o un comerciante con muchos años de experiencia puede comerciar con ellos. Para cada activo, debe seleccionar su configuración. Por ejemplo, el período de
El indicador de señal Space signals es mi nuevo desarrollo para el comercio en los mercados de divisas y opciones Binarias. El algoritmo del indicador está escrito para que rastree la tendencia y dé señales al final del movimiento correctivo del precio. En la configuración, puede configurar el período de las señales. Cuanto mayor sea el valor en la variable "período", más raras serán las señales. Pero naturalmente serán de mayor calidad.  También puede elegir a su gusto los códigos de flecha
El indicador para el comercio en el mercado de divisas y opciones Binarias está escrito sobre la base del indicador estándar MT4 de una Media Móvil Simple. Pero la diferencia con el indicador estándar es que sus líneas se repintan en diferentes colores dependiendo del estado de la tendencia. Si el color es verde, entonces la tendencia de compra. Si es rojo, a la venta. Durante el cambio de la fase de tendencia, aparece una alerta de sonido junto con un búfer en el gráfico en el medio de las líne
The new Dynamic PACK Hi Tf indicator is based on tick volumes. The middle line shows the average price for the selected period of the selected senior timeframe. The upper and lower lines show the maximum/minimum of the same selected period of the same timeframe. In the settings, the user can optionally choose which timeframe and bar calculation period he needs. You can also change the style, thickness, and color of each of the lines.  In the "StsrtBars" parameter, you can select the start peri
The Level DELTA indicator for MetaTrader 4 (MT4) – a powerful volume analysis tool that stands out with its capabilities and accuracy. Indicator Description The Level DELTA indicator is designed for volume analysis in a separate MT4 window. Its main task is to identify and display divergences, allowing traders to make more informed and timely decisions. Indicator Features Volume Analysis : The indicator analyzes volumes in financial markets, allowing you to see how volumes are distributed over d
The "Volume POC WVAP" Indicator is a revolutionary tool for traders seeking in-depth analysis across various financial markets. This unique indicator, based on tick volumes in the MT4 terminal, provides indispensable information for making informed trading decisions in the following markets: Forex, binary options, cryptocurrency, spot, futures, and indices. Key Features: WVAP Line: Weighted Volume Average Price: The WVAP calculates the weighted volume average price on the selected timeframe, all
Quantum Dynamic POC Hi Tf for MT5 Description: The "Quantum Dynamic POC Hi Tf" is a unique indicator developed for volume analysis. It is suitable for both real volumes (on futures contracts) and tick volumes (on the Forex market). The indicator is a channel tool consisting of three lines that dynamically change depending on the selected timeframe: Middle Line : the main dynamic Point of Control (POC), which reflects the average volume price. Upper Line : the maximum of the selected timeframe. L
The Quantum   DELTA indicator for MetaTrader 5 (MT5) – a powerful volume analysis tool that stands out with its capabilities and accuracy. Indicator Description The Quantum   DELTA indicator is designed for volume analysis in a separate MT5 window. Its main task is to identify and display divergences, allowing traders to make more informed and timely decisions. Indicator Features Volume Analysis : The indicator analyzes volumes in financial markets, allowing you to see how volumes are distribute
Title: MACD Signals Discover the MACD Signals indicator – your reliable assistant in the world of trading! Description: The "MACD Signals" indicator is designed to make your trading more successful and efficient. It displays signals on the main chart as bright vertical lines that are easy to spot. You can customize the color and thickness of these lines to perfectly match your style and preferences. Features: Signals: Vertical lines on the main chart that stand out among other elements.
Filtro:
No hay comentarios
Respuesta al comentario