Visual Depth of Market
- Indicadores
- Fernando Lahude Ritter
- Versión: 5.0
- Actualizado: 1 abril 2025
ATTENTION: Bear in mind this indicator will ONLY work with your broker/symbols has Level2 data otherwise NOTHING will be shown
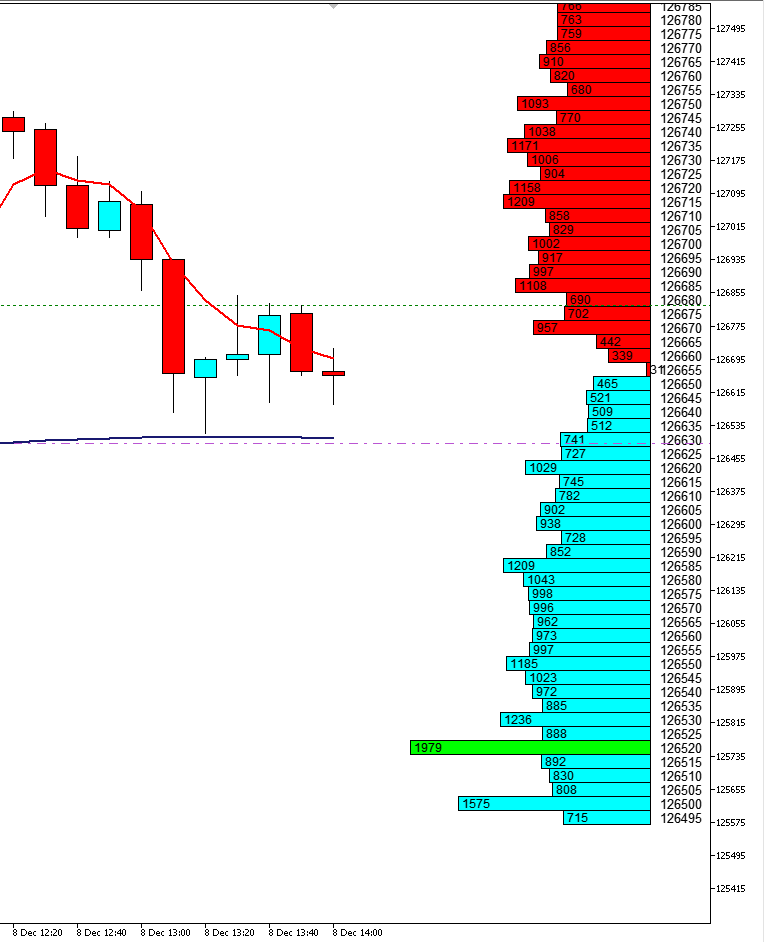
Level 2 Book Visualization Indicator
Our innovative indicator seamlessly integrates Level 2 order book data onto your trading chart, offering a real-time view of market depth and the dynamics of supply and demand. With its two key features, you can enhance your market analysis and make more informed trading decisions:
-
Biggest Volume Highlight: This input allows traders to instantly identify the price levels with the largest order lots. By highlighting the heaviest concentration of buy or sell orders, you can easily spot potential support and resistance areas shaped by market participants.
-
Auto-Center Functionality: With the convenience of our Auto-Center feature, the visualization of the order book automatically adjusts to align with the last traded price. This ensures that you are always viewing the most relevant order book data without manual scrolling or adjustment, keeping you focused on the action where it matters most.
Whether you are day trading or analyzing market structure for longer-term strategies, our Level 2 Book Visualization Indicator empowers you with deeper insight into the market's potential next moves.


useful