Black horse indicator MT5
- Indicadores
- Shengzu Zhong
- Versión: 1.22
- Actualizado: 2 junio 2024
- Activaciones: 10
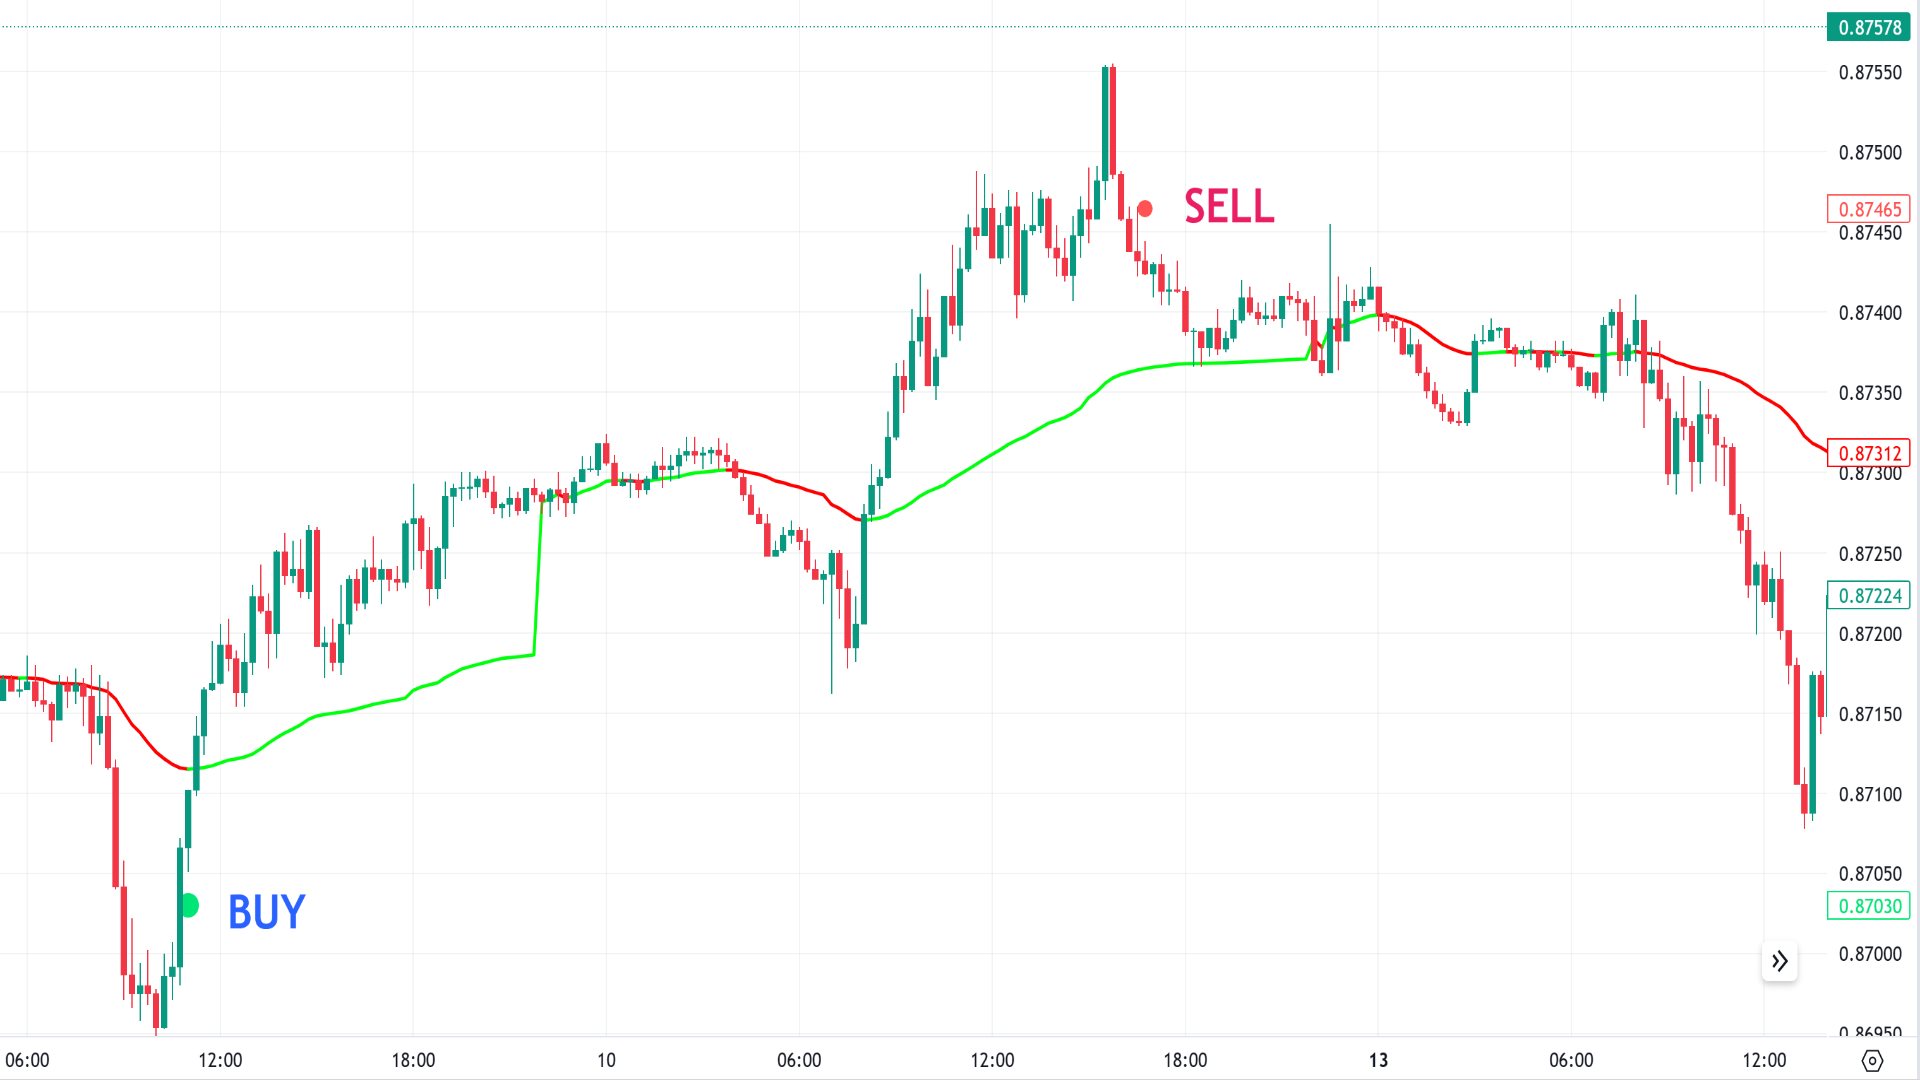
El objetivo del indicador "Black Horse" es identificar divergencias entre la acción del precio y el indicador VWAP. Emplea filtros para descartar posibles divergencias falsas y generar alertas de alta calidad y precisas.
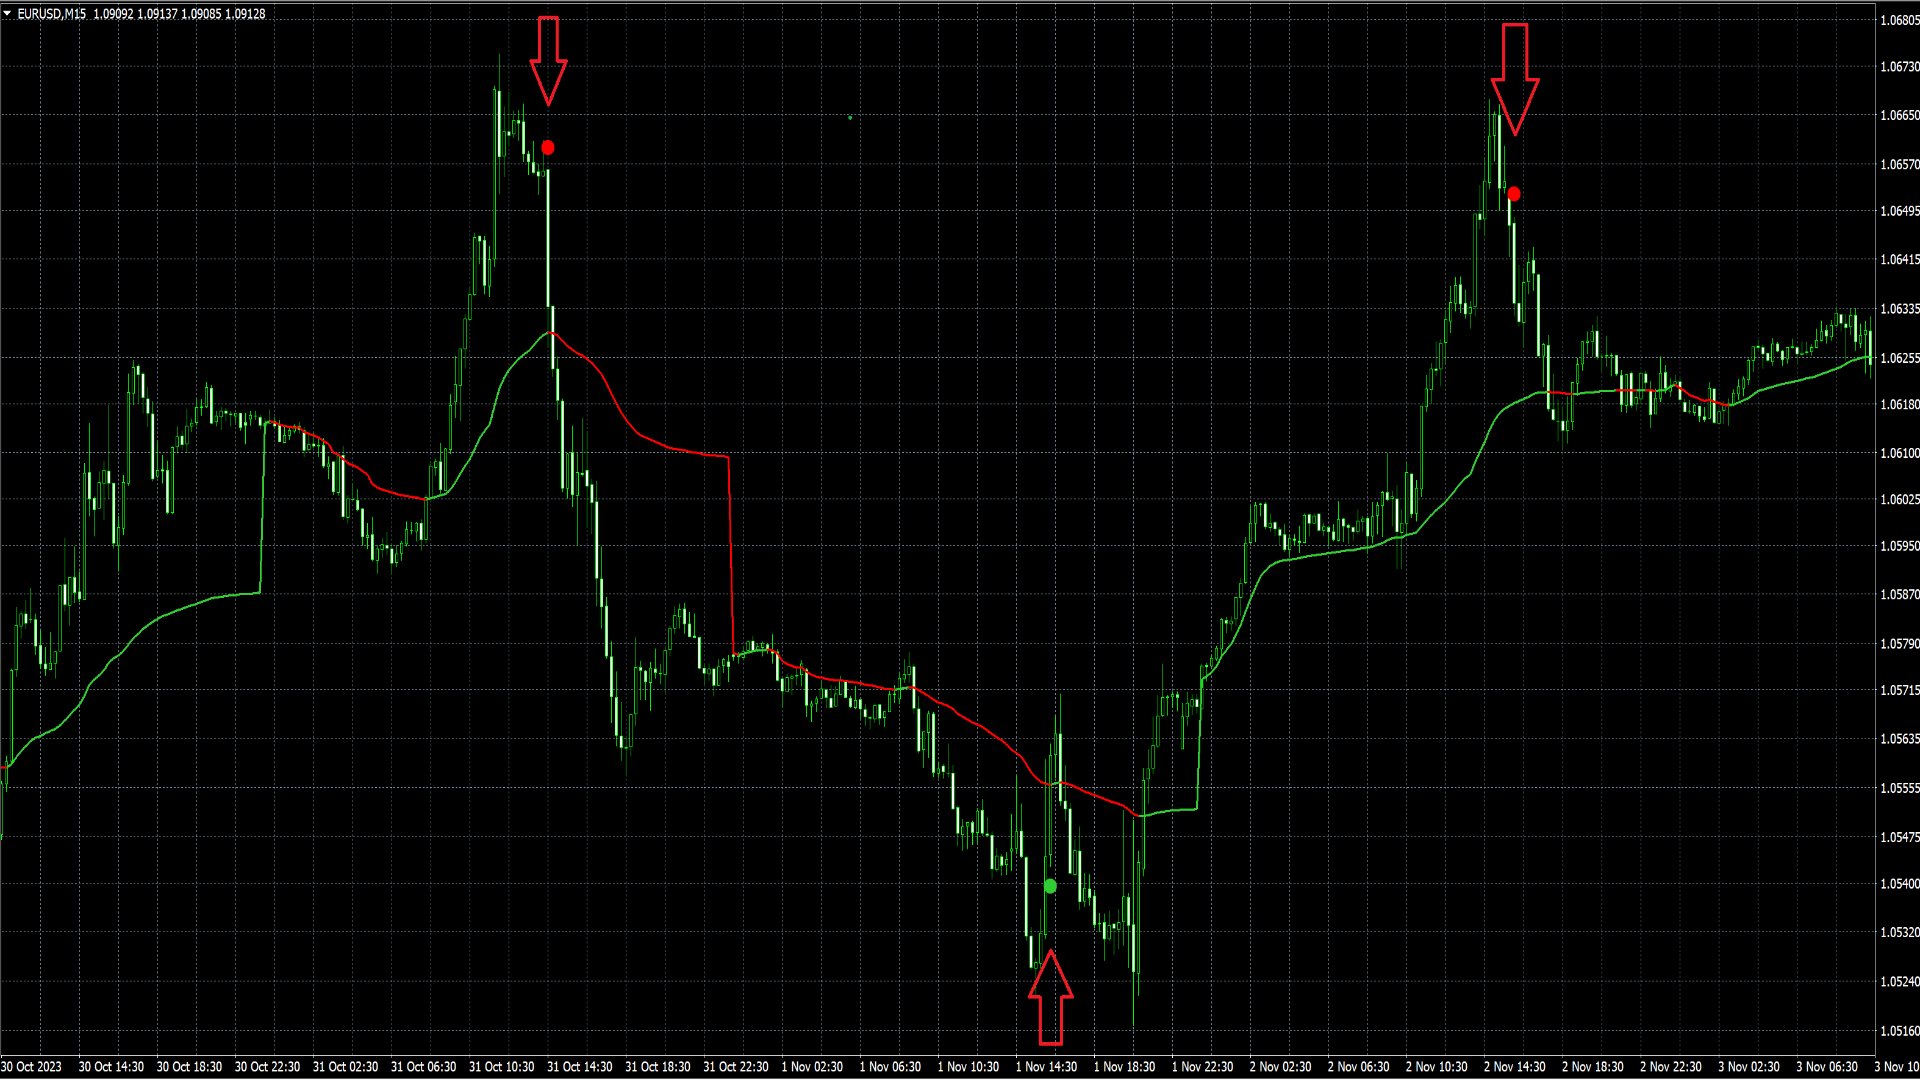
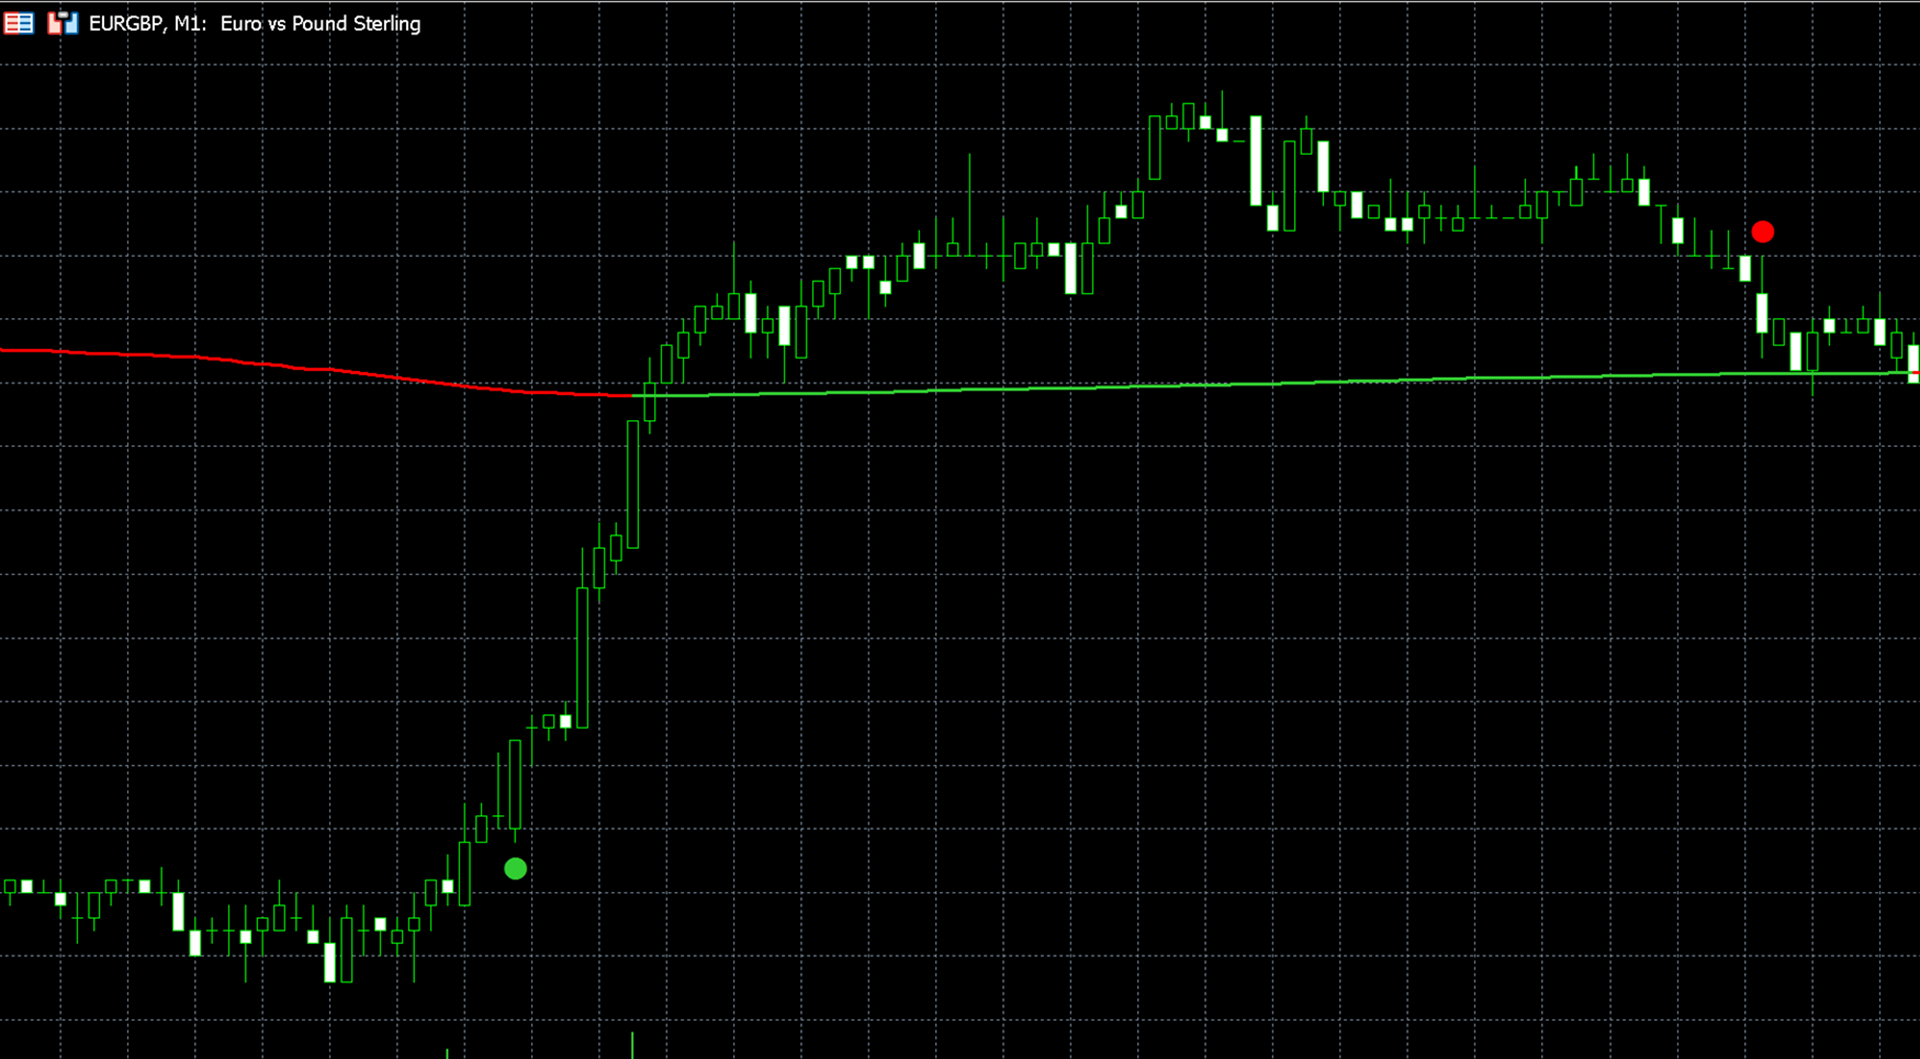
Las divergencias bajistas se representan con puntos rojos sobre la vela, mientras que las divergencias alcistas se muestran con puntos verdes debajo de la vela.
El filtro principal para las divergencias se centra en el ATR (Rango Verdadero Medio) y el movimiento del precio en las velas anteriores dentro del período de revisión. Las divergencias se identifican cuando el movimiento del precio durante el período de revisión es lo suficientemente agudo como para superar el multiplicador ATR multiplicado por el ATR.
Debido a las características del cálculo, se recomienda establecer valores más bajos para el multiplicador ATR y el período de revisión al trabajar con marcos temporales más altos. En marcos temporales más altos, donde los movimientos de precio tienden a ser más suavizados, como en el gráfico de 15 minutos, las fluctuaciones bruscas de precio ocurren con menos frecuencia y generalmente se contienen en menos velas en comparación con marcos temporales más bajos. Las acciones con menor volatilidad, como HSBC, también deben usar multiplicadores ATR más bajos y períodos de revisión más cortos.
En la sección de "Configuración Visual", tienes la opción de cambiar el color de la línea VWAP, mostrar colores alternos para el VWAP, ajustar el tamaño de las señales de divergencia y mostrar u ocultar la línea VWAP.